Report market as on 15 july
•
1 like•257 views

market, business, equity research, commodities, global, trade, investment banking, merger and acquisation, market update, corporte advisory

Recommended
More Related Content
What's hot
What's hot (19)
Viewers also liked
Similar to Report market as on 15 july
Similar to Report market as on 15 july (20)
More from Cogent Affiliate Network
Recently uploaded
Recently uploaded (20)
Report market as on 15 july
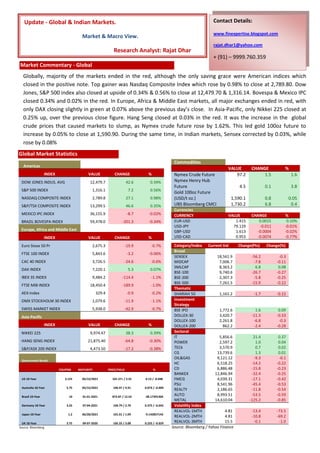
- 1. Update - Global & Indian Markets. Contact Details: www.finexpertise.blogspot.com Market & Macro View. rajat.dhar1@yahoo.com Research Analyst: Rajat Dhar + (91) – 9999.760.359 Market Commentary - Global Globally, majority of the markets ended in the red, although the only saving grace were American indices which closed in the positive note. Top gainer was Nasdaq Composite Index which rose by 0.98% to close at 2,789.80. Dow Jones, S&P 500 index also closed at upside of 0.34% & 0.56% to close at 12,479.70 & 1,316.14. Bovespa & Mexico IPC closed 0.34% and 0.02% in the red. In Europe, Africa & Middle East markets, all major exchanges ended in red, with only DAX closing slightly in green at 0.07% above the previous day’s close. In Asia-Pacific, only Nikkei 225 closed at 0.25% up, over the previous close figure. Hang Seng closed at 0.03% in the red. It was the increase in the global crude prices that caused markets to slump, as Nymex crude future rose by 1.62%. This led gold 100oz future to increase by 0.05% to close at 1,590.90. During the same time, in Indian markets, Sensex corrected by 0.03%, while rose by 0.08% Global Market Statistics Commodities Americas VALUE CHANGE % INDEX VALUE CHANGE % Nymex Crude Future 97.2 1.5 1.6 DOW JONES INDUS. AVG 12,479.7 42.6 0.34% Nymex Henry Hub Future 4.5 0.1 3.8 S&P 500 INDEX 1,316.1 7.2 0.56% Gold 100oz Future NASDAQ COMPOSITE INDEX 2,789.8 27.1 0.98% (USD/t oz.) 1,590.1 0.8 0.05 S&P/TSX COMPOSITE INDEX 13,299.5 46.6 0.35% UBS Bloomberg CMCI 1,730.2 6.8 0.4 Currencies MEXICO IPC INDEX 36,155.9 -8.7 -0.02% CURRENCY VALUE CHANGE % BRAZIL BOVESPA INDEX 59,478.0 -201.3 -0.34% EUR-USD 1.415 0.0015 0.10% USD-JPY 79.129 -0.011 -0.01% Europe, Africa and Middle East GBP-USD 1.613 -0.0004 -0.02% INDEX VALUE CHANGE % USD-CAD 0.953 -0.0074 -0.77% Euro Stoxx 50 Pr 2,675.3 -19.9 -0.7% Category/Index Current Val Change(Pts) Change(%) Broad FTSE 100 INDEX 5,843.6 -3.2 -0.06% SENSEX 18,561.9 -56.2 -0.3 CAC 40 INDEX 3,726.5 -24.6 -0.6% MIDCAP 7,006.7 -7.8 -0.11 SMLCAP 8,363.2 6.8 0.08 DAX INDEX 7,220.1 5.3 0.07% BSE-100 9,740.6 -26.7 -0.27 IBEX 35 INDEX 9,484.2 -114.4 -1.1% BSE-200 2,307.3 -5.8 -0.25 BSE-500 7,261.5 -15.9 -0.22 FTSE MIB INDEX 18,450.4 -189.9 -1.0% Thematic AEX-Index 329.4 -0.9 -0.2% SHARIAH 50 1,161.2 -1.7 -0.15 OMX STOCKHOLM 30 INDEX 1,079.6 -11.9 -1.1% Investment Strategy SWISS MARKET INDEX 5,938.0 -42.9 -0.7% BSE IPO 1,772.6 1.6 0.09 Asia-Pacific DOLLEX-30 3,420.7 -11.3 -0.33 DOLLEX-100 2,261.8 -6.8 -0.3 INDEX VALUE CHANGE % DOLLEX-200 862.2 -2.4 -0.28 NIKKEI 225 9,974.47 38.3 0.39% Sectoral IT 5,856.6 21.4 0.37 HANG SENG INDEX 21,875.40 -64.8 -0.30% POWER 2,597.2 1.0 0.04 S&P/ASX 200 INDEX 4,473.50 -17.2 -0.38% TECk 3,570.9 0.7 0.02 CG 13,739.6 1.3 0.01 OIL&GAS 9,121.12 -9.3 -0.1 Government Bonds HC 6,518.25 -14.2 -0.22 COUPON MATURITY PRICE/YIELD % CD 6,886.48 -15.8 -0.23 BANKEX 12,846.94 -32.4 -0.25 US 10-Year 3.125 05/15/2021 101-27+ / 2.91 0-13 / -0.048 FMCG 4,039.31 -17.1 -0.42 PSU 8,541.96 -45.4 -0.53 Australia 10-Year 5.75 05/15/2021 106.47 / 4.91 0.074 / -0.009 REALTY 2,186.65 -11.8 -0.54 Brazil 10-Year 10 01-01-2021 872.87 / 12.53 -38.17391304 AUTO 8,993.51 -53.5 -0.59 METAL 14,610.04 -125.2 -0.85 Germany 10-Year 3.25 07-04-2021 104.79 / 2.70 0.375 / -0.042 Volatility Index REALVOL-1MTH 4.81 -13.4 -73.5 Japan 10-Year 1.2 06/20/2021 101.01 / 1.09 -9.142857143 REALVOL-2MTH 4.81 -10.8 -69.2 UK 10-Year 3.75 09-07-2020 105.33 / 3.08 0.235 / -0.029 REALVOL-3MTH 15.5 -0.1 -1.0 Source: Bloomberg Source: Bloomberg / Yahoo Finance
- 2. Prior period cross comparison of Indices Wk (%) Month (%) Year (%) 5.0 3.9 3.4 3.8 3.7 3.6 2.3 2.8 1.6 0.2 0.9 0.5 SENSEX MIDCAP SMALL CAP BSE 100 BSE 200 BSE 500 SHARIAH 50 -0.1 -1.1 -1.0 -0.8 -0.8 -1.6 -5.3 -5.3 -11.4 *% change over previous days close Source: www.bseindia.com As the week ended on 15Th July, it was BSE Sectoral Performance only BSE Oil & Gas, BSE Health Care which closed at a positive of 1.12% & -0.85 IT POWER -0.59 TECH CG 1.26% above the last week’s close. -0.54 However, for the same duration Sensex OIL&GAS HC -0.53 fell by 1.57%. Over a 1-Yr period only -0.42 CD BANKEX Consumer Durables and FMCG have -0.25 FMCG PSU posted returns above 20%, while as -0.23 Power / Oil & Gas have fell by more than -0.22 REALTY AUTO 10%. (Graph : Above) -0.1 METAL 0.01 IT , Power & Tech stocks tried to keep 0.02 market up. However, Metals, Auto 0.04 0.37 realty, PSU, FMCG, Bankex, etc ended in the negative note. (Graph : RHS) -1 -0.5 0 0.5 Source: www.bseindia.com *% change over previous days close Top 3 BSE Sectoral Gainers Top 3 BSE Sectoral Losers FOREX Index Current Value Change (%) Index Current Value Change (%) End Date INR/EUR INR/USD INR/GBP IT 5856.64 5,856.64 0.37 0.3 METAL 14,610.04 -0.8 15-07-2011 1.3% 0.8% 0.3% POWER 2597.2 2,597.2 0.04 0.1 AUTO 8,993.51 -0.6 14-07-2011 2.1% 0.7% 1.2% TECk 3570.9 3,570.9 0.02 REALTY 2,186.65 -0.5 13-07-2011 2.5% 0.5% 1.6% 12-07-2011 1.7% 0.8% 1.3% Source: www.bseindia.com Source: www.bseindia.com Source: www.oanda.com Derivatives Market Watch Derivatives Market Watch Underlying Expiry of Strike price Net Change Turnover Spot Price OI Value Asset contract (Rs.) Quantity LTP/Close (Rs.) (Rs.) (Rs.Lac.) (Rs.) (Rs.Lac.) SENSEX 11-Aug-11 - 1020 18628 -188 189 18561.92 86.56 Source: www.bseindia.com On the Forex front, INR saw grew stronger against USD by 0.81%, GBP by 0.29% & EUR by 1.29% at the back drop of American debt problems and the economic instability in Europe, on the last day of week. Derivative market, with sensex as underlying asset (having contract expiry at 11-Aug-11), saw a turnover of INR 189 lac/-.
- 3. Sensex – Top Gainers & Losers -1.9 ONGC TCS, M&M and Wipro closed the day on -2.0 Sterlite Inds 15th-Jul in green with TCS gaining 2.03%. -2.6 Tata Motors Wipro 0.7 While as, Tata Motors, Sterlite & ONGC Mahindra & Mahindra 0.8 closed in red, with Tata Motors going down by 2.61% over the previous day’s close. TCS 2.0 -3 -2 -1 0 1 2 3 *% change over previous days close ICDM – Indian Corporate Debt Market ICDM saw the trade of INR 14,463.00 lacs as per the last data available. Largest turnover of INR 7500 lacs was seen in LIC Housing Finance Ltd, which currently has a yield of 9.7% with 9.85% coupon rate maturing on 07 July’13. Among the top 3 most traded, the other two are Tata Motors Ltd & SBI. 15 Jul 11 | 17:27 Coupon Maturity Wt.Avg Turnover Issuer Name LTP Yield (%) Date Price (Rs lacs) LIC HOUSING FINANCE LTD 9.85 07-07-2013 100.2 100.2 9.7 7,500 TATA MOTORS LIMITED 9.75 24-05-2020 97.0 97.0 10.2 2,000 STATE BANK OF INDIA 9.95 16-03-2026 103.9 103.9 9.4 2,000 POWER FINANCE CORPORATION LIMITED 9.61 29-06-2021 101.6 101.3 9.3 1,540 TATA POWER LIMITED 11.4 02-06-2099 100.9 100.8 10.8 720 WEST BENGAL STATE ELECTRICITY DISTCO LTD 9.34 25-06-2025 94.9 94.9 10.0 310 INDIAN INFRASTRUCTURE FINANCE COMPANY LTD 6.85 22-01-2014 98.6 98.6 7.4 300 HOUSING DEVELOPMENT FINANCE CORPORATION LTD 9.4 13-04-2021 99.2 99.2 9.5 30 INDIAN RAILWAY FINANCE CORP. 9.57 31-05-2021 103.0 102.9 9.1 30 TATA STEEL LIMITED 11.5 11-05-2099 106.2 104.6 10.9 20 PUNJAB NATIONAL BANK 9.45 29-12-2099 99.5 99.5 9.4 10 SHRIRAM TRANSPORT FINANCE COMPANY LIMITED 10.35 22-11-2019 101.7 101.7 10.0 3 Total 14,463.00 Source: www.nse-india.com Mutual Fund Inter-Scheme Transfer 14 Jul 11 | 13:02 Weighted Security** Issuer Name Coupon (%) Maturity Date LTP Average Turnover Code Price Yield (Rs. lakh) Total 20,000.00 685LICH11 LIC HOUSING FINANCE LTD 6.85 28-09-2011 99.5 99.5 8.82 18,000.00 INDUSTRIAL DEVELOPMENT BANK OF 1135IDBI13 INDIA 11.35 15-12-2013 102.2 102.2 10.19 2,000.00 **Note : Rate is per Rs. 100/- of face value. MF Inter-scheme Transfer Turnover is part of Total ICDM Turnover.
- 4. Macro-Economic Updates - India REAL SECTOR GDP* 30 Gross Domestic Product at current 25.6 prices 25 Agriculture 20 Industries 17.2 16.1 13.9 Services 15 Gross Domestic Product at 10 8.7 constant 2004-05 prices 7.8 7.5 6.1 Agriculture * % Change figures in GDP is for the duration 5 Jan/11-Mar/11, over the previous corresponding period. Industries 0 Source: Ministry of Finance. Department of Economic Affairs IIP* 6 4.2 Capital 15 4 Goods General Use Base 10.3 1.9 classification Intermediate 10 Mining 2 Goods 5 3.6 3.2 Manufacturing 0 Consumer 1.2 Goods Electricity -0.6 0 -2 * % Change figures in IIP is for the duration May-11, over the previous corresponding period. Source: Ministry of Finance. Department of Economic Affairs CPI* 10 CPI -Industrial Workers 9.63 9.44 9.44 (CPI [IW]) 9.5 CPI-Rural Labourers (CPI [RL]) 9 8.72 CPI-Urban Non-Manual Employees (CPI [UNME]) 8.5 * % Change figures in CPI is for the duration Wholesale Price Index May-11, over the previous corresponding 8 (WPI) period; except for CPI(UNMEI) for which it is Source: Ministry of Finance. Department of Economic Affairs Dec-10. Interest Rates Rate Basis points Bank Rate percent per annum Jul/1/2011 6 0 Prime Lending Rates percent per annum Jul/1/2011 9.25-10.00 Treasury Bill Rates percent per annum Jul/6/2011 8.19 282 Source: Ministry of Finance. Department of Economic Affairs
- 5. Contact Details Research Analyst : Rajat Dhar Rajat Dhar B1/15, Agresen Appartments, E-mail ID : rajat.dhar1@yahoo.com Plot 10, Sector 7, Dwarka, New Delhi, India. – Mobile : + (91) – 9999.760.359 1100 75 www.finexpertise.blogspot.com + (91) – 11 – 250.71.724 Disclaimer This document does not constitute an offer or solicitation for the purchase or sale of any financial instrument or as an official confirmation of any transaction. The information contained herein is from publicly available data or other sources believed to be reliable, but we do not represent that it is accurate or complete and it should not be relied on as such. Research Analyst shall not be in any way responsible for any loss or damage that may arise to any person from any inadvertent error in the information contained in this report. This document is provided for assistance only and is not intended to be and must not alone be taken as the basis for an investment decision. The views expressed may not be suitable for all investors. This information is strictly confidential and is being furnished to you solely for your information. This information should not be reproduced or redistributed or passed on directly or indirectly in any form to any other person or published, copied, in whole or in part, for any purpose. This report is not directed or intended for distribution to, or use by, any person or entity who is a citizen or resident of or located in any locality, state, country or other jurisdiction, where such distribution, publication, availability or use would be contrary to law, regulation or which would subject Research Analyst to any registration or licensing requirements within such jurisdiction. The distribution of this document in certain jurisdictions may be restricted by law, and persons in whose possession this document comes, should inform themselves about and observe, any such restrictions. The information given in this document is as of the date as mentioned in the report and there can be no assurance that future results or events will be consistent with this information. This information is subject to change without any prior notice. Research Analyst reserves the right to make modifications and alterations to this statement as may be required from time to time. However, the Research Analyst is under no obligation to update or keep the information current. Nevertheless, the Research Analyst is committed to providing independent and transparent recommendation to its client and would be happy to provide any information in response to specific client queries. The Research Analyst shall not be liable for any damages whether direct, indirect, special or consequential including lost revenue or lost profits that may arise from or in connection with the use of the information. Past performance is not necessarily a guide to future performance. The analyst for this report certifies that all of the views expressed in this report accurately reflect his or her personal views about the market, subject company or companies and its or their securities. Copyright (c) 2011 Rajat Dhar