

Recommended
Recommended
More Related Content
Similar to Writting ielts Task 1
Similar to Writting ielts Task 1 (20)
Recently uploaded
Recently uploaded (20)
Writting ielts Task 1
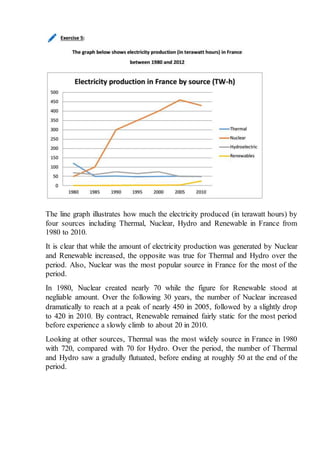
- 1. The line graph illustrates how much the electricity produced (in terawatt hours) by four sources including Thermal, Nuclear, Hydro and Renewable in France from 1980 to 2010. It is clear that while the amount of electricity production was generated by Nuclear and Renewable increased, the opposite was true for Thermal and Hydro over the period. Also, Nuclear was the most popular source in France for the most of the period. In 1980, Nuclear created nearly 70 while the figure for Renewable stood at negliable amount. Over the following 30 years, the number of Nuclear increased dramatically to reach at a peak of nearly 450 in 2005, followed by a slightly drop to 420 in 2010. By contract, Renewable remained fairly static for the most period before experience a slowly climb to about 20 in 2010. Looking at other sources, Thermal was the most widely source in France in 1980 with 720, compared with 70 for Hydro. Over the period, the number of Thermal and Hydro saw a gradully flutuated, before ending at roughly 50 at the end of the period.
- 2. The line graph illustrates how much money (in bilions of dollars) the United States government spent on four researchs including Heath, Space, Energy and Other from 1980 to 2008. It is clear that the yearly spending on Heath increased dramatically while the figure for Space, Energy and Other experienced a gradual growth over the priod 28 years. In addition, the expenditure for Heath was the heighest, the opposite was true for Energy spending. In 1980, there was nearly £8 spent on Heath by US government compared to 4 times as much as that of Energy. Over the next 24 years, the cost for Heath saw a dramatic growth to reach a peak of over £20 in 2004 before falling slightly to under 20 in 2008. By contract, the figure for Energy remained unchange during the first 12 years, before experience a slowly climd 16 years later. Looking at the other researchs, starting at £8 in 1980, the expenditure for Space and Other had a similar trend in first 8 years before spending on the same money in 1996 and 2000 with £5 and £7 respectively. Since then, there was a gradual growth in both Space and Other bofore ending at roughly nearly £10 and £5 for each reseach.
- 3. Exercise 3 (p77 – Bar chart) The bar chart illustrates the percentage of male and female playing sports in the United Kingdom in the year 2008. It is clear that the number of female plaing Netball was the highest while the proportion of male was highest in soccer. In addition, the biggest different was in the rate of male and female playing in Netball. As can be seen from the chart, the amount of male taking part in soccer was 25% while the figure for female stood at only 5%. Similarly, male accounted for over 20% in playing soccer compared to only 10% of female. The percentage of male choosing cricket, which stood at 10%, was nearly 5 times as much as that of female. There was 8% male player in table tennis while their counterparts made up about 2%. Looking at the chart in more details, at 25%, the figure for male players in Netbal compared to only 2% of male. Similarly, the amount of female playing swimming as their sport (about 23%) was also higher than that of male ones (about 14%). Tenis and baketball was quiet similar in the rate of player in both female and male, stood at 6 – 7%. Moreover, jogging was the lowest popular sport of both female and male which was approximate 3% in players. Exercise 1 (p101 – Pie Chart) The pie charts compare the proportion of tourists to America from different countries between 1980 and1992. It is clear that the proportion of visistors coming from Canada decreased gradually while the firgue for China saw a significant increase. Also, the percentage of tourists who came from Canada was the heighest number of visistors in both years. In 1988, approximately a half of tourists came from Canada, which stood at exactly a quarter, was Mexicans. The figure for China and other countries were the lowest level at 10% and 12% respectively. The percentage of visistors from China increase dramatically by 18% while the opposite was true for the remains with the most decrease by 10% in Canadians. In 1990, the rate of tourists from Candana still went down sharply to 4% while the same was true for other contries. Whereas, the figure for China saw a dramatic growth to reach a peak at 30% compared to the number of Mexico standing at a quarter in the last year.
- 4. Exercise 3 (P112 – Pie Chart) The pie charts illustrate the proportion of female and male in different works in the United Kingdom in the year 1992. Overall, it is clear that the percentage of woman in non-manual was heigher than that in men, while the figure for men was more popular in manual. Nearly a quarter of male choosing Craft of similar compared to only 3% of female in that. Gerneral labores were the lowest jobs, which accounted for men and women, stood at 2% and 1% respectively. Stading at over a quarter, Other manual was similar in both sexes. Looking at the chart in more detail, at 31%, the figure for female in Clerical or related was nearly 5 times as much as that of their counterparts. There was a large number in Managerial and professional for both sexes. There was 6% male working in other non-manual while the figure for female was slightly larger at 9%. Exercise 3 (P132 – Table chart) The table chart illustrates the percentage of people expending on four different categories in 4 countries including China, Thailand, Japan and Vietnam in the year 2008. Overall, while Fast food and Drinks were the most popular in both four coutries, the opposite was true for Leisure activities and Education. Also, the heighest speding on different items belonged to China. The percentage of spending on Fast food and Drinks in China, which stood at 29%, was significant heigher than that in other countries. At nearly 20%, the figure for spending on items was the same level in Japan, Thailand and Vietnam. Also, the rate of expending in Vietnam was the lowest at about 15,77%. Compare to Fast food and Drinks, spending on Shoes and Watch were steady poorer in both four countries. In additon, China was the heighest in spending on this item at 16,23%, while the figure for other countries were the similar rate, at 6%. In leisure acctivities and Education item, the percentage of Vietnam was the heighest at 4,35%, while the opposite was true for Japan at only 1,98%.