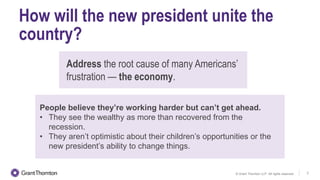
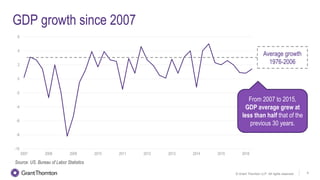
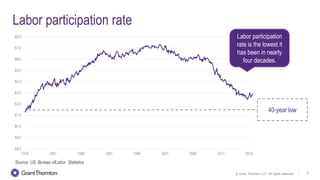
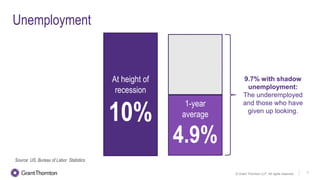
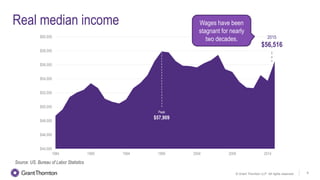
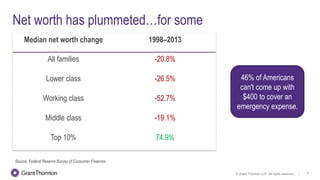
Challenges facing anew
administration
How will the new president unite the
country?
2© Grant Thornton LLP. All rights reserved.
Address the root cause of manyAmericans’
frustration — the economy.
People believe they’re working harder but can’t get ahead.
• They see the wealthy as more than recovered from the
recession.
• They aren’t optimistic about their children’s opportunities or the
new president’s ability to change things.
An election for the ages
Two of the most unpopular candidates in history
Favorable: 43.1%
Unfavorable: 53.0%
Favorable: 35.4%
Unfavorable: 61.7%
RealClearPolitics Average 9/28–10/20
Hillary
Clinton
3© Grant Thornton LLP. All rights reserved.
Donald
Trump
See where Clinton & Trump
stand on tax
Direction of the country
Source: RealClearPolitics average 9/15 – 10/8
Right Direction – 30.2%
Wrong Track – 63.4%
2/
We asked…What do you
want from Congress?
Check out our leaders'
responses.
4© Grant Thornton LLP. All rights reserved.
GDP growth since 2007
-8
-10
-6
-4
0
-2
2
4
6
2007 2008 2009 2010 2011 2012 2013 2014 2015 2016
Average growth
1976-2006
From 2007 to 2015,
GDP average grewat
less than half that ofthe
previous 30 years.
Source: US. Bureau of Labor Statistics
5© Grant Thornton LLP. All rights reserved.
Labor participation rate
60.0
59.0
58.0
61.0
66.0
67.0
68.0
1976 1981 1986 1991 1996 2001 2006 2011 2016
65.0
64.0
63.0
62.0
40-year low
Labor participation
rate is the lowest it
has been in nearly
four decades.
Source: US. Bureau of Labor Statistics
6© Grant Thornton LLP. All rights reserved.
Unemployment
Source: US. Bureau of Labor Statistics
At height of
recession
10%
1-year
average
4.9%
9.7% with shadow
unemployment:
The underemployed
and those who have
given up looking.
7© Grant Thornton LLP. All rights reserved.
Real median income
Source: US. Bureau of Labor Statistics
$44,000
$46,000
$48,000
$50,000
$52,000
$54,000
$56,000
$58,000
$60,000
1984 1989 1994 1999 2004 2009 2014
Peak
$57,909
2015
$56,516
Wages have been
stagnant for nearly
two decades.
8© Grant Thornton LLP. All rights reserved.
Net worth has plummeted…for some
Median net worth change 1998–2013
All families -20.8%
Lower class -26.5%
Working class -52.7%
Middle class -19.1%
Top 10% 74.9%
46% of Americans
can't come up with
$400 to cover an
emergency expense.
9© Grant Thornton LLP. All rights reserved.
Source: Federal Reserve Survey of Consumer Finances
Addressing the economy would
be a logical first step for the
next president.
© Grant Thornton LLP. All rights reserved. 11
Think tanks score Trump and Clinton tax plans for
dynamic effect
Stay politically connected — in spite of populism
Industry: All we want from Congress
The Political Pulse informs you about the race to the presidency.
Find continuous political analysis, news and commentary on the PoliticalPulse.
Post-election economic analysis webcast
© Grant Thornton LLP. All rights reserved. 11
We want to hear from you.
Tell us what you think of this content.
Take this short survey.

Challenges facing a new administration

  • 1.
  • 2.
    How will thenew president unite the country? 2© Grant Thornton LLP. All rights reserved. Address the root cause of manyAmericans’ frustration — the economy. People believe they’re working harder but can’t get ahead. • They see the wealthy as more than recovered from the recession. • They aren’t optimistic about their children’s opportunities or the new president’s ability to change things.
  • 3.
    An election forthe ages Two of the most unpopular candidates in history Favorable: 43.1% Unfavorable: 53.0% Favorable: 35.4% Unfavorable: 61.7% RealClearPolitics Average 9/28–10/20 Hillary Clinton 3© Grant Thornton LLP. All rights reserved. Donald Trump See where Clinton & Trump stand on tax
  • 4.
    Direction of thecountry Source: RealClearPolitics average 9/15 – 10/8 Right Direction – 30.2% Wrong Track – 63.4% 2/ We asked…What do you want from Congress? Check out our leaders' responses. 4© Grant Thornton LLP. All rights reserved.
  • 5.
    GDP growth since2007 -8 -10 -6 -4 0 -2 2 4 6 2007 2008 2009 2010 2011 2012 2013 2014 2015 2016 Average growth 1976-2006 From 2007 to 2015, GDP average grewat less than half that ofthe previous 30 years. Source: US. Bureau of Labor Statistics 5© Grant Thornton LLP. All rights reserved.
  • 6.
    Labor participation rate 60.0 59.0 58.0 61.0 66.0 67.0 68.0 19761981 1986 1991 1996 2001 2006 2011 2016 65.0 64.0 63.0 62.0 40-year low Labor participation rate is the lowest it has been in nearly four decades. Source: US. Bureau of Labor Statistics 6© Grant Thornton LLP. All rights reserved.
  • 7.
    Unemployment Source: US. Bureauof Labor Statistics At height of recession 10% 1-year average 4.9% 9.7% with shadow unemployment: The underemployed and those who have given up looking. 7© Grant Thornton LLP. All rights reserved.
  • 8.
    Real median income Source:US. Bureau of Labor Statistics $44,000 $46,000 $48,000 $50,000 $52,000 $54,000 $56,000 $58,000 $60,000 1984 1989 1994 1999 2004 2009 2014 Peak $57,909 2015 $56,516 Wages have been stagnant for nearly two decades. 8© Grant Thornton LLP. All rights reserved.
  • 9.
    Net worth hasplummeted…for some Median net worth change 1998–2013 All families -20.8% Lower class -26.5% Working class -52.7% Middle class -19.1% Top 10% 74.9% 46% of Americans can't come up with $400 to cover an emergency expense. 9© Grant Thornton LLP. All rights reserved. Source: Federal Reserve Survey of Consumer Finances
  • 10.
    Addressing the economywould be a logical first step for the next president.
  • 11.
    © Grant ThorntonLLP. All rights reserved. 11 Think tanks score Trump and Clinton tax plans for dynamic effect Stay politically connected — in spite of populism Industry: All we want from Congress The Political Pulse informs you about the race to the presidency. Find continuous political analysis, news and commentary on the PoliticalPulse. Post-election economic analysis webcast
  • 12.
    © Grant ThorntonLLP. All rights reserved. 11 We want to hear from you. Tell us what you think of this content. Take this short survey.