Download to read offline
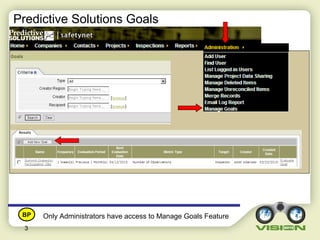
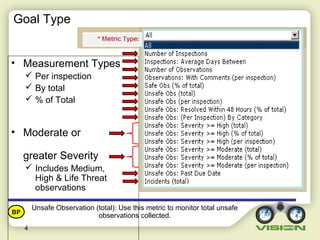
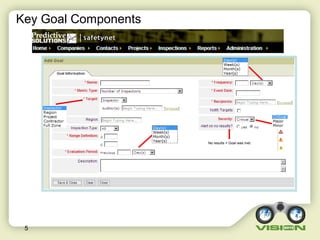
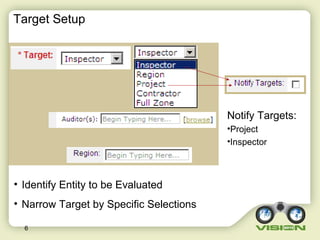
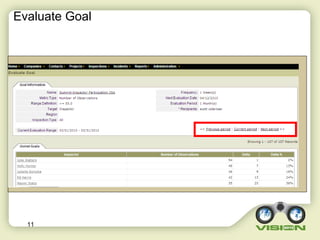
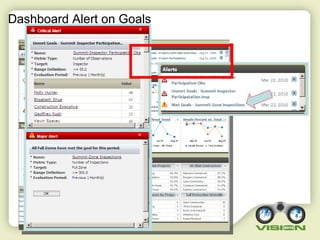
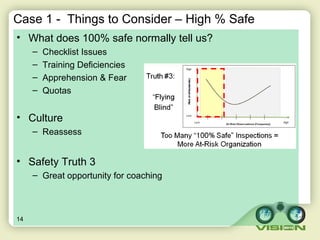
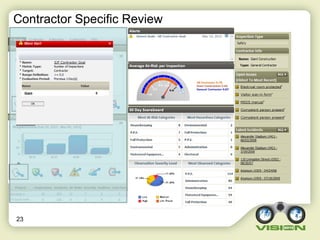

The document outlines a process for managing goals within a dashboard system, aiming to enhance safety observations and measure performance. It includes procedures for accessing the goal module, defining goal types, and setting up communication and alerts, with various case examples illustrating challenges and strategies. Key components emphasized are goal evaluation, participation engagement, and addressing cultural issues to improve safety outcomes.