Download as PDF, PPTX

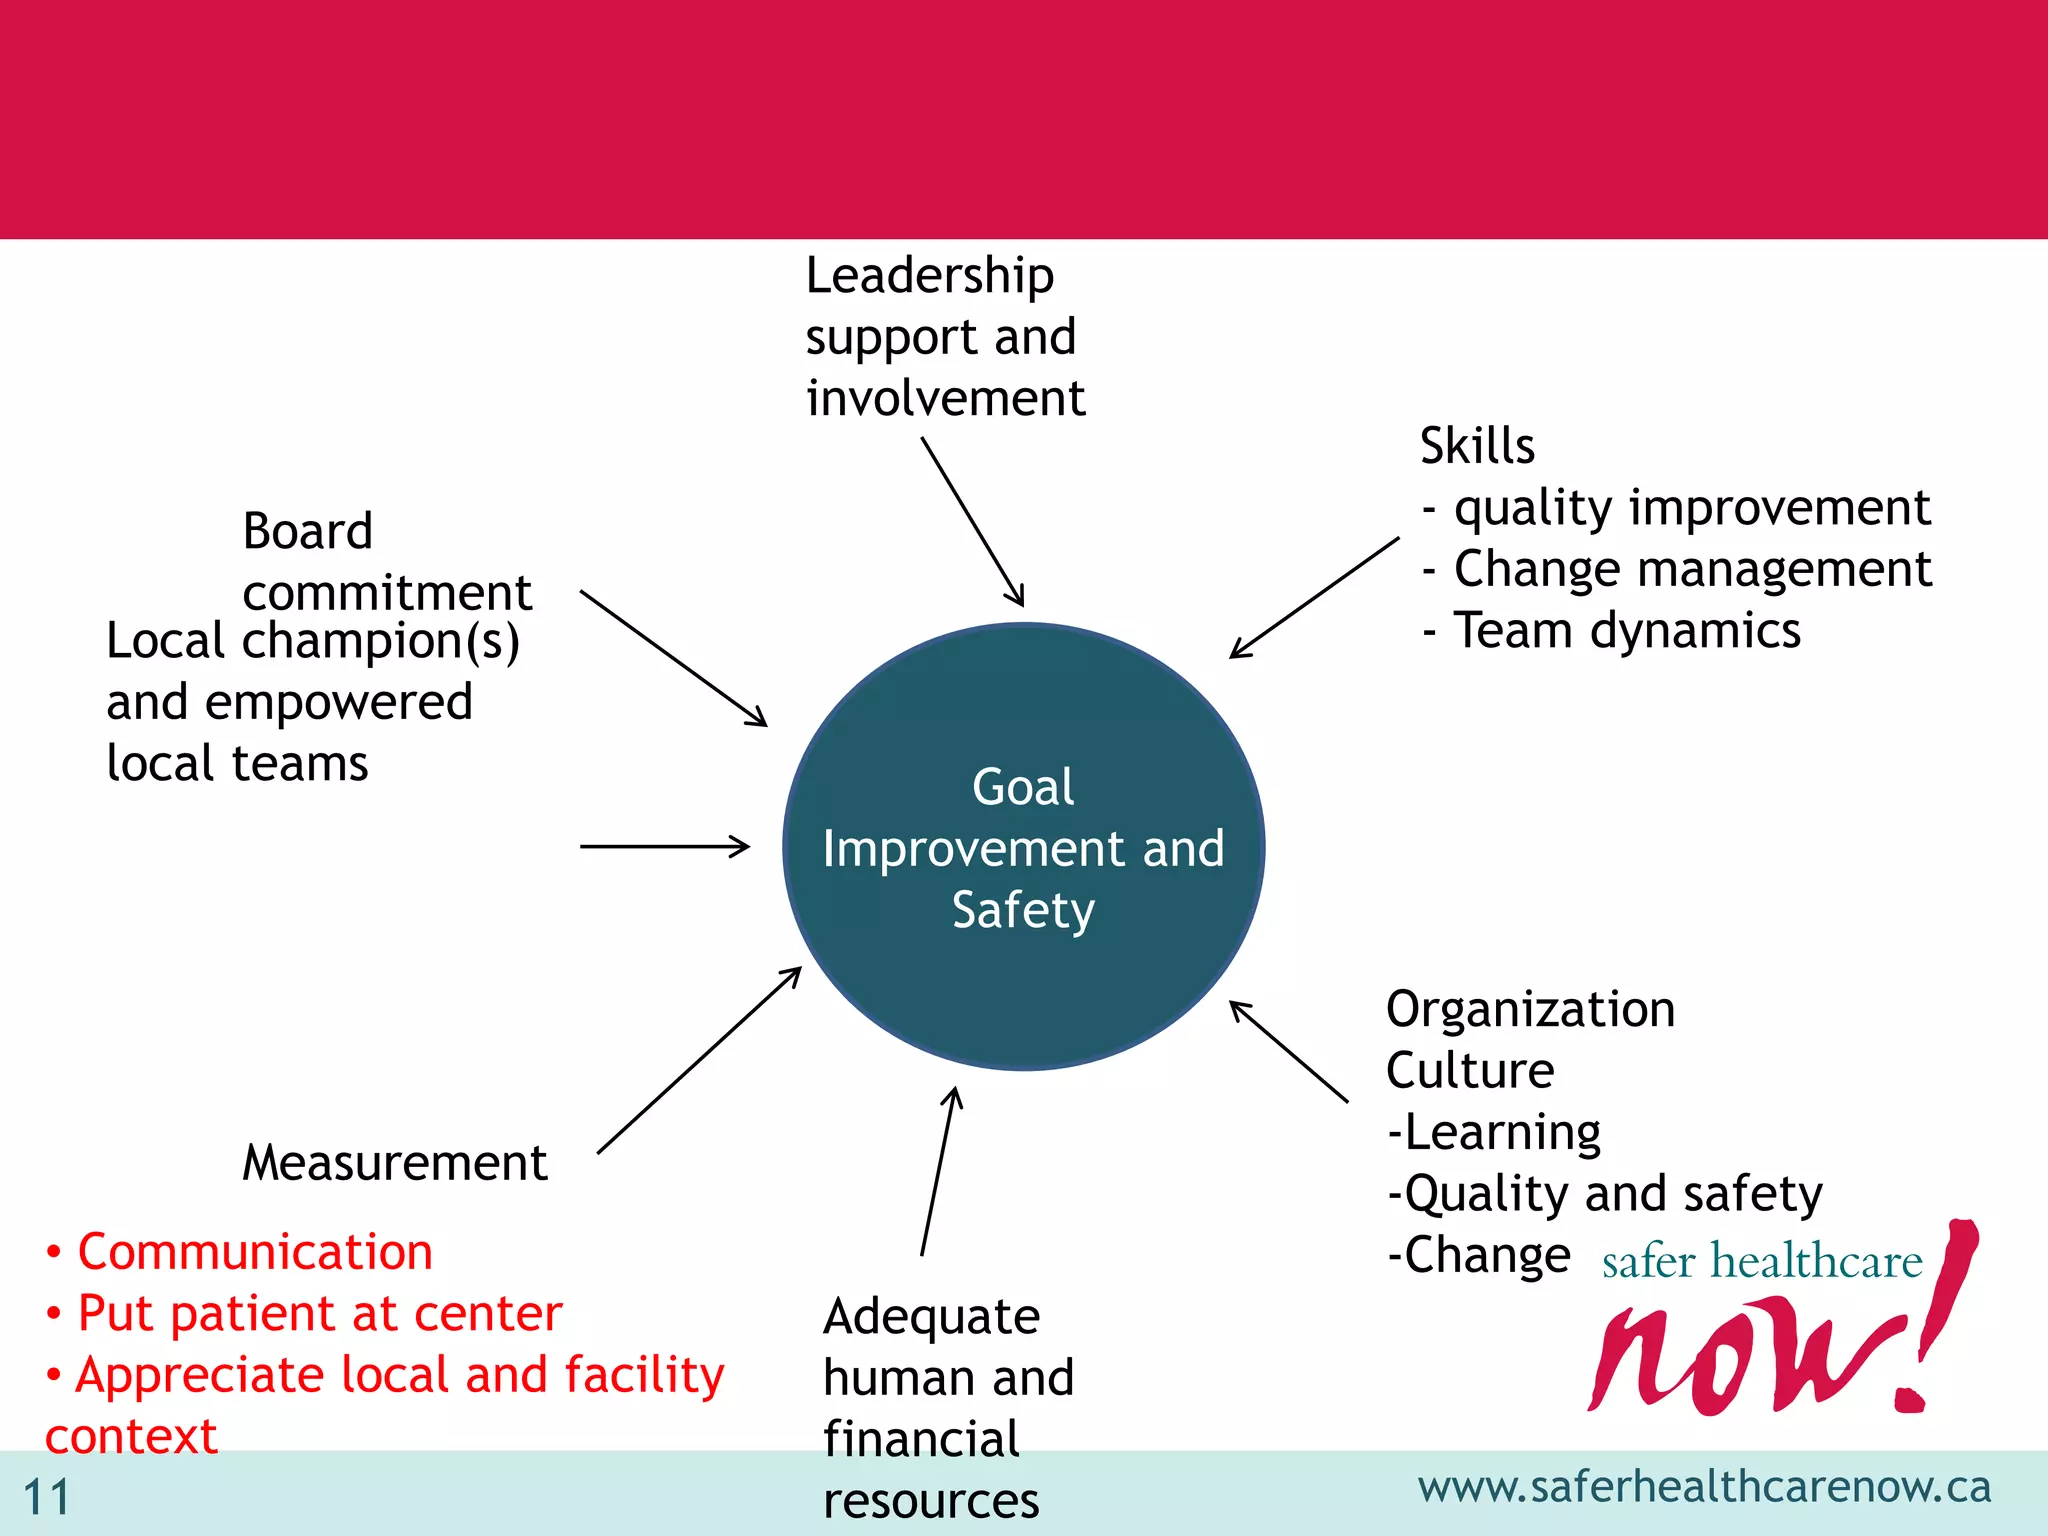

![“It is not acceptable for …[healthcare
facilities] to make blanket statements
about providing high-quality care
without backing it up with proof.”
Dr. Jack Kitts, President & CEO The Ottawa Hospital
Metrics for Healthcare: The Leader’s Role.
CMAJ, Feb.2010
www.saferhealthcarenow.ca](https://image.slidesharecdn.com/nationalmeasurementcallslides2013-03-13-130319123632-phpapp02/75/Using-measurement-to-drive-improvement-New-tools-to-help-you-succeed-25-2048.jpg)
![Potential applications of the system
PS Metrics can be used to support:
• Small and Large Scale Improvement Initiatives
– Roll Up or Drill Down Reports [e.g. Unit Site
Program Corporation Region Province Node
National]
– Produce automated run charts
• Reporting for accountability
– Possible to customize indicators to meet provincial,
regional and local reporting needs
www.saferhealthcarenow.ca](https://image.slidesharecdn.com/nationalmeasurementcallslides2013-03-13-130319123632-phpapp02/75/Using-measurement-to-drive-improvement-New-tools-to-help-you-succeed-34-2048.jpg)


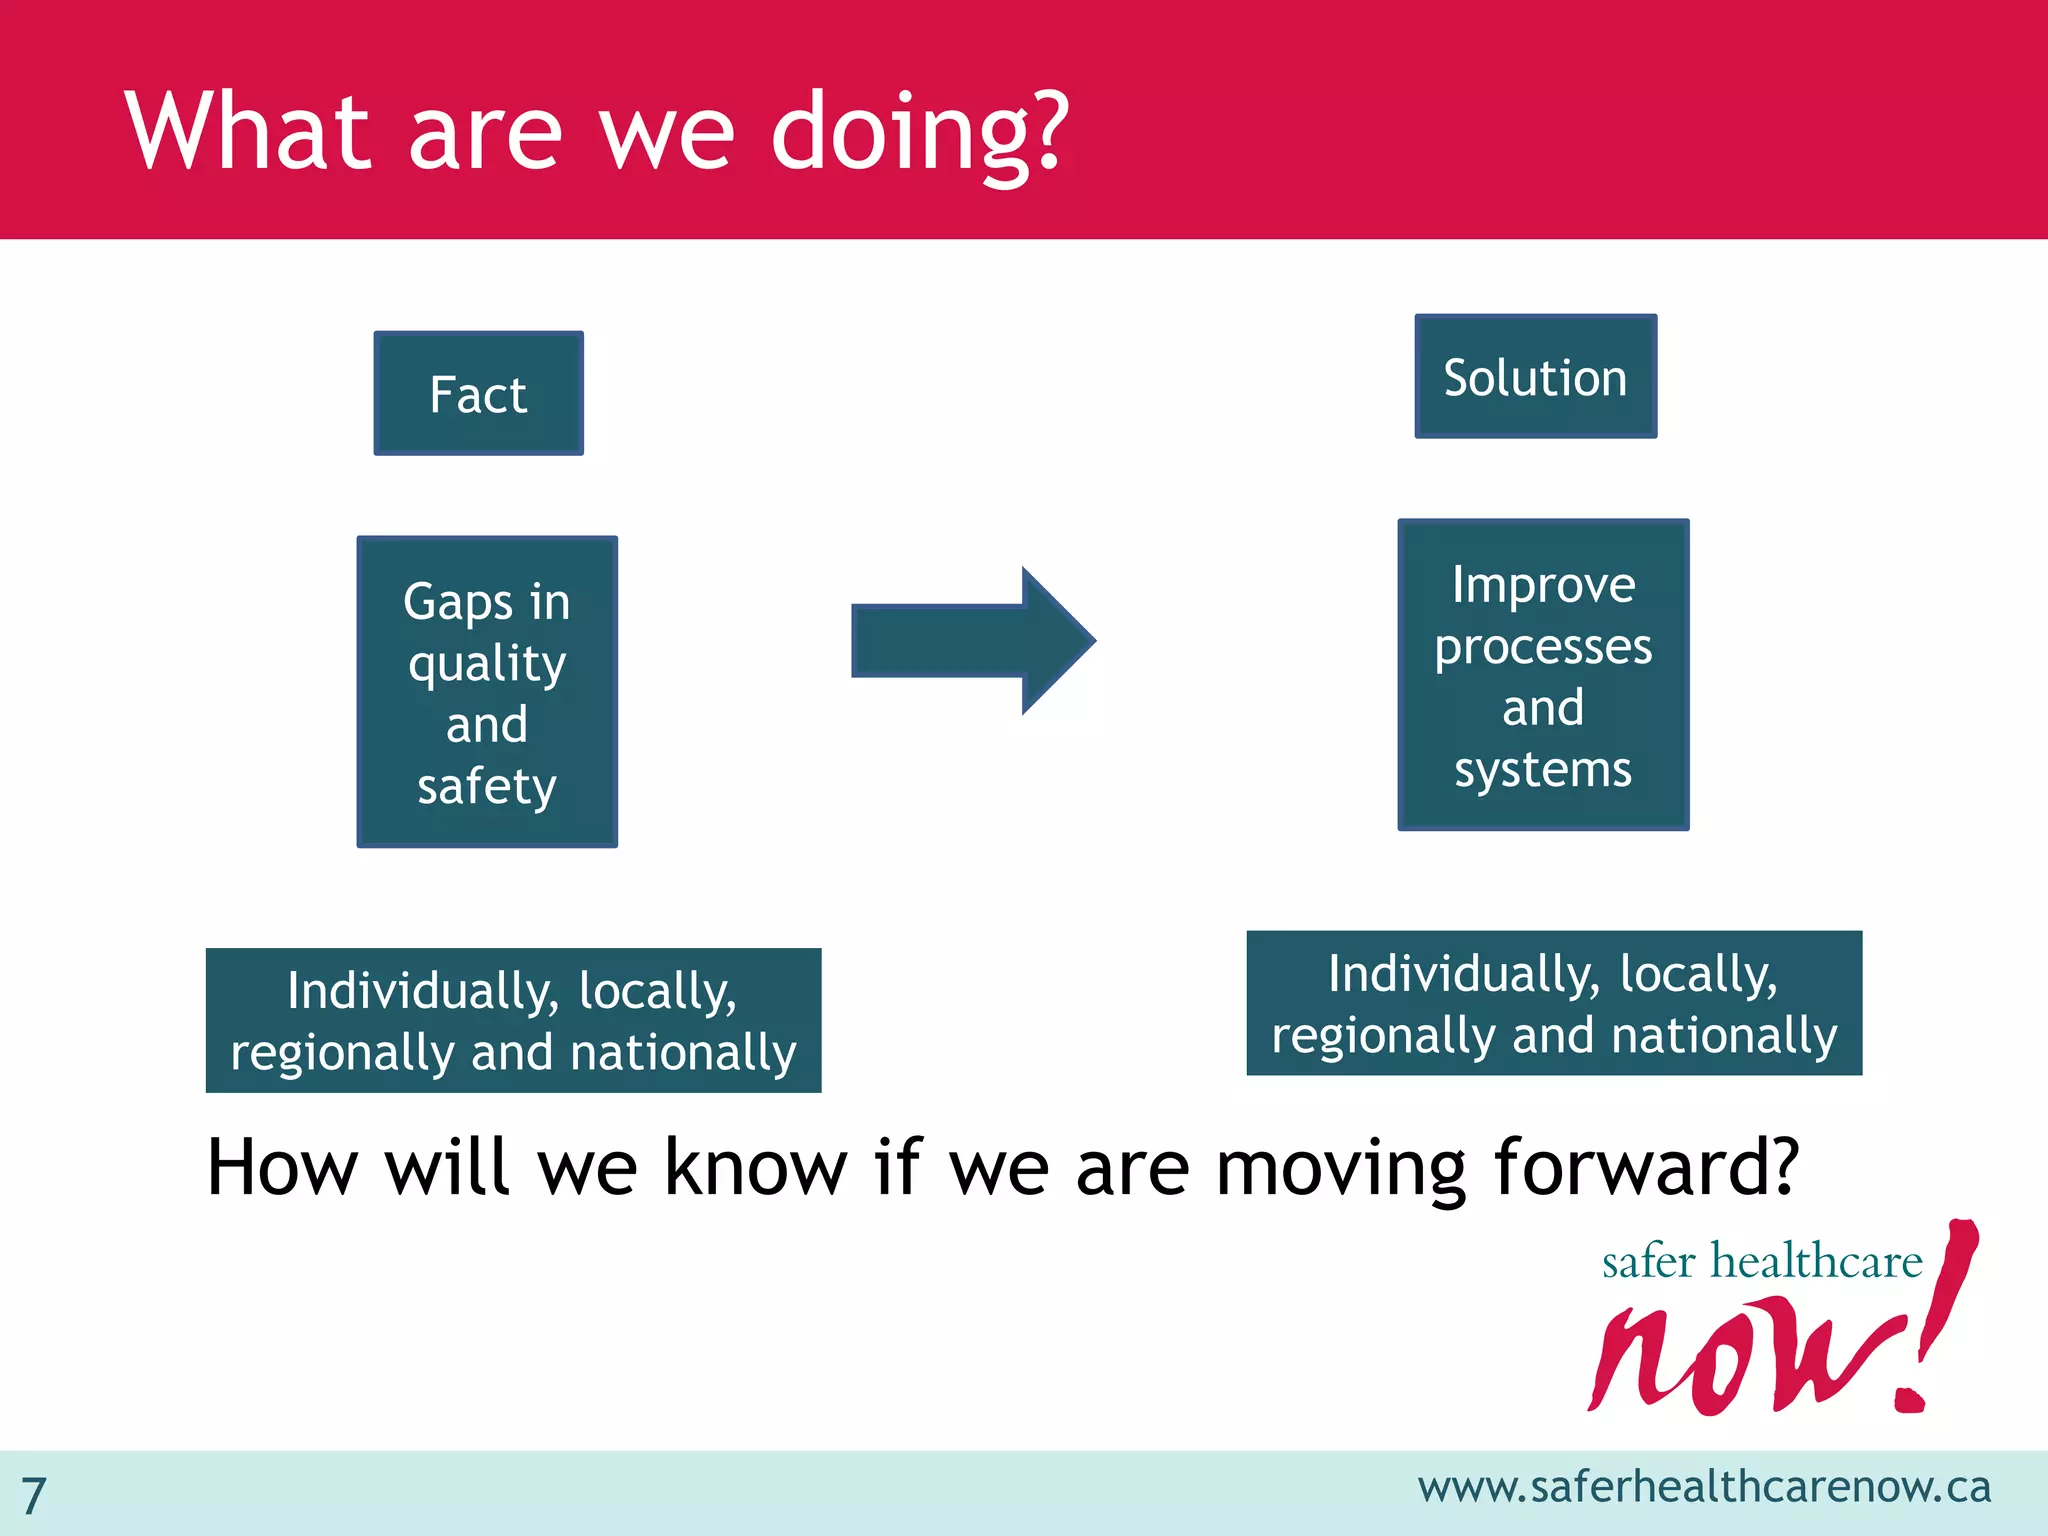
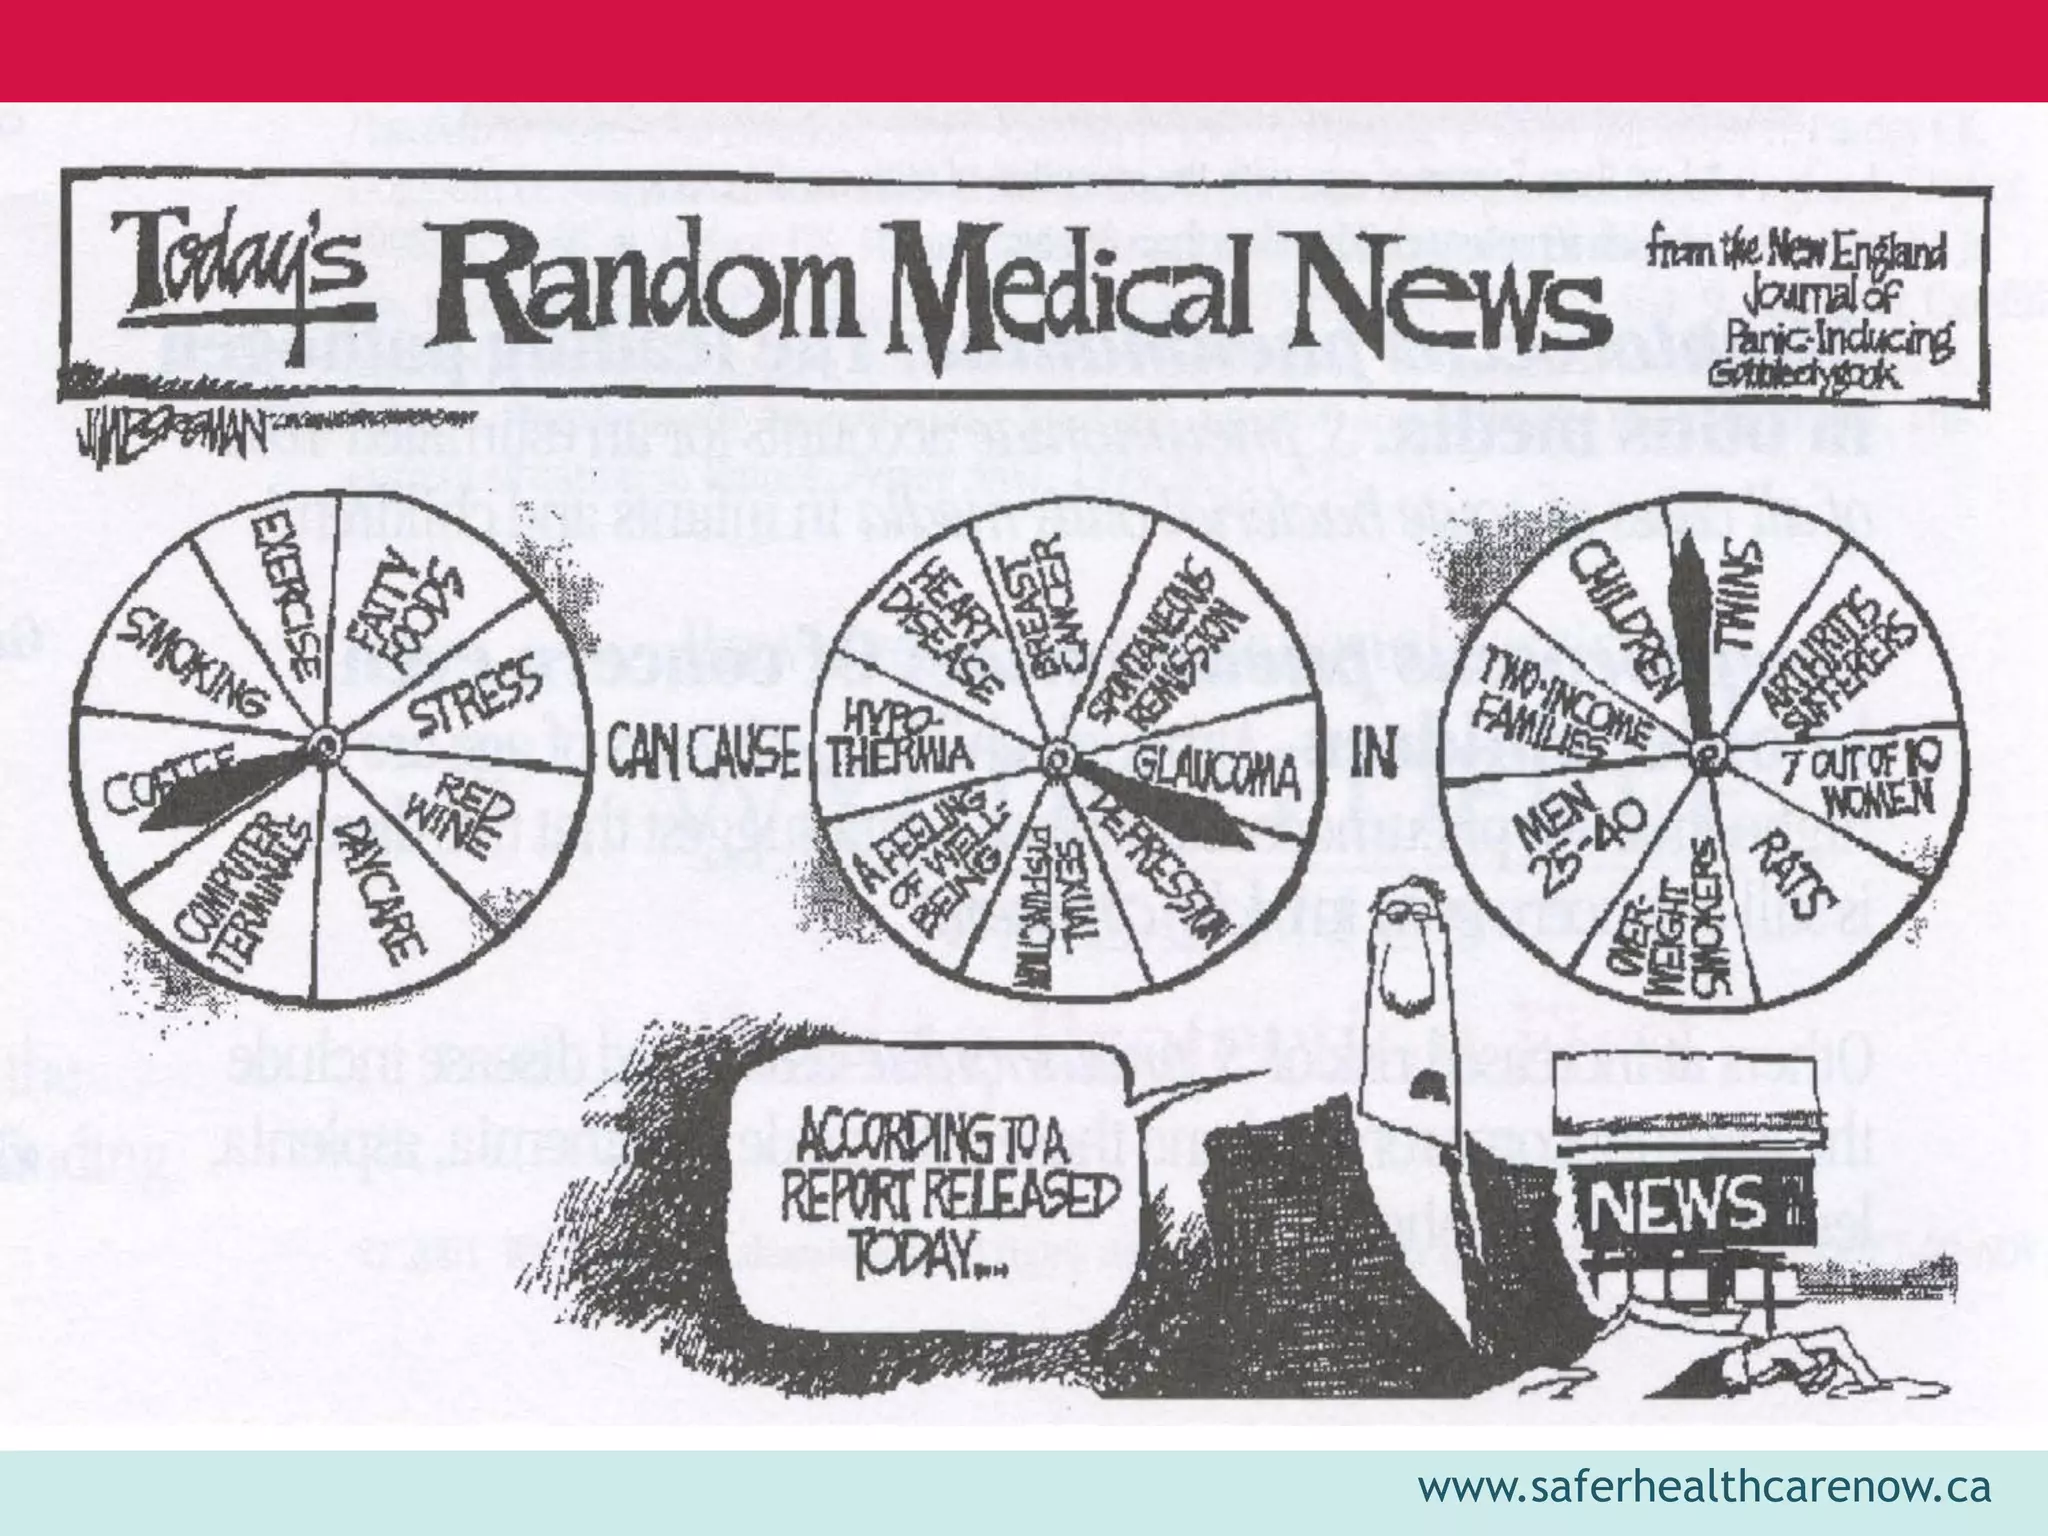
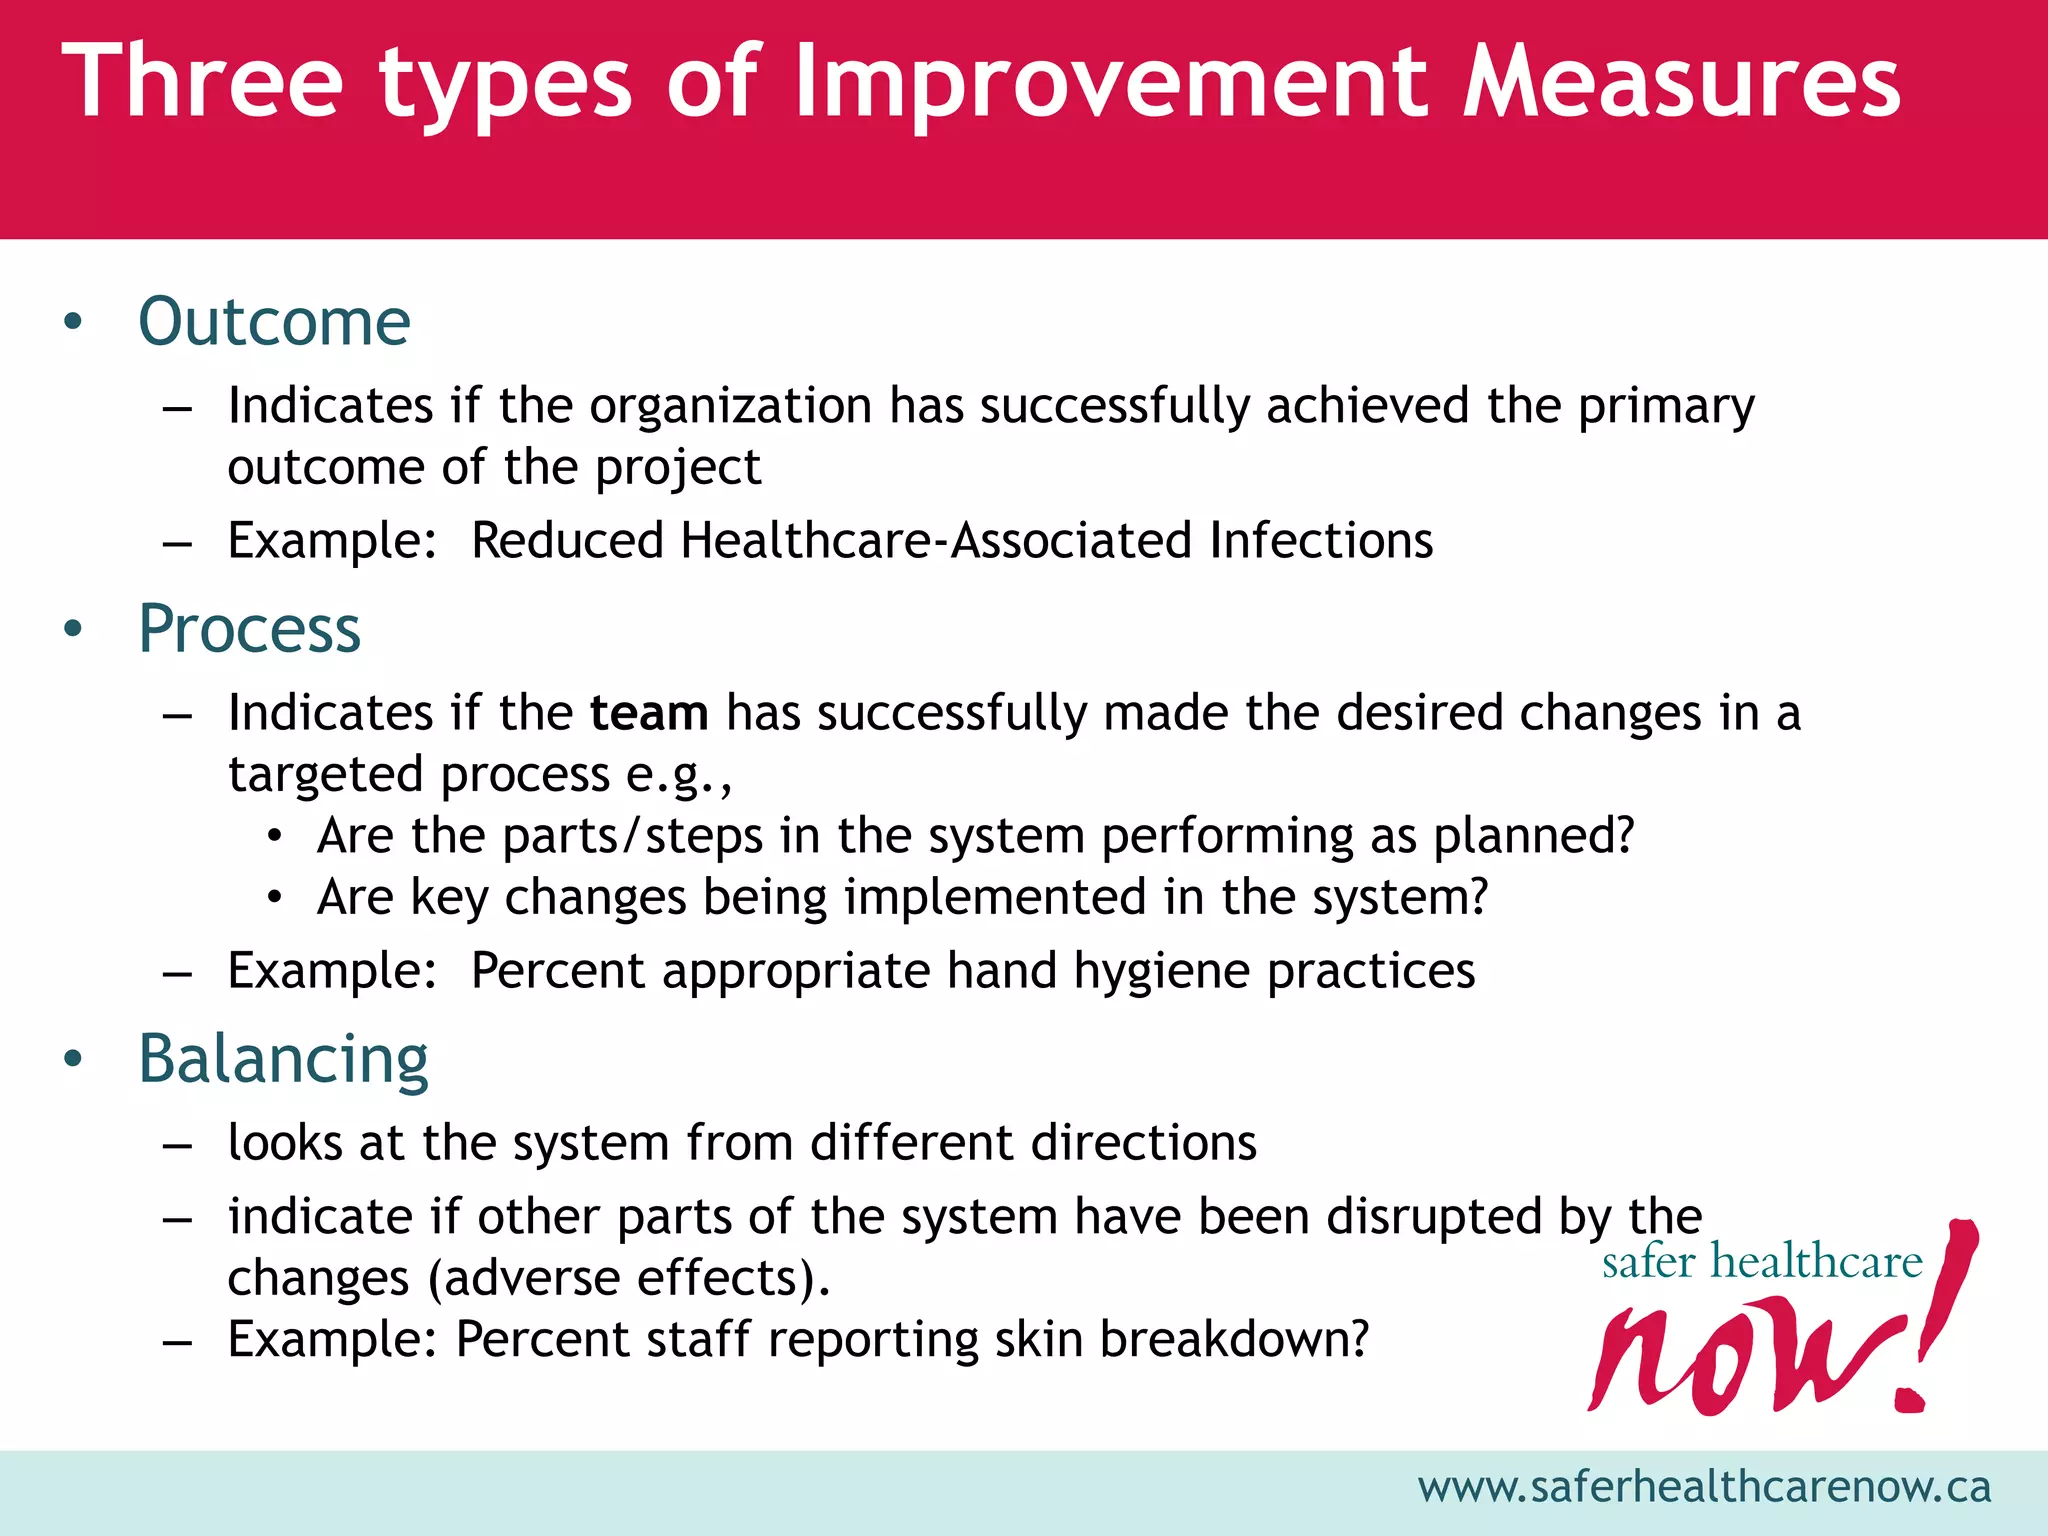
The document discusses the significance of measurement in improving healthcare quality and safety, highlighting patient safety metrics and new data collection tools. It emphasizes that measurement is essential for learning and improvement rather than judgment, and introduces a cloud-based tool designed for ease of data collection and reporting. The document also outlines various types of measurement, including outcome, process, and balancing measures, while stressing the importance of accurate data to drive effective healthcare changes.


![Apporach to lung biopsy [Auto-saved].pptx latest](https://cdn.slidesharecdn.com/ss_thumbnails/apporachtolungbiopsyauto-saved-251211225655-93258539-thumbnail.jpg?width=640&height=640&fit=bounds)


