
Recommended
More Related Content
What's hot
What's hot (20)
Viewers also liked
Viewers also liked (20)
Similar to Determination of Average HIV Replication in the Blood Plasma Using Truncated Logistic Distribution
Similar to Determination of Average HIV Replication in the Blood Plasma Using Truncated Logistic Distribution (20)
Recently uploaded
Recently uploaded (20)
Determination of Average HIV Replication in the Blood Plasma Using Truncated Logistic Distribution
- 1. ISSN 2350-1049 International Journal of Recent Research in Interdisciplinary Sciences (IJRRIS) Vol. 2, Issue 4, pp: (48-58), Month: October - December 2015, Available at: www.paperpublications.org Page | 48 Paper Publications Determination of Average HIV Replication in the Blood Plasma Using Truncated Logistic Distribution 1 G. Meenakshi, 2 Habineza Alexis, 3 R. Lakshmajayam 1,2,3 Department of Statistics, Annamalai University, Annamalai Nagar - 608002, Tamil Nadu, India Abstract: Many statistical and computational models have been developed to investigate the complexity of HIV dynamics in the immune response. Most of the models described the viral replication as a system of differential equation, where the solution of parameters is not easy to obtain. A model of HIV replication where infected cells undergo through a truncated logistic distribution is proposed. An infected cell is modelled as an individual entity with certain states and properties. Three simulation approaches are used for implementing the model, conditional distribution, truncated population mean approaches and sample mean. Simulation results give insights about the details of HIV replication dynamics inside the cell at the protein level. Therefore the model can be used for future studies of HIV intracellular replication. It will also promote better understanding of the HIV/AIDS transmission dynamics, the study will also add to the existing body of knowledge on mathematical application in the field of epidemiology. Keywords: Conditional distribution, HIV Dynamic Immune Power, Logistic Distribution, Truncated Distribution. 1. INTRODUCTION For most people, infection with HIV is the start of a progressive illness that results in death due to the increasing occurrence of opportunistic infections. The ultimate cause is the progressive degradation of the immune system (the body's natural defence system that guards against foreign invaders and that includes lymphocytes and antibodies) by the virus resulting in Acquired Immunodeficiency Syndrome (AIDS) if there is no treatment. HIV damages the immune system by attacking certain white blood cells called lymphocytes (specifically those called helper T cells). Lymphocytes normally help to protect the body against invading micro organisms. When these cells are destroyed, the body loses its ability to fight infection and becomes vulnerable to a variety of infections and rare cancers that are the hallmarks of AIDS. The interaction between HIV and immune system is more complex compared to most other infections. While immune a response has the potential to fight the virus, HIV infects - helper cells (A type of lymphocyte that is involved in the immune response and that is the primary target for the AIDS virus), which is a central component orchestrating (planning) the generation of specific immune response. Depending on co-receptor usage, HIV can infect other immune cells, such as macrophages and dendrite cells that are also involved in the generation of antiviral immunity. Thus the suboptimal immune responses develop early during the cute phase of infection and can contribute to viral persistence and to the ability of the virus to mutate and evolve. The infection remains asymptomatic for years before the virus load sufficiently increases and the population helper cell falls to low level leading to the development of AIDS. Diseases progression is associated with the evolution of specific viral variant that are more virulent and pathogenic. While most viruses are attacked by immune system leaving the body with the lifelong immunity, the
- 2. ISSN 2350-1049 International Journal of Recent Research in Interdisciplinary Sciences (IJRRIS) Vol. 2, Issue 4, pp: (48-58), Month: October - December 2015, Available at: www.paperpublications.org Page | 49 Paper Publications retrovirus known as Lent virus (HIV) is only slowly and partially attacked. It is never wholly eliminated from the body. Lent viruses are known for having long time between initial infection and the beginning of serious symptoms. That is the reason as to why many people who are unaware of their HIV infection can unfortunately spread the virus to others Anderson et.al 1991. HIV is found in the blood, sexual and bodily fluids of an infected person. HIV has a long latency period that is, it takes considerable time before the body’s immune system can no longer generates the immune response required to suppress HIV, leading to an intensified replication of the virus Putzel, 2003. HIV has a physiological impact on the immune system. It targets and infects white blood cells known as - cells which are part of the immune system. - cells are helper cells produced from precursors in bone marrow and thymus. When a person has chronic HIV infection, it causes gradual depletion of the - cell pools. In a normal human being the level of - cells in the peripheral blood is regulated at a level between to when the - cell count falls below , a person becomes vulnerable to opportunistic infections. - cells are a primary indicator used to measure progression of HIV infection in an HIV infected person. It is the loss of - cells that devastate and compromise the host immune system, making the body vulnerable to all sorts of opportunistic infections, leading to full blown Acquired Immunodeficiency Syndrome (The stage of HIV infection in which the immune system is so damaged that it can no longer fight off disease), AIDS which is the last stage of HIV infection Putzel 2003. The opportunistic infections such as pneumonia, meningitis, cancers and tuberculosis (TB) are the cause of illness or death. Since its discovery, in 1981 to date more than 25 million people worldwide have died of AIDS related diseases. The HIV infection is one of the most destructive health crises of modern times, ravaging families and communities throughout the world, particularly in the developing countries. Countries that have been hard hit by the AIDS epidemic have seen mortality surge and life expectancy drop in the last decade Ashford 2006. HIV/AIDS have effects on population size of susceptible population, characteristics, and well-being. Noted so far that current mathematical models in transmission dynamics of HIV do not incorporate the effects of treatment on the aspect of logistic population growth rate of susceptible. Therefore, this study intends to develop an HIV/AIDS statistical model with treatment which leads to logistic population growth of the susceptible. 2. REVIEW OF LITERATURES ABOUT HIV MODELS It has been more than three decades that the Human Immunodeficiency Virus (HIV) has reached a pandemic state. The worldwide emergence of this infectious agent coincided with the advent of new modeling techniques in epidemiology, e.g., the basic reproductive number R.M. Anderson., and R.M may 1979, but also in evolution, e.g., the adaptive dynamics framework (Hofbauer, J; Sigmund, K. 1990). Arguably, this was the first time that so many mathematical approaches have been mobilized to decipher the course of an infection. Although there can be variations from patient to patient, the course of an HIV infection follows a general pattern Levy, J.A.1988. The viral load increases exponentially in the first three to six weeks following infection. The cellular immune response kicks in after one to two weeks followed by the humeral response after four to eight weeks upon infection Richman, D. D. et.al 2003. This early phase of infection is commonly referred to as the primary infection or initial phase and shares many similarities with acute infections. With the onset of a cellular immune response, the viral load decreases and settles to a more or less constant value for several years. This is the second phase, which is known as the chronic (or asymptomatic) phase. Importantly, even though it might appear as if the virus is resting in this phase, there in fact is a rapid turnover of infected cells and it is the cellular and the humeral immune response that keep viral loads to a constant level, which is referred to as the set point viral load Ho. D. David, et.al 1995. Furthermore, during this chronic phase, the virus within-host diversity increases and the number of host - cells decrease because they are the primary target of the virus. The third phase or AIDS phase is characterized by a dramatic loss in -cells and a strong increase of viral load Coombs et.al 1998 showed that viral titers increase in the AIDS phase and O’Brien et.al 1998, Lyle’s et.al 1999, confirmed this trend in longitudinal studies. Clinically, the onset of AIDS is defined as the time point at which the - cell count in the blood falls below 200 per
- 3. ISSN 2350-1049 International Journal of Recent Research in Interdisciplinary Sciences (IJRRIS) Vol. 2, Issue 4, pp: (48-58), Month: October - December 2015, Available at: www.paperpublications.org Page | 50 Paper Publications ml. The AIDS phase also often (but not always) coincides with a shift in the virus population and the emergence of virus strains that are able to use CXCR4 co-receptors (instead of CCR5 co receptors) and thus a wider range of immune cells become susceptible to the virus. Because of the fragility of their immune system (low T-cell counts), patients suffer from a variety of opportunistic infections during the AIDS phase. Furthermore, within-host virus genetic diversity tends to decrease during this phase. 3. TRANSITIONS INTO AND OUT OF SEX WORKER STATE ARE RELEVANT ONLY TO HIGH RISK FEMALES The model specifies that HIV prevalence at time t is a function of the number of new infections that have arisen prior to time t times the probability that individuals infected at past times have survived through time t ( ) ∫ ( ), ( )- … (1) where P (t) is prevalence at calendar time t, I(s) is incidence at calendar time s, and F(t) is the probability of dying within t years of infection. Discussion of one set of models used for the incidence curve I(s) and incubation distribution F(t) and a method for deriving a maximum likelihood estimate and likelihood bounds on the epidemic parameters, possible alternatives are also discussed briefly. A discrete analog to equation (1) has been specified, and parametric forms for I (·) and F (·) have been selected to be consistent with the assumptions used in Epimodel. Specifically, a gamma distribution has been used for incidence and a Weibull distribution for the cumulative progression rate. The gamma distribution used here is described by two parameters, and , and has the following form ( ) ( ) … (2) The Weibull distribution is described by two parameters, k and and has the following form ( ) ( ) … (3) The Weibull distribution has been used frequently to describe the AIDS incubation distribution Brookmeyer et.al 1986, although the strengths and weaknesses of the model, as well as alternative assumptions, have been examined elsewhere Marion, et.al 1993. Based on this formulation of the model, the analytical objective is to find the set of model parameters that are most likely to have produced the observed data on prevalence. Each set of parameter values generates a unique set of incidence, prevalence and mortality curves. A first round of analysis has been undertaken with the assumption that the (Absolute Neutro Count) ANC data are representative of national prevalence levels in the adult population, but the validity of this assumption is considered further below. It would be possible to specify a likelihood function that depends only on the observed data points, and then maximize this function to identify the parameter values with the highest relative likelihood given these observations. There are several reasons, however, why it may be useful or even necessary first to address the problem of missing data values. First, in the simplest models each observation on prevalence in a particular site and particular year is considered to be independent of every other site-year observation, more sophisticated models that capture the relationships between observations within the same site or heterogeneities across the sites would require complete time series for some range of years in every site. Second, given the large number of missing values relative to observed values in many countries in sub-Saharan Africa, it may simply be impossible to compute maximum likelihood parameter estimates based only on the limited number of observations. In these cases, observed values in other sites or in other years for the same sites, as well as other covariates and information gleaned from other countries, could be helpful in predicting a distribution of likely values for the unobserved data points. Third, if the probability that a particular value is missing is correlated with the level of the missing value, this would produce a bias that might be mitigated by filling in the gaps in the data set. Stated in other words, if the observations that are available in a particular year tend to come from sites with systematically higher or lower than average prevalence 6 rates, then the conclusions drawn from the incomplete data set will be biased upwards or downwards accordingly.
- 4. ISSN 2350-1049 International Journal of Recent Research in Interdisciplinary Sciences (IJRRIS) Vol. 2, Issue 4, pp: (48-58), Month: October - December 2015, Available at: www.paperpublications.org Page | 51 Paper Publications The study of viral dynamic models A. S. Perelson, et.al (1993) proposed models of viral spread in the blood stream. The models consist of four components, such as un infected - cells, latently infected - cells, actively infected - cells and free virus. The models are considered as Where T- HIV virions infect target T cells, - productively infected T cells, -infection virions produced before initiation of the drug, -non infected virions, C -decay rate of non-infectious virus, N -productively infected T cell assumed to produce N virions in its life time. The parameters of this model are estimated by non-linear least square regression method. The estimated parameters of this models are biased, because assumption of imperfect drug. The estimated life time productively infected T-cells, and plasma virions are1.6 days and 0.24 days respectively. Louied et.al 2003, proposed the random as well as deterministic model and HIV patient data was illustrated. It is crucial to include target cell dynamics with density dependent growth but that a latent cell component is not needed over this shorter time scale. ( ) ( ) ( ) ( ) ( ) ( ) ( ) ( ) ( ) ( ) 4 ( ) ( ) 5 ( ) ( ) ( ) ( ) Where is the efficacy of the reverse transcriptase (RT) inhibitor mono-therapy N is the average number of virions produced per productively infected T-cells. D.M Bortz and P.W.Nelson 2004 illustrated the wide range of C and small range for undergoing protease inhibitor therapy by sensitivity methodology in which principle component analysis is used. D.M Bortz and P.W.Nelson 2005, create a statistical model, a hierarchical mixed effects modeling approach is employed to characterize the inter- and – intra- individual variability mixed in the patient population. Straight forward characterization, of the inherent within and between patient variability by the mixed effect modeling, for patient, log transform of the dimensional vector of viral load measurements and time point is modeled by ( ) where the vector value function represents the solution to the differential equation evaluated at time points and is a vector random variable observation describing the measurement equation in observing viral roads. -viral clearance rate and - cells, death rates and illustrated sample variances for maximum likelihood best fit values of the parameters C and ). J.Guedj et.al (2007) used the fisher information matrix to check and measure the practical identinfiability of parameters estimated by Maximum Likelihood Estimation and described the following an HIV dynamics model based on five non- linear differentials ( ) ( )
- 5. ISSN 2350-1049 International Journal of Recent Research in Interdisciplinary Sciences (IJRRIS) Vol. 2, Issue 4, pp: (48-58), Month: October - December 2015, Available at: www.paperpublications.org Page | 52 Paper Publications ( ) Where -Quiescent cells. In this model, the activation process is probability one of the major cause of - cell depletion during HIV infection Grossman et.al 2000. In the steady state assumption, the treatment effects are initiated with is introduced Ribero et.al 2002. The availability of assays able to distinguish infected and non -infected cells Perelson et.al (1998) as well as infectious and non-infectious viruses Ruset et.al 2004. May useful to improve the identinfiability of model parameters and thus usefulness of HIV dynamic model to analyze the real data. The estimation of the free virions clearance and the number of virus produced by an infected cell are very difficult by means of rapid dynamics of these components. 4. MODEL FOR HIV REPLICATION USING TRUNCATED LOGISTIC DISTRIBUTION In statistics, a truncated distribution is a conditional distribution that results from restricting the domain of some other probability distribution. Truncated distributions arise in practical statistics in cases where the ability to record, or even to know about, occurrences is limited to values which lie above or below a given threshold or within a specified range. Suppose a random variable X that is distributed according to some probability density function ( ) with cumulative distribution function ( ) both of which have infinite support. The probability density of the random variable after restricting the support to be between two constants so that the support ( - Y is the considered as number of replicated virus in the blood plasma of HIV infected persons. It follows truncated logistic distribution. Once HIV infected the person, it will replicate from the – cells of infected persons. The number of replicated virus is varying person to person after infection. It will be increasing nature. Therefore it is considered as random variable of truncated logistic distribution with range of greater than A truncated distribution as is as (a, b] ( ) ( ) ( ) A truncated distribution as is as following ( ) ( ) ( ) The logistic density function for X where ( ) and is ( ) given ( ) ( ) 2 ( )3 Where √ (is a scale parameter), such that Let the density function for ( ) ( ) 2 ( )3 by definition the truncated density function for y when is given by
- 6. ISSN 2350-1049 International Journal of Recent Research in Interdisciplinary Sciences (IJRRIS) Vol. 2, Issue 4, pp: (48-58), Month: October - December 2015, Available at: www.paperpublications.org Page | 53 Paper Publications ( ) ( ) ( ) , for The cumulative distribution function is given by ( ) ( ) It follows that ( ) ( ) ( ) ( ) And the conditional logistic density function is given ( ) ∫ ( ) 2 ( )3 ... (1) where and It follows that ( ) ∫ ( ) Since ∫ ( ) ∫ Finally ( ) ( ) ( )2 ( )3 ... (2) 5. TRUNCATED MEAN Suppose the expected value of a random variable distributed according to the density ( ) and a cumulative distribution of ( ) given that the random variable X, is greater than some known value y. The expectation of a truncated random variable is thus ( ) ∫ ( ) ( ) Since ( ) ( ) for all and ( ) elsewhere The derivative of ( ) proceeds as follows ( ) ∫ ( ) ( ) ( ) ∫ ( ) 2 ( )3 Since then, ( ) ∫ ( ) * + ( ) ∫ * + ( ) ∫ * +
- 7. ISSN 2350-1049 International Journal of Recent Research in Interdisciplinary Sciences (IJRRIS) Vol. 2, Issue 4, pp: (48-58), Month: October - December 2015, Available at: www.paperpublications.org Page | 54 Paper Publications ( ) ∫ * + ( ) ∫ * + ∫ * + ∫ * + ( ) ( ) ( ) Consider and go through integration by part ∫ * + where and * + , * + ∫ * + ∫ * + * + * + where * + ∫ * + , ∫ * + ∫ ( ) since ∫ ( ) ∫ ∫ ∫ ∫ ( ) ∫ * + ( ) ( ) Where * + ( ) ( ) 0 ( ) 1 ( ) 0 1 ( ) ( ) ( | |) ( ) ( ) ( ) . . // ( ) ( ) ( ) Since, ( ) Let y be a random variable as number of HIV replication per period (in 1 to 10 years) of infected persons. Testing our truncated ( ) whether it is unbiased or not by using the various sample sizes (viral load per period).The sample mean and sample size are fitted in the ( ), this prove that sample mean is unbiased estimate of population mean when the distribution is truncated as it is shown below. Using this truncated distribution to find the posterior distribution and posterior mean. The following observations are considered as HIV replications per period of various infected persons
- 8. ISSN 2350-1049 International Journal of Recent Research in Interdisciplinary Sciences (IJRRIS) Vol. 2, Issue 4, pp: (48-58), Month: October - December 2015, Available at: www.paperpublications.org Page | 55 Paper Publications Table.1 Sample Size Viral load per ml period 25 30 32 50 42 20 28 33 47 50 57 41 60 61 64 15 57 50 67 53 49 54 59 55 32 29 35 38 47 37 40 55 63 37 25 90 55 61 47 46 33 30 22 65 70 22 31 45 76 80 16 79 86 18 34 22 13 33 29 46 18 12 10 11 25 15 24 20 19 21 35 55 49 56 28 Where are different sample sizes of infected persons, The conditional average number HIV replications is given by ( ) . . // ( ) ( ) ( ) Since, ( ) 4 5( ) The following results obtained ( ) ( ) 35.8 8.9 0.018 82.13 46.1 14.41 0.037 90.78 45.13 1329 0.031 66.28 49.65 19.62 0.067 66.85 30.96 19.99 0.138 48.94 Figure: 1 0.018 0.037 0.031 0.067 0.138 0 0.02 0.04 0.06 0.08 0.1 0.12 0.14 0.16 5 10 15 20 25 P(Y/y>0) (ProbabilityofReplication) n (number of infected persons)
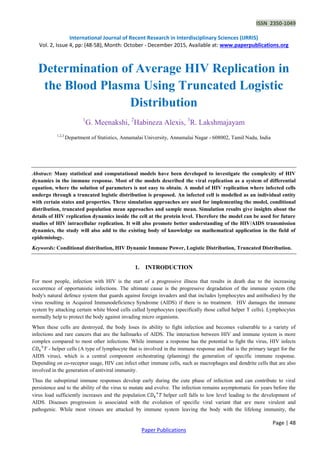
- 9. ISSN 2350-1049 International Journal of Recent Research in Interdisciplinary Sciences (IJRRIS) Vol. 2, Issue 4, pp: (48-58), Month: October - December 2015, Available at: www.paperpublications.org Page | 56 Paper Publications Figure: 2 Table.2 Sample Size Viral load per ml period 125 130 132 150 142 120 128 133 147 150 157 141 160 161 164 115 157 150 167 153 149 154 159 155 132 129 135 138 147 137 140 155 163 137 125 190 155 161 147 146 133 130 122 165 170 122 131 145 176 180 116 179 186 118 134 122 113 133 129 146 118 112 110 111 125 115 124 120 119 121 135 155 149 156 128 On simplification the results obtained ( ) ( ) 135.8 99.8 0.00000027 958.03 146.1 14.42 0.0000398 719.74 145.13 13.34 0.000019 760.95 149.65 19.62 0.000490 574.52 130.96 99.19 0.00141 444.21 82.13 90.78 66.28 66.85 48.94 0 10 20 30 40 50 60 70 80 90 100 5 10 15 20 25 E(y/y>0) Expectednumberofvirus n (number of infected persons)
- 10. ISSN 2350-1049 International Journal of Recent Research in Interdisciplinary Sciences (IJRRIS) Vol. 2, Issue 4, pp: (48-58), Month: October - December 2015, Available at: www.paperpublications.org Page | 57 Paper Publications Figure: 3 Figure: 4 Where sample mean ̅ is used as and sample ( ̅) as . The above table shows that the sample mean is unbiased estimate of population mean, within a time period the probability of HIV replication in the absence of treatment or ART is above 85% this implies that the HIV dynamic replication follows the truncated logistic distribution. 6. CONCLUSION In the situation of not yet finding medicine to cure the HIV infection, the study of HIV replication and lymphocytes damages are very important. Lymphocytes damages are very much affect our immune system to increase HIV replication always in the human body. In this position measuring viral load and damaged -cells for future period is very much essential to suggest the medicine for further period to prolong the human life time. Therefore this model is very much useful to prediction of HIV replication for future period. Further this research is useful in various discipline to production concept. 2.7E-07 3.98E-05 0.000019 0.00049 0.00141 0 0.0002 0.0004 0.0006 0.0008 0.001 0.0012 0.0014 0.0016 5 10 15 20 25 P(y/y>0) (ProbabilityofReplication) n (number of infected persons) 958.03 719.74 760.95 574.52 444.21 0 200 400 600 800 1000 1200 5 10 15 20 25 E(y/y>0) Expectednumberofvirus n (number of infected persons)
- 11. ISSN 2350-1049 International Journal of Recent Research in Interdisciplinary Sciences (IJRRIS) Vol. 2, Issue 4, pp: (48-58), Month: October - December 2015, Available at: www.paperpublications.org Page | 58 Paper Publications REFERENCES [1] A. S. Perelson., D.E. Kirschner., R. D. Boer. (1993). Dynamics of HIV infection of T- cells. Mathematical Biosciences. Vol. 114, pp. 81-125. [2] Anderson, R.M., et.al (1991). Infectious disease of human. Oxford University Press. [3] Anderson, R.M., May, R.M. (1979) Population biology of infectious diseases. Nature. Vol. 280, pp. 361–367. [4] Ashford L, (2006), How HIV and AIDS Affect Populations, Washington: Populations Reference Bureau (PRB). [5] Bortz, D.M., Nelson, P.W. (2005). Model Selection and Mixed-Effects Modeling of HIV Infection Dynamics. Bulletin of Mathematical Biology, USA I 48109-1043. [6] Bortz. D. M., Nelson. P.W., (2004). Sensitivity analysis of non-linear lumped parameter models of HIV infection dynamics. Bulletin of Mathematic Biology .Vol. 66 (5), pp. 1009-1026a. [7] Brookmeyer R, Gail MH (1986). Minimum size of the acquired immunodeficiency syndrome (AIDS) epidemic in the United States. Lancet. Vol. 2, pp. 1320-1322. [8] Coombs, R.W.; Collier, A.C.; Allain, J.P.; Nikora, B.; Leuther, M.; Gjerset, G.F.; Corey, L. (1989). Plasma viremia in human immunodeficiency virus infection. N. Engl. J. Med., Vol. 321, pp. 1626–1631. [9] Grossman, E.D., Donnelly, M., Price, P., Morgan, V., Pickens, D., Neighbor, G., & Bake, R., (2000). Brain areas involved in Perception of biological motion, Journal of cognitive. Neuro sceince, Vol.12(5), pp.711-720. [10] Ho, D. David.; Neumann, A, Perelson, A.; Chen, W.; Leonard, J.; Markowitz, M.( 1995). Rapid turnover of plasma virions and CD4 Lymphocytes in HIV-1 infection. Nature, Vol. 373, pp. 123–126. [11] Hofbauer, J.; Sigmund, K. (1990). Adaptive dynamics and evolutionary stability. Appl. Math. Letter. Vol.3, pp. 75– 79. [12] Jemie Guedj, Redolphe Thiebaut, Daniel Commenges (2007). Practical identinfiability of HIV dynamics models. Bulletin of Mathematical Biology .Vol. 69 (8), pp. 2493-2513. [13] Levy, J.A. (1988). Mysteries of HIV: Challenges for therapy and prevention. Nature, Vol. 333, pp. 519–522. [14] Louie, M., Hogan, C. Hurley, A. Simon, V. Chung, C. Padte. Lamy, P, Llaherty, J.Coakley, D. Mascio, M.D. Perelson, A.S. Markowitz, M (2003). Determining the antiviral activity of tenoforir disoproxil fumarate in treatment –naïve chronically HIV-1-infected individuals. AIDS, Vol. 17, pp. 1151-1156. [15] Lyles, C.M., Dorrucci, M., Vlahov, D., Pezzotti, P., Angarano, G., Sinicco, A., Alberici, F., Alcorn, T.M., Vella, S., Rezza, G (1999). Longitudinal human immunodeficiency virus type 1 load in theitalian seroconversion study: Correlates and temporal trends of virus load. J. Infect. Dis. Vol. 180, pp. 1018–1024. [16] Marion SA, Schecter MT (1993). Use of backcalculation for estimation of the probability of progression from HIV infection to AIDS. Statistics in Medicine. Vol. 12, pp. 617-631. [17] O’Brien, T.R.; Rosenberg, P.S.; Yellin, F.; Goedert, J.J.( 1998). Longitudinal HIV-1 RNA levels in a cohort of homosexual men. J Acquir Immun Defic Syndr Hum Retrovirol. Vol. 18, pp. 155–161. [18] Putzel J, (2003), is institutionalizing an Emergency response: HIV/AIDS and governance in Uganda and Senegal, Department of international Development, pp. 5-14. [19] R. Paul Duffin and Richard H. Tullis, (2002), Mathematical Models of the Complete Course of HIV Infection. [20] R.J. De Boer, A. S. Perelson, (1998). Target cell limited and immune control model of HIV infection:ba comarison. J. Theor. Biol. pp.190-201. [21] Richman, D.D.; Wrin, T.; Little, S.J.; Petropoulos, C.J. (2003). Rapid evolution of the neutralizing antibody response to HIV type 1 infection. Proc. Natl. Acad. Sci. USA. Vol. 100, pp. 4144–4149. [22] Rust, R.T., K.N. Lemon, and V. A. Zeithaml (2004). “Return on marketing: Using customer equity to focus marketing stategy”. Journal of marketing. Vol. 68, pp. 109-127.