SlideShare a Scribd company logo
1 of 9
Download to read offline
Immune cellular parameters of leprosy and human
immunodeficiency virus-1 co-infected subjects
Introduction
Leprosy is a chronic infectious disease, affecting the skin
and peripheral nerves, caused by the intracellular bacillus
Mycobacterium leprae.1
The incidence of new cases of lep-
rosy remains constant at 286 000 per year, and Brazil is
one of the countries worst affected, accounting for the
majority of new cases reported in the Americas.2
As the
prevalence rates of human immunodeficiency virus-1
(HIV-1) infection are escalating in some countries where
leprosy is endemic, one might expect that the geographic
overlap of the two epidemics may lead to increased
numbers of co-infected patients. The current situation
concerning leprosy endemicity and HIV-1 prevalence in
Brazil and other countries emphasizes the importance of
monitoring for co-infections.3
In addition to the public
health aspect of this co-infection, these pathogens may
have a potentially interesting immunologic interaction in
the human host.
It has been previously suggested that leprosy is a
human infection model in which to study the T helper
1/T helper 2 (Th1/Th2) paradigm,4
permitting the delin-
eation of polarized human T helper responses in response
to a single pathogen. The spectrum of M. leprae-specific
immune responses between these poles correlates with the
range of clinical manifestations of the infection.5
At the
Karina I. Carvalho,1
Solange
Maeda,1
Luciana Marti,2
Jane
Yamashita,1
Patrick A. J. Haslett3
and Esper G. Kallas1
1
Federal University of Sa˜o Paulo, Sa˜o Paulo,
Brazil, 2
Albert Einstein Research Institute, Sa˜o
Paulo, Brazil, and 3
University of Miami, FL,
USA
doi:10.1111/j.1365-2567.2007.02756.x
Received 1 June 2007; revised 15 October
2007; accepted 16 October 2007.
Correspondence: E. G. Kallas, MD, PhD,
Laborato´rio de Imunologia, Disciplina de
Doenc¸as Infecciosas e Parasita´rias, Escola
Paulista de Medicina/UNIFESP, Rua Mirassol
207, 04044-010 - Sa˜o Paulo – SP, Brazil.
Email: kallas.dmed@epm.br
Senior author: Esper Kallas
Abstract
Leprosy and human immunodeficiency virus-1 (HIV-1) are examples of
human infections where interactions between the pathogen and the host
cellular immunity determine the clinical manifestations of disease. Hence,
a significant immunopathological interaction between HIV-1 and leprosy
might be expected. In the present study we explored several aspects of cel-
lular immunity in patients co-infected with HIV-1 and Mycobacterium
leprae. Twenty-eight individuals were studied, comprising four groups:
healthy controls, HIV-1 and M. leprae co-infection, HIV-1 mono-infec-
tion, and M. leprae mono-infection. Subjects in the mono-infection and
co-infection groups were matched as far as possible for bacillary load and
HIV disease status, as appropriate. Peripheral blood mononuclear cells
(PBMC) were analysed using six- and seven-colour flow cytometry to
evaluate T-cell subpopulations and their activation status, dendritic cell
(DC) distribution phenotypes and expression of IL-4 by T cells. The
co-infected group exhibited lower CD4 : CD8 ratios, higher levels of
CD8+
T-cell activation, increased Vd1 : Vd2 T cell ratios and decreased
percentages of plasmacytoid DC, compared with HIV-1 mono-infected
subjects. Across infected groups, IL-4 production by CD4+
T lymphocytes
was positively correlated with the percentage of effector memory CD4+
T
cells, suggesting antigenically driven differentiation of this population of
T cells in both HIV-1 and M. leprae infections. Co-infection with M. le-
prae may exacerbate the immunopathology of HIV-1 disease. A T helper
2 (Th2) bias in the CD4+
T-cell response was evident in both HIV-1
infection and leprosy, but no additive effect was apparent in co-infected
patients.
Keywords: HIV; leprosy; co-infection; lymphocytes; IL-4
206 Ó 2008 The Authors Journal compilation Ó 2008 Blackwell Publishing Ltd, Immunology, 124, 206–214
IMMUNOLOGY ORIGINAL ARTICLE
Th1 pole, tuberculoid, or paucibacillary, leprosy is
characterized by high levels of specific cell-mediated
immunity that effectively limits bacillary replication and
is associated with limited disease, although often with
concomitant immunological damage to the nerves. At the
other pole, lepromatous, or multibacillary, leprosy is
characterized by a selective unresponsiveness to M. leprae
antigens, diffuse cutaneous disease and the uncontrolled
multiplication of organisms in the skin, often to extra-
ordinary numbers. Much of the morbidity of leprosy
results from episodic inflammatory exacerbations of lep-
rosy lesions in the skin and nerves, called ‘lepra’ reac-
tions, thought to be caused by spontaneous shifts in host
immunity.6
Because HIV-1 infection has a profound effect on the
incidence and clinico–pathological features of other myco-
bacterial diseases, such as tuberculosis, one might expect a
significant interaction also to exist between HIV-1 and
leprosy.7
In HIV-1/M. tuberculosis co-infections, immune
suppression secondary to HIV-1 infection accelerates the
progress of tuberculosis, and, conversely, the cellular
immune activation associated with tuberculosis is associ-
ated with more rapid progression of HIV-1 disease.8,9
In
the setting of HIV-1/M. leprae co-infections, there has
been a general expectation that immune deficiency caused
by HIV-1 infection would shift the spectrum of leprosy
towards the lepromatous (Th2) pole, although epidemio-
logical data are sparse and conflicting.10
Paradoxically, the
most detailed description of leprosy immunopathology in
HIV-1 co-infected patients revealed no change in immune
cell infiltrates across the leprosy spectrum, despite
advanced HIV-1-associated immune deficiency.7,11
On the
other hand, there has been little or no attempt to evaluate
the impact of M. leprae infection on HIV-1 pathogenesis.
This interaction has been studied in the macaque/simian
immunodeficiency virus (SIV) model, however, where
M. leprae infection was observed to exert an unexpected
and unexplained ameliorating effect on SIV disease, pro-
longing survival of the animals, despite equal or increased
viral burdens.12
In light of these various reported interactions of myco-
bacterial infections with HIV and SIV pathogenesis, we
were interested in investigating whether human M. leprae
co-infection might exacerbate or attenuate HIV-1 patho-
genesis. As an initial exploration of these questions, we
performed a cross-sectional analysis of immune cellu-
lar parameters in blood cells from relatively rare HIV-1
and M. leprae co-infected subjects, in comparison with
HIV-1 and M. leprae mono-infected subjects, and healthy
volunteers.
Our investigation focused on peripheral blood immune
cells that are known to be altered in HIV-1 disease and
that are implicated in the immunity and/or pathogenesis
of mycobacterial infections, including leprosy. Thus, in
addition to CD4 and CD8 T-cell subsets, we examined
the two main subsets of cd T cells: Vd2 cells and
Vd1 cells. Vd2 cells are stimulated by isoprenoid
phosphoantigens that are present in bacteria, including
mycobacteria.13
This population of cells plays a role in
antimycobacterial defense,14,15
but the cell population
shrinks dramatically during acute HIV-1 infection, with
variable recovery following antiviral chemotherapy.16,17
In
contrast, the Vd1 population, of unknown function,
expands during HIV-1 infection, so that the ratios of Vd1
to Vd2 T cells are increased with progressive HIV-1 infec-
tion.16,17
We also examined the two main subsets of
peripheral blood dendritic cells (DC), called plasmacytoid
and myeloid DC. DC are key components of the innate
immune system, acting as antigen-presenting cells that are
essential for the priming and regulation of T-cell immu-
nity. Hence, the responses and interactions of these popu-
lations of DC are thought to determine whether T cells
differentiate into Th1 or Th2 cells,18
spanning the range
of phenotypes observed in leprosy. Mycobacteria are
known to stimulate DC via toll-like receptors (TLR) pres-
ent on both myeloid (TLR2) and plasmacytoid (TLR9)
subsets.19–21
Both subsets of DC can be infected by HIV-1,
but a differential and striking loss of peripheral blood
plasmacytoid DC characterizes progressive HIV-1 dis-
ease.22
In light of the complex and contrasting effects of
HIV-1 and mycobacterial infections on cd T-cell and DC
populations, we were interested in examining these
immune cells in patients with HIV-1 and M. leprae
co-infections.
Materials and methods
Subjects and sample collection
This study was reviewed and approved by the local institu-
tional review board (IRB, Comiteˆ de E´tica em Pesquisa
Humana da Universidade Federal de Sa˜o Paulo/UNIFESP),
and IRB-approved informed consent was obtained from
all participants. Leprosy patients were treated according to
World Health Organization guidelines.23
Acquired immu-
nodeficiency syndrome (AIDS) was defined using modified
criteria adopted by the Brazilian Ministry of Health that
includes patients with a CD4 cell count of < 200 cells/ll
or clinical conditions related to AIDS.24
Seven healthy controls and seven HIV-seropositive
patients, most of whom had CD4+
T-cell counts of < 400
cells/ll, were identified at UNIFESP. Seven patients with
leprosy were enrolled at the Leprosy Clinic at the State
Health Department (Sao Paulo, Brazil) and were classified
according to their bacillary load.25
Seven patients
co-infected with leprosy and HIV-1 infection were
recruited at UNIFESP, using local identification and refer-
ral from other services in Sao Paulo. Leprosy patients
were matched for bacillary load with the patients in the
co-infected group. In this study, the major presentations
Ó 2008 The Authors Journal compilation Ó 2008 Blackwell Publishing Ltd, Immunology, 124, 206–214 207
Immunity in M. leprae and HIV-1 co-infection
of leprosy were the paucibacillary form rather than the
multibacillary form.
The HIV mono-infected and co-infected patients were
receiving highly active antiretroviral therapy (HAART)
and multidrug therapy (MDT). Patients with immune
reconstitution inflammatory syndrome were not included
in the present study to avoid potential interference in the
immune parameters, as described in different mycobacte-
rial diseases.26–28
Peripheral blood mononuclear cells (PBMC) were iso-
lated from the study subjects by density-gradient sedi-
mentation over Ficoll–Paque (Pharmacia Biotech,
Uppsala, Sweden). The isolated PBMC were then washed
twice in Hank’s balanced salt solution (Gibco, Grand
Island, NY). Cells were cryopreserved in RPMI 1640
(Gibco), supplemented with 20% heat-inactivated fetal
bovine serum (FBS; HyClone Laboratories, Logan, UT),
50 U/ml of penicillin (Gibco), 50 lg/ml of streptomycin
(Gibco), 10 mM glutamine (Gibco) and 7Á5% dimethyl
sulphoxide (DMSO; Sigma, St Louis, MO). Cryopre-
served cells were stored in liquid nitrogen until used in
the assays. At the time of the assay, PBMC were rapidly
thawed in a 37° water bath and washed in RPMI 1640
supplemented with 10% fetal calf serum, 100 U/ml of
penicillin, 100 lg/ml of streptomycin and 20 mM
glutamine (R10). Cells were counted, checked for viabil-
ity and resuspended in R10 at a concentration of 106
cells/ml.
Plasma HIV-1 RNA detection
The plasma HIV RNA detection load was assessed using
the ultrasensitive AMPLICOR HIV-1 MONITOR test ver-
sion 1.5 (Roche Diagnostics, Indianapolis, IN), according
to the manufacturer’s instructions.
Flow cytometry
The following monoclonal antibodies were used for
surface staining: CD3–allophycocyanin (APC) (clone
UCHT1), CD8–allophycocyanin carbocyanin 7 (APC-
Cy7) (clone SK1), Vd2–phycoerythrin (PE) (cloneB6),
CD45RA–peridin chlorophyll protein (PerCP) (clone HI
100), CCR7–phycoerithrin carbocyanin 7 (PeCY7) (clone
3D12) and CD69–fluorescein isothiocyanate (FITC)
(clone FN50), from BD PharMingen (San Jose, CA);
CD4–Alexa 610 (clone S3.5) from Caltag Laboratories
(Burlingame, CA); Vd1–FITC (clone T58.2) from Endo-
gen (Rockford, IL); Lineage Cocktail 1 (Lin 1: CD3,
CD14, CD16, CD19, CD20 and CD56) FITC, human
leucocyte antigen (HLA)-DR–PerCP (clone L243),
CD11c–APC (clone S-HCL3), CD123–PE [anti-interleukin
(IL)-3 receptor], CD38–PE (clone HB7), CD4–FITC (clone
L120), from BD Biosciences (San Jose, CA); and CD25–
PE–CY7 (clone BC96), from e-Bioscience, (San Diego,
CA). Intracellular staining for cytokines was performed
using mouse anti-human IL-4–PE (clone 3010.211), mouse
anti-human interferon (IFN)-c–PE–CY7 (clone B27) and
mouse anti-human tumour necrosis factor (TNF)-a–APC
(clone Mab11), all from BD PharMingen. Fluoresce minus
one (FMO) was used for gate strategy.29
In some experiments, thawed PBMC were incubated in
24-well plates (1 ml/well) (Becton Dickinson, San Jose,
CA) in the presence of 1 lM ionomycin (Sigma) and
20 ng/ml of phorbol 12-myristate 13-acetate (PMA;
Sigma), for 16 hr. After stimulation, cells were centrifuged
at 1500 g for 5 min and transferred into V-bottom
96-well plates (Nunc, Roskilde, Denmark) in 100 ll of
staining buffer [phosphate-buffered saline (PBS) supple-
mented with 0Á1% sodium azide (Sigma) and 1% FBS,
pH 7Á4–7Á6] with the panel of surface monoclonal anti-
bodies. Cells were incubated at 4° in darkness for 30 min,
washed twice and then resuspended in 100 ll of fixation
buffer [1% paraformaldehyde (Polysciences, Warrington,
PA) in PBS, pH 7Á4–7Á6].
Intracellular staining was performed after surface stain-
ing with CD4–FITC, CD3–PerCP and CD8–APC–CY7.
Cells were incubated with 100 ll of 4% fixation buffer
and washed with permeabilization buffer (PBS supple-
mented with 0Á1% sodium azide, 1% FBS and 0Á1% sapo-
nin; Sigma). Each sample was resuspended in 100 ll of
permeabilization buffer, incubated for 15 min at room
temperature in the dark, washed with 100 ll of staining
buffer and incubated for 30 min at 4° in the dark with
either no antibody (unstained tube) or anti-IL-4–PE, anti-
IFN-c–PE–CY7 and anti-TNF-a–APC in 50 ll of staining
buffer.30
Cells were washed with 200 ll of staining buffer
and resuspended in 100 ll of 1% paraformaldehyde (PFA)
for flow cytometry analysis. Samples were acquired on a
FACSCanto or FACSAria, using FACSDIVA software (BD
Biosciences), and the analysed with FLOWJO software (Tree
Star, San Carlo, CA). Fluorescence voltages were deter-
mined using matched unstained cells. Compensation was
carried out using CompBeads (BD Biosciences) single-
stained with CD3–PerCP, CD4–FITC, CD8–APC–CY7,
CD4–PE–CY7, CD3–PE or CD3–APC. Samples were
acquired until at least 200 000 events in a live lymphocyte
gate or at least 500 000 events in a live DC gate were
obtained.
Statistical analyses
Groups were compared using non-parametric models;
data are reported as median and interquartile range.
Comparisons among groups were carried out using the
Kruskall–Wallis non-parametric test, followed by inter-
group comparisons by the Dunnet test. Correlations were
performed using the Spearman non-parametric test.
P-values were considered significant if <0Á05. Results are
expressed in medians and interquartile ranges (IQR).
208 Ó 2008 The Authors Journal compilation Ó 2008 Blackwell Publishing Ltd, Immunology, 124, 206–214
K. I. Carvalho et al.
Results
Characteristics of the HIV-1-M. leprae co-infected
patients
Demographic, clinical, microbiological and laboratory
characteristics are detailed in Table 1. The median ages
of all participants was 38 years (IQR: 35–48) and most
were male (83Á9%). No difference in gender distribution
was observed between groups. For the leprosy and co-
infected groups, 80% of the patients had a paucibacil-
lary presentation at the time of diagnosis. Co-infected
patients were treated with the appropriate MDT for
paucibacillary and multibacillary leprosy. Median CD4+
T-cell counts in both HIV-infected groups were
matched (949 cells/ll, IQR 727Á5–1465 for controls; 297
cells/ll, IQR 265–410 for HIV-infected patients; and
236 cells/ll, IQR 161–390 for co-infected patients
Table 1).
Leprosy and HIV-1 infections lead to marked
disturbances of T-lymphocyte distribution
The CD4 : CD8 T-cell ratio was decreased in both HIV-1-
infected groups, but more in co-infected patients
compared with controls (0Á16, IQR 0Á09–0Á20; and
1Á30, IQR 0Á95–1Á9, respectively, P < 0Á001, Fig. 1a).
Although not statistically significant, co-infected patients
exhibited lower CD4 : CD8 ratios than HIV-1 mono-
infected subjects, suggesting more severe immunopathol-
ogy in the former group, despite similar CD4+
T-cell
counts (Fig. 1a).
Table 1. Demographic, clinical and laboratory characteristics of participants
Case
numbers1
Groups Gender
Age
(years)
Leprosy
clinical
presentation
Bacillary
index
Leprosy
therapy
(months
of MDT)
Viral load
(HIV-RNA
copies/ml)
CD4+
T cells/
mm3
HIV
therapy
102 Control Male 29 – – – – 1358 –
103 Control Female 47 – – – – 1695 –
104 Control Male 40 – – – – 742 –
105 Control Male 34 – – – – 774 –
106 Control Male 49 – – – – 1084 –
110 Control Male 54 – – – – 661 –
113 Control Female 51 – – – – 949 –
128 Control Male 37 – – – – 1571 –
131 Control Male 38 – – – – 713 –
142 Control Male 49 – – – – 980 –
1001 HIV Male 37 – – – <399 405 HAART
1004 HIV Male 34 – – – 925 503 HAART
1020 HIV Male 33 – – – <399 410 HAART
1039 HIV Male 35 – – – 200 170 HAART
1050 HIV Male 51 – – – <399 265 HAART
2008 HIV Male 38 – – – <399 275 HAART
2011 HIV Male 38 – – – 762 297 HAART
1 HIV-Leprosy Male 38 BL 2+ 10 <399 161 HAART
2 HIV-Leprosy Male 38 BT Negative 12 <399 269 HAART
3 HIV-Leprosy Male 31 BT 1+ 8 <399 235 HAART
4 HIV-Leprosy Female 51 BL 1+ 12 <399 390 HAART
5 HIV-Leprosy Male 35 BT Negative 12 7220 127 HAART
6 HIV-Leprosy Male 53 BT Negative 2 <399 236 HAART
7 HIV-Leprosy Male 47 BT 1+ 5 <399 481 HAART
10 Leprosy Male 38 LL 3+ 20 – ND
11 Leprosy Male 43 TT Negative 4 – ND
12 Leprosy Male 37 BT Negative 7 – ND
13 Leprosy Male 33 BT Negative 5 – ND
14 Leprosy Male 48 LL 3+ 23 – ND
15 Leprosy Female 31 BL 1+ 14 – ND
16 Leprosy Male 39 LL 3+ 22 – ND
BL, borderline-lepromatous; BT, borderline-tuberculoid; HAART, highly active antiretroviral therapy; HIV, human immunodeficiency virus; LL,
lepromatous-lepromatous; MDT, multidrug therapy; ND, not done; TT, tuberculoid.
1
Case numbers reflect the enrollment sequences only within each individual group.
Ó 2008 The Authors Journal compilation Ó 2008 Blackwell Publishing Ltd, Immunology, 124, 206–214 209
Immunity in M. leprae and HIV-1 co-infection
Surface activation markers were evaluated in all four
groups. Marked HLA-DR up-regulation on CD8+
T cells
was observed in both HIV/M. leprae co-infected and HIV
mono-infected groups compared with controls [mean flu-
orescence intensities of 165 (IQR 94–271), 134 (IQR 114–
249) and 46 (IQR 21–68), respectively, P < 0Á05, Fig. 1b],
but this was not seen in CD4+
T cells. There was a non-
significant trend towards increased HLA-DR expression in
the co-infected compared with the HIV-1 mono-infected
group (Fig. 1b). No differences were observed in the
expression of CD69, CD25 and CD38 on CD4+
and
CD8+
T lymphocytes (data not shown).
Dendritic cells and Vd2 T lymphocytes are
proportionately diminished in co-infected patients
The Vd2 T-cell subset was decreased in the co-infection
group when compared with the control group (median
1Á53%, IQR 0Á73–2Á4, P < 0Á05), whereas the percentage
of Vd1 T cells was similar in all groups. There was a sta-
tistically significant overall difference in the Vd1 : Vd2 cell
ratio, exaggeratedly inverted in the co-infected group
compared with subjects infected with HIV-1 only
(co-infection, 30Á3%, IQR 9Á9–35Á7; HIV, 5Á9%, IQR 3Á8–
13Á7; controls, 0Á63%, IQR 0Á25–3Á1; and leprosy, 2Á86%,
IQR 0Á44–10Á84, P < 0Á05, Fig. 1c).
The percentages of plasmacytoid DC in total PBMC
were diminished in co-infected patients when compared
with controls (co-infected, 0Á01%, IQR 0Á005–0Á02; HIV,
0Á02%, IQR 0Á005–0Á18; control, 0Á13%, IQR 0Á09–0Á18;
and leprosy, 0Á03%, IQR 0Á0–0Á15, P < 0Á05, Fig. 1d).
On the other hand, no significant differences in the
percentages of myeloid DC were observed (data not
shown).
HIV-1 and leprosy drives the maturation of
T lymphocytes
CD4+
T cells were stained for surface expression of
CD45RA and CCR7. Phenotypic nomenclature was based
on that proposed by Sallusto et al., where CCR7+
CD45RA+
are described as naı¨ve cells, CCR7+
CD45RA)
as central memory cells and CCR7)
CD45RA)
as effector
memory cells 31
. Control subjects had higher percentages
of naı¨ve and central memory cells compared with the
other groups, with a corresponding decrease in the pro-
portion of effector memory cells (Fig. 2). The most pro-
nounced difference in these maturation subsets was seen
when control subjects were compared with leprosy
patients (CCR7+
CD45RA+
naı¨ve: 5Á47%, IQR 1Á66–18Á2
for controls and 0Á56%, IQR 0Á22–1Á84 for leprosy;
CCR7+
CD45RA)
central memory: 33Á8%, IQR 28Á1–35Á7
for controls and 15Á05%, IQR 8Á6–22 for leprosy;
CCR7)
CD45RA)
effector: 49Á9%, IQR 47Á6–64 for con-
trols and 82Á6%, IQR 75Á15–87Á3 for leprosy). For CD8+
T-cell subsets, the only statistically significant difference
was observed when comparing central memory CCR7+
CD45RA)
cells from control subjects (17Á7%, IQR 13Á15–
30) with co-infected (4Á28%, IQR 2Á63–13Á2) and leprosy
(5Á67%, IQR 4Á79–10Á45) patients.
Both pathogens tend to direct the immune response
towards IL-4 production
Next, we assessed cytokine production after PMA and
ionomycin stimulation. No differences were observed in
the production of TNF-a and IFN-c between CD4+
and
CD8+
T lymphocytes. On the other hand, IL-4 produc-
tion, determined by high expression of IL-4 in gated
Control HIV HIV–leprosy Leprosy
0·0
0·5
1·0
1·5
2·0
2·5(a) (b)
(c) (d)
CD4:CD8ratioVδ1:Vδ2ratio
PlasmocytoidDC(%)HLA-DRMFI
P < 0·01
Control HIV HIV–leprosy Leprosy
0
100
200
300
400
500 P < 0·01
Control HIV HIV–leprosy Leprosy
0
10
20
30
40
50
60
70
P < 0·01
Control HIV HIV–leprosyLeprosy
0·0
0·1
0·2
0·3
0·4
0·5
0·6
0·7 P < 0·01
Figure 1. Several cellular immunological mark-
ers obtained using flow cytometry were evalu-
ated and compared among the four groups of
volunteers. These markers comprised (a) the
CD4 : CD8 ratio, (b) cellular activation of
CD8+
T cells, measured by human leuco-
cyte antigen (HLA)-DR expression, (c) the
Vd1 : Vd2 ratio and (d) the percentage of plas-
macytoid dendritic cells among total peripheral
blood mononuclear cells (PBMC). Compari-
sons were carried out using the Kruskal–Wallis
non-parametric test followed by intergroup
comparisons by the Dunnet test. HIV, human
immunodeficiency virus; MFI, mean fluores-
cence intensity.
210 Ó 2008 The Authors Journal compilation Ó 2008 Blackwell Publishing Ltd, Immunology, 124, 206–214
K. I. Carvalho et al.
CD4+
T cells, was statistically lower in controls (0Á57%,
IQR 0Á33–0Á93) when compared with the other three
groups (1Á09%, IQR 0Á62–2Á85; P = 0Á03). No statistically
Central memory
Naïve
Effector memory
Control HIV HIV–leprosy Leprosy
0
10
20
30
40
P < 0·01
Control HIV HIV–leprosy Leprosy
0
10
20
(a)
(b)
(c)
P < 0·01
Control HIV HIV–leprosy Leprosy
45
50
55
60
65
70
75
80
85
90
95
P < 0·01
CCR7+
CD45RA–
%inCD4+
TcellsCCR7–
CD45RA–
%inCD4+
TcellsCCR7+
CD45RA+
%inCD4+
Tcells
Figure 2. Distribution of cellular maturation markers of CD4+
T
cells. Cellular subpopulations were determined by the expression of
CCR7 and CD45RA after gating on CD3+
CD4+
cells. The percent-
age of (a) naı¨ve (CCR7+
CD45RA+
), (b) central memory (CCR7+
CD45RA)
) and (c) effector memory (CCR7)
CD45RA)
) cells are
depicted for all groups of subjects. HIV, human immunodeficiency
virus.
0 5 10 15 20 25 30 35 40
0
1
2
3
4
5
6
7
(c)
(b)
(a)
CD4
+
TcellsproducingIL-4(%)
r = –0·5861; P = 0·0003
30 40 50 60 70 80 90 100
CCR7
–
CD45RA
–
among CD4
+
T cells (%)
CCR7
–
CD45RA
–
among CD4
+
T cells (%)
0
1
2
3
4
5
6
7
CD4
+
TcellsproducingIL-4(%)
r = 0·4791; P = 0·0041
Control Co-infected
SSC
IL-4
0 102
103
104
105
0
1000
2000
3000
4000
0·42%
0 102
103
104
105
4·25%
Figure 3. Interleukin-4 (IL-4) production was determined by intra-
cellular staining and flow cytometry after stimulation with iono-
mycin and phorbol 12-myristate 13-acetate for 16 hr. (a) The IL-4+
gate was set for cells producing high levels of cytokine. The level of
IL-4 production was negatively correlated with the percentage of
central memory (CCR7+
CD45RA)
) CD4+
T cells (b) and positively
correlated with effector memory (CCR7)
CD45RA)
) CD4+
T cells
(c). The results for all four study subject groups are shown: solid cir-
cles, healthy controls; open circles, co-infection; open triangles,
human immunodeficiency virus-1; open squares, leprosy. Correla-
tions were assessed using the non-parametric Spearman’s test. SSC,
side scatter.
Ó 2008 The Authors Journal compilation Ó 2008 Blackwell Publishing Ltd, Immunology, 124, 206–214 211
Immunity in M. leprae and HIV-1 co-infection
significant differences of cytokine production by CD8+
T
cells were observed.
The IL-4 production by CD4+
T lymphocytes was nega-
tively correlated with the percentage of central memory
cells (r = )0Á59, P < 0Á01) and positively correlated with
the percentage of effector CD4+
T cells (r = 0Á48,
P < 0Á01) (Fig. 3). As shown in Fig. 3, the frequency of
IL-4+
T cells in control subjects clustered tightly, whereas
those in the three infected groups were increased and in
an overlapping distribution.
Discussion
There is considerable epidemiological overlap between
M. tuberculosis and HIV epidemics, so that co-infections
may be common in certain areas. In contrast, at present,
rather distinct populations tend to be infected with
M. leprae and HIV, so co-infections are much less com-
mon. However, future projections of spread of the HIV
epidemic into areas with more prevalent M. leprae infec-
tion may change the co-infection epidemiological char-
acteristics. The importance of tuberculosis and HIV
co-infection as a public health problem is obvious, but
this is less clear for M. leprae and HIV co-infections.32,33
However, the special nature of M. leprae stimulates
unique questions about the possible consequences of
co-infection. Infection with M. leprae differs in several
ways from that with M. tuberculosis – there is a much
more gradual evolution of disease, a classic spectrum of
clinical manifestations related to Th1 and Th2 responsive-
ness by the host, often huge antigenic burdens that are
slow to clear, and pathogenesis that is largely caused by
spontaneous shifts in host immune responsiveness, result-
ing in inflammatory lepra reactions.
We set out to compare cellular immune parameters in
HIV-1-infected patients with and without leprosy. A
limitation of the present study was the small sample size,
owing to the relative rarity of HIV-1/M. leprae co-in-
fected patients. Moreover, the challenge of interpreting
results from this cohort was compounded by the variabil-
ity of HIV disease, according to stage of progression,
superimposed on the spectral nature of leprosy. In an
attempt to derive meaningful data from the present
sample, we endeavoured to match HIV-1 and M. leprae
co-infected patients with HIV-1 and M. leprae mono-
infected subjects, for CD4 and bacillary index, respec-
tively (Table 1).
In the present study, we confirmed that leprosy
mono-infection is associated with increased IL-4 produc-
tion by CD4+
T cells (Fig. 3). A similar increase was
observed in HIV-1 mono-infection, as has been reported
by others,34
but no apparent additive or synergistic effect
was seen in HIV-1/M. leprae co-infected patients. Our
data suggest that leprosy co-infection may aggravate,
rather than ameliorate, HIV pathogenesis, as indicated
by the decreased ratio of CD4 : CD8 T cells, higher
frequency of activated CD8+
T cells and loss of plasma-
cytoid DC, all recognized features of progressive HIV-1
disease. This is in contrast to the observation of Gormus
et al., who made the unexpected observation of SIV
disease amelioration in the setting of experimental M. le-
prae co-infection of rhesus macaques.12
In the latter
studies, we speculate that the immunologic environment
associated with a high M. leprae antigenic burden might
have attenuated the immune activation-driven pathogen-
esis of SIV disease. However, our data do not support
the hypothesis that M. leprae co-infection can attenuate
the immunopathogenesis of human HIV-1 disease. On
the contrary, the results suggest that M. leprae co-infec-
tion may exacerbate HIV-1 pathogenesis. Clearly, there
are important differences between the macaque model
system and natural human infections. Macaques are
natural hosts of neither M. leprae nor SIV, and the ani-
mals were infected with a large intravenous inoculum of
bacilli. Perhaps most importantly, no inflammatory man-
ifestations of leprosy were described in the experimental
animals. On the other hand, inflammatory lepra
reactions can complicate up to half of human cases of
leprosy, and this immunopathology may indeed account
for much of the nerve damage and morbidity of this
disease. Cutaneous and systemic expression of pro-
inflammatory cytokines, such as TNF-a, have been
extensively documented in lepra reactions35,36
and may
be expected to promote HIV-1 replication. Indeed, cyto-
kine-driven enhancement of viral replication has been
invoked to explain the aggravation of HIV-1 disease in
patients with concurrent tuberculosis.37
Thus, in HIV-1/
M. leprae co-infection, inflammation associated with
clinical or subclinical lepra reactions may offset the
potential for any beneficial immune-modulatory effects
of M. leprae on HIV-1 disease progression.
Sallusto et al. described that immunological memory is
displayed by distinct T-cell subsets: lymph node-homing
CCR7+
CD45RA)
(central memory T cells, TCM) and tis-
sue-homing cells CCR7)
CD45RA)
(effector memory
T cells, TEM).31
Our results suggest that leprosy patients
have a decreased number of naı¨ve cells when compared
with healthy controls, together with a decreased percent-
age of TCM and an increased percentage of TEM, mostly
in co-infected patients. We hypothesize that the
imbalance in the percentage distribution seen in leprosy
and co-infected patients reflects a switch from naı¨ve to
memory CD4+
T lymphocytes, as a result of continuous
antigenic stimulation and cellular activation, as also seen
in the context of tuberculosis.38
This finding may well
represent a reactive expansion of ‘protective memory’
TEM cells in response to M. leprae and HIV as a result of
differentiation of TCM to combat the pathogen, especially
in the tissues, considering the high antigenic burden
observed in both diseases.39
212 Ó 2008 The Authors Journal compilation Ó 2008 Blackwell Publishing Ltd, Immunology, 124, 206–214
K. I. Carvalho et al.
Curiously, a positive correlation was observed between
the proportional expansion of circulating TEM CD4+
T
cells and the percentage of IL-4+
-producing CD4+
T cells
after stimulation with PMA and ionomycin (Fig. 3b).
Although our analysis did not permit us to ascertain
directly whether TEM are actually the producers of IL-4, it
is likely that these Th2-differentiated cells are indeed anti-
gen-experienced members of the CD4+
TEM population.
This interpretation is consistent with previous reports of
higher IL-4 production in the context of M. leprae40,41
and HIV-142
infections. As increased frequencies of these
cells were observed in chronic HIV-1 and/or M. leprae
infections, there is clearly an association between IL-4
production and the presence of antigen. However, our
approach did not address the antigen specificity of the
IL-4-producing T cells. Others have demonstrated expres-
sion of Th2 cytokines in leprosy lesions,35,40,43
which may
represent antigen-driven or cytokine-driven expansion of
M. leprae-specific T cells.44
These responses may be influ-
enced by the genetic background of the individual as well
as by environmental factors.44
We suggest that the contin-
uing production of IL-4 by HIV-1 and M. leprae-specific
T cells may create a ‘Th2 environment’ in which the
priming of T cells to heterologous antigens is biased
towards IL-4 production.45
Exploring the association of
higher IL-4 production after PMA and ionomycin stimu-
lation, and expansion of TEM, may present an opportu-
nity to elucidate the mechanisms involved in the possibly
deleterious effect of M. leprae infection in HIV-1-infected
patients observed in our study.
In conclusion, this initial exploration of the cellular
immune interactions of leprosy and HIV-1 disease sug-
gests that chronic infection with M. leprae might exacer-
bate the immunopathogenesis of HIV-1 disease. We
speculate that this may be the result of a combination of
inflammatory lepra reactions and the aggravated Th2
environment induced by M. leprae antigens. Prospective
longitudinal studies are needed to address the questions
raised in this work.
Acknowledgements
This work was partially supported by Fundac¸a˜o Paulista
contra a Hansenı´ase, National Institutes of Health, grant
#R01-AI052731-06, and The Fogarty International Center,
grant #D43 TW00003; KCS’s PhD scholarship was pro-
vided by the Conselho Nacional de Desenvolvimento
Cientı´fico e Tecnolo´gico (CNPq), Brazilian Ministry of
Science and Technology. We are also thankful for support
from the Heiser Program for Research in Leprosy and
Tuberculosis of The New York Community Trust.
Conflicts of interests
The authors declare no competing conflicts of interests.
References
1 Lockwood DN, Kumar B. Treatment of leprosy. BMJ 2004;
328:1447–8.
2 Meima A, Smith WC, van Oortmarssen GJ, Richardus JH,
Habbema JD. The future incidence of leprosy: a scenario analy-
sis. Bull World Health Organ 2004; 82:373–80.
3 Pereira GA, Stefani MM, Araujo Filho JA, Souza LC, Stefani GP,
Martelli CM. Human immunodeficiency virus type 1 (HIV-1)
and Mycobacterium leprae co-infection: HIV-1 subtypes and clin-
ical, immunologic, and histopathologic profiles in a Brazilian
cohort. Am J Trop Med Hyg 2004; 71:679–84.
4 Mosmann TR, Cherwinski H, Bond MW, Giedlin MA, Coffman
RL. Two types of murine helper T cell clone. I. Definition
according to profiles of lymphokine activities and secreted pro-
teins. J Immunol 1986; 136:2348–57.
5 Modlin RL. Th1-Th2 paradigm: insights from leprosy. J Invest
Dermatol 1994; 102:828–32.
6 Bloom BR. Learning from leprosy: a perspective on immunology
and the Third World. J Immunol 1986; 137:i–x.
7 Ustianowski AP, Lawn SD, Lockwood DN. Interactions between
HIV infection and leprosy: a paradox. Lancet Infect Dis 2006;
6:350–60.
8 Toossi Z, Mayanja-Kizza H, Hirsch CS et al. Impact of tubercu-
losis (TB) on HIV-1 activity in dually infected patients. Clin Exp
Immunol 2001; 123:233–8.
9 Whalen C, Horsburgh CR, Hom D, Lahart C, Simberkoff M,
Ellner J. Accelerated course of human immunodeficiency virus
infection after tuberculosis. Am J Respir Crit Care Med 1995;
151:129–35.
10 Nath I, Vemuri N, Reddi AL, Jain S, Brooks P, Colston MJ,
Misra RS, Ramesh V. The effect of antigen presenting cells on
the cytokine profiles of stable and reactional lepromatous lep-
rosy patients. Immunol Lett 2000; 75:69–76.
11 Sampaio EP, Caneshi JR, Nery JA et al. Cellular immune
response to Mycobacterium leprae infection in human immuno-
deficiency virus-infected individuals. Infect Immun 1995;
63:1848–54.
12 Gormus BJ, Murphey-Corb M, Baskin GB, Uherka K, Martin
LN, Marx PA, Xu K, Ratterree MS. Interactions between Myco-
bacterium leprae and simian immunodeficiency virus (SIV) in
rhesus monkeys. J Med Primatol 2000; 29:259–67.
13 Eberl M, Hintz M, Reichenberg A, Kollas AK, Wiesner J, Jomaa
H. Microbial isoprenoid biosynthesis and human gammadelta
T cell activation. FEBS Lett 2003; 544:4–10.
14 Barnes PF, Grisso CL, Abrams JS, Band H, Rea TH, Modlin RL.
Gamma delta T lymphocytes in human tuberculosis. J Infect Dis
1992; 165:506–12.
15 Fujita M, Miyachi Y, Nakata K, Imamura S. Appearance of
gamma delta T cell receptor-positive cells following alpha beta
T cell receptor-positive cells in the lepromin reaction of human
skin. Immunol Lett 1993; 35:39–44.
16 Poccia F, Gougeon ML, Agrati C et al. Innate T-cell immunity
in HIV infection: the role of Vgamma9Vdelta2 T lymphocytes.
Curr Mol Med 2002; 2:769–81.
17 Poles MA, Barsoum S, Yu W et al. Human immunodeficiency
virus type 1 induces persistent changes in mucosal and blood
gammadelta T cells despite suppressive therapy. J Virol 2003;
77:10456–67.
Ó 2008 The Authors Journal compilation Ó 2008 Blackwell Publishing Ltd, Immunology, 124, 206–214 213
Immunity in M. leprae and HIV-1 co-infection
18 Pulendran B. Modulating TH1/TH2 responses with microbes,
dendritic cells, and pathogen recognition receptors. Immunol Res
2004; 29:187–96.
19 Kadowaki N, Ho S, Antonenko S, Malefyt RW, Kastelein RA,
Bazan F, Liu YJ. Subsets of human dendritic cell precursors
express different toll-like receptors and respond to different
microbial antigens. J Exp Med 2001; 194:863–9.
20 Krutzik SR, Ochoa MT, Sieling PA et al. Activation and regula-
tion of Toll-like receptors 2 and 1 in human leprosy. Nat Med
2003; 9:525–32.
21 Bafica A, Scanga CA, Feng CG, Leifer C, Cheever A, Sher A.
TLR9 regulates Th1 responses and cooperates with TLR2 in
mediating optimal resistance to Mycobacterium tuberculosis.
J Exp Med 2005; 202:1715–24.
22 Levy JA, Scott I, Mackewicz C. Protection from HIV/AIDS: the
importance of innate immunity. Clin Immunol 2003; 108:167–
74.
23 Organizaton WH. Chemotherapy of leprosy for control pro-
gramme, report of WHO study group. WHO TechRepSer 1982;
675:1–33.
24 Sau´de MD. Recomendac¸o˜es para Terapia Anti-Retroviral em Adul-
tos e Adolescentes Infectados pelo HIV. Brası´lia-DF: Ministe´rio da
Sau´de, 2006:1–85.
25 Ridley DS, Jopling WH. Classification of leprosy according to
immunity. A five-group system. Int J Lepr Other Mycobact Dis
1966; 34:255–73.
26 Hirsch HH, Kaufmann G, Sendi P, Battegay M. Immune recon-
stitution in HIV-infected patients. Clin Infect Dis 2004; 38:1159–
66.
27 Goebel FD. Immune reconstitution inflammatory syndrome
(IRIS) – another new disease entity following treatment initia-
tion of HIV infection. Infection 2005; 33:43–5.
28 Couppie P, Abel S, Voinchet H, Roussel M, Helenon R, Huerre
M, Sainte-Marie D, Cabie A. Immune reconstitution inflamma-
tory syndrome associated with HIV and leprosy. Arch Dermatol
2004; 140:997–1000.
29 Roederer M. Spectral compensation for flow cytometry: visuali-
zation artifacts, limitations, and caveats. Cytometry 2001; 45:194–
205.
30 Kallas EG, Gibbons DC, Soucier H, Fitzgerald T, Treanor JJ,
Evans TG. Detection of intracellular antigen-specific cytokines in
human T cell populations. J Infect Dis 1999; 179:1124–31.
31 Sallusto F, Lenig D, Forster R, Lipp M, Lanzavecchia A. Two
subsets of memory T lymphocytes with distinct homing poten-
tials and effector functions. Nature 1999; 401:708–12.
32 Stenger S, Modlin RL. T cell mediated immunity to Mycobacte-
rium tuberculosis. Curr Opin Microbiol 1999; 2:89–93.
33 Antas PR, Sales JS, Pereira KC, Oliveira EB, Cunha KS, Sarno
EN, Sampaio EP. Patterns of intracellular cytokines in CD4 and
CD8 T cells from patients with mycobacterial infections. Braz J
Med Biol Res 2004; 37:1119–29.
34 Sousa AE, Chaves AF, Doroana M, Antunes F, Victorino RM.
Bulk cytokine production versus frequency of cytokine-produc-
ing cells in HIV1 infection before and during HAART. Clin
Immunol 2000; 97:162–70.
35 Yamamura M, Wang XH, Ohmen JD, Uyemura K, Rea TH,
Bloom BR, Modlin RL. Cytokine patterns of immunologically
mediated tissue damage. J Immunol 1992; 149:1470–5.
36 Barnes PF, Abrams JS, Lu S, Sieling PA, Rea TH, Modlin RL.
Patterns of cytokine production by mycobacterium-reactive
human T-cell clones. Infect Immun 1993; 61:197–203.
37 de Castro Cunha RM, Kallas EG, Rodrigues DS, Nascimento
Burattini M, Salomao R. Interferon-gamma and tumour necrosis
factor-alpha production by CD4+ T and CD8+ T lymphocytes
in AIDS patients with tuberculosis. Clin Exp Immunol 2005;
140:491–7.
38 Rodrigues DS, Medeiros EA, Weckx LY, Bonnez W, Salomao R,
Kallas EG. Immunophenotypic characterization of peripheral
T lymphocytes in Mycobacterium tuberculosis infection and dis-
ease. Clin Exp Immunol 2002; 128:149–54.
39 Sallusto F, Geginat J, Lanzavecchia A. Central memory and
effector memory T cell subsets: function, generation, and main-
tenance. Annu Rev Immunol 2004; 22:745–63.
40 Yamamura M, Uyemura K, Deans RJ, Weinberg K, Rea TH,
Bloom BR, Modlin RL. Defining protective responses to patho-
gens: cytokine profiles in leprosy lesions. Science 1991; 254:277–
9.
41 Salgame P, Abrams JS, Clayberger C, Goldstein H, Convit J,
Modlin RL, Bloom BR. Differing lymphokine profiles of func-
tional subsets of human CD4 and CD8 T cell clones. Science
1991; 254:279–82.
42 Galli G, Annunziato F, Mavilia C et al. Enhanced HIV expres-
sion during Th2-oriented responses explained by the opposite
regulatory effect of IL-4 and IFN-gamma of fusin/CXCR4. Eur J
Immunol 1998; 28:3280–90.
43 Sieling PA, Abrams JS, Yamamura M, Salgame P, Bloom BR,
Rea TH, Modlin RL. Immunosuppressive roles for IL-10 and
IL-4 in human infection. In vitro modulation of T cell responses
in leprosy. J Immunol 1993; 150:5501–10.
44 Mitra DK, De Rosa SC, Luke A et al. Differential representations
of memory T cell subsets are characteristic of polarized immu-
nity in leprosy and atopic diseases. Int Immunol 1999; 11:1801–
10.
45 Stutz A, Graf P, Beinhauer B, Hammerschmid F, Neumann C,
Woisetschlager M, Jung T. CD45 isoform expression is associ-
ated with different susceptibilities of human naive and effector
CD4+ T cells to respond to IL-4. Eur J Immunol 2005; 35:575–
83.
214 Ó 2008 The Authors Journal compilation Ó 2008 Blackwell Publishing Ltd, Immunology, 124, 206–214
K. I. Carvalho et al.

More Related Content

What's hot

1-s2.0-S1472979215302419-main
1-s2.0-S1472979215302419-main1-s2.0-S1472979215302419-main
1-s2.0-S1472979215302419-main
Karina Chavez
 
Immunology and Detection of Acute HIV-1 Infection
Immunology and Detection of Acute HIV-1 InfectionImmunology and Detection of Acute HIV-1 Infection
Immunology and Detection of Acute HIV-1 Infection
Rongpong Plongla
 
Aids Hiv Assignment
Aids Hiv AssignmentAids Hiv Assignment
Aids Hiv Assignment
Thư Viện Số
 

What's hot (20)

Monkey Bites and Herpes B –Virus Infection in Humans
Monkey Bites and Herpes B –Virus Infection in HumansMonkey Bites and Herpes B –Virus Infection in Humans
Monkey Bites and Herpes B –Virus Infection in Humans
 
Understanding A Pandemic: COVID-19
Understanding A Pandemic: COVID-19Understanding A Pandemic: COVID-19
Understanding A Pandemic: COVID-19
 
1-s2.0-S1472979215302419-main
1-s2.0-S1472979215302419-main1-s2.0-S1472979215302419-main
1-s2.0-S1472979215302419-main
 
Emerging infectious diseases paper 203
Emerging infectious diseases  paper 203Emerging infectious diseases  paper 203
Emerging infectious diseases paper 203
 
Hiv infection
Hiv  infectionHiv  infection
Hiv infection
 
HIV-1 PATHOGENESIS AND GENETIC FORMS
HIV-1 PATHOGENESIS AND GENETIC FORMSHIV-1 PATHOGENESIS AND GENETIC FORMS
HIV-1 PATHOGENESIS AND GENETIC FORMS
 
Immunology and Detection of Acute HIV-1 Infection
Immunology and Detection of Acute HIV-1 InfectionImmunology and Detection of Acute HIV-1 Infection
Immunology and Detection of Acute HIV-1 Infection
 
Microbiology of HIV
Microbiology of HIVMicrobiology of HIV
Microbiology of HIV
 
Dr. Robert Tauxe - Public Health Concerns About Resistant Foodborne Infections
Dr. Robert Tauxe - Public Health Concerns About Resistant Foodborne InfectionsDr. Robert Tauxe - Public Health Concerns About Resistant Foodborne Infections
Dr. Robert Tauxe - Public Health Concerns About Resistant Foodborne Infections
 
Determination of Average HIV Replication in the Blood Plasma Using Truncated ...
Determination of Average HIV Replication in the Blood Plasma Using Truncated ...Determination of Average HIV Replication in the Blood Plasma Using Truncated ...
Determination of Average HIV Replication in the Blood Plasma Using Truncated ...
 
Lecture 14. aids
Lecture 14. aidsLecture 14. aids
Lecture 14. aids
 
Aids Hiv Assignment
Aids Hiv AssignmentAids Hiv Assignment
Aids Hiv Assignment
 
Open Journal of Pediatrics & Neonatal Care
Open Journal of Pediatrics & Neonatal CareOpen Journal of Pediatrics & Neonatal Care
Open Journal of Pediatrics & Neonatal Care
 
Immune Responses To The Pandemic New Coronavirus (COVID-19)by Prof. Mohamed L...
Immune Responses To The Pandemic New Coronavirus (COVID-19)by Prof. Mohamed L...Immune Responses To The Pandemic New Coronavirus (COVID-19)by Prof. Mohamed L...
Immune Responses To The Pandemic New Coronavirus (COVID-19)by Prof. Mohamed L...
 
Emerging and re emerging diseases (part 1 of 2)
Emerging and re emerging diseases (part 1 of 2)Emerging and re emerging diseases (part 1 of 2)
Emerging and re emerging diseases (part 1 of 2)
 
Some quick facts and numbers on Coronavirus (COVID-19)
Some quick facts and numbers on Coronavirus (COVID-19) Some quick facts and numbers on Coronavirus (COVID-19)
Some quick facts and numbers on Coronavirus (COVID-19)
 
Emerging and Re-emerging Infectious Diseases
Emerging and Re-emerging Infectious DiseasesEmerging and Re-emerging Infectious Diseases
Emerging and Re-emerging Infectious Diseases
 
Hiv aids
Hiv aidsHiv aids
Hiv aids
 
Duesberg Assignment
Duesberg AssignmentDuesberg Assignment
Duesberg Assignment
 
Immunocompromised patient with sepsis
Immunocompromised patient with sepsisImmunocompromised patient with sepsis
Immunocompromised patient with sepsis
 

Viewers also liked

JamesCarr461FinalProject
JamesCarr461FinalProjectJamesCarr461FinalProject
JamesCarr461FinalProject
James Carr
 
KK Wong Degreee Transcript
KK Wong Degreee TranscriptKK Wong Degreee Transcript
KK Wong Degreee Transcript
Wong Kok Keen
 
Sarah Duffy CV HR
Sarah Duffy CV HR Sarah Duffy CV HR
Sarah Duffy CV HR
Sarah Duffy
 
Project Plan Class A Group 2
Project Plan Class A Group 2Project Plan Class A Group 2
Project Plan Class A Group 2
Manuel Zoccheddu
 
presentation-web
presentation-webpresentation-web
presentation-web
Amanda Choy
 
DHW Planning for Growth copy
DHW Planning for Growth copyDHW Planning for Growth copy
DHW Planning for Growth copy
Brett Lear
 

Viewers also liked (19)

Fire alarm 3-d-supervising_station_alarm_system
Fire alarm 3-d-supervising_station_alarm_systemFire alarm 3-d-supervising_station_alarm_system
Fire alarm 3-d-supervising_station_alarm_system
 
Presentation1
Presentation1Presentation1
Presentation1
 
Day 1 legendary beginnings &amp; roman republic wenger
Day 1 legendary beginnings &amp; roman republic wengerDay 1 legendary beginnings &amp; roman republic wenger
Day 1 legendary beginnings &amp; roman republic wenger
 
Watershed stewards Acamdemy Event Featuring Howard County's Sustainability Ch...
Watershed stewards Acamdemy Event Featuring Howard County's Sustainability Ch...Watershed stewards Acamdemy Event Featuring Howard County's Sustainability Ch...
Watershed stewards Acamdemy Event Featuring Howard County's Sustainability Ch...
 
JamesCarr461FinalProject
JamesCarr461FinalProjectJamesCarr461FinalProject
JamesCarr461FinalProject
 
KK Wong Degreee Transcript
KK Wong Degreee TranscriptKK Wong Degreee Transcript
KK Wong Degreee Transcript
 
Formasi jabatan kaltara
Formasi jabatan kaltaraFormasi jabatan kaltara
Formasi jabatan kaltara
 
Amaze showcase review
Amaze showcase reviewAmaze showcase review
Amaze showcase review
 
Sarah Duffy CV HR
Sarah Duffy CV HR Sarah Duffy CV HR
Sarah Duffy CV HR
 
How to export to another country
How to export to another countryHow to export to another country
How to export to another country
 
Project Plan Class A Group 2
Project Plan Class A Group 2Project Plan Class A Group 2
Project Plan Class A Group 2
 
Evidence 3
Evidence 3Evidence 3
Evidence 3
 
Cat.dcs.cmms.servlet loader
Cat.dcs.cmms.servlet loaderCat.dcs.cmms.servlet loader
Cat.dcs.cmms.servlet loader
 
presentation-web
presentation-webpresentation-web
presentation-web
 
CV SANJEEV UAE
CV SANJEEV UAECV SANJEEV UAE
CV SANJEEV UAE
 
Priz
PrizPriz
Priz
 
DHW Planning for Growth copy
DHW Planning for Growth copyDHW Planning for Growth copy
DHW Planning for Growth copy
 
15 способов повышения активности подписчиков группы VKontakte
15 способов повышения активности подписчиков группы VKontakte15 способов повышения активности подписчиков группы VKontakte
15 способов повышения активности подписчиков группы VKontakte
 
Jackson Pollock (1)
Jackson Pollock (1)Jackson Pollock (1)
Jackson Pollock (1)
 

Similar to Carvalho 2008

Infections in immunocompromised patients
Infections in immunocompromised patientsInfections in immunocompromised patients
Infections in immunocompromised patients
جهاد الخريصي
 
Microbiology hiv-yf
Microbiology   hiv-yfMicrobiology   hiv-yf
Microbiology hiv-yf
MBBS IMS MSU
 

Similar to Carvalho 2008 (20)

CNS IRIS.pptx
CNS IRIS.pptxCNS IRIS.pptx
CNS IRIS.pptx
 
CNS IRIS.pptx
CNS IRIS.pptxCNS IRIS.pptx
CNS IRIS.pptx
 
HIV / AIDS Pathology
HIV / AIDS PathologyHIV / AIDS Pathology
HIV / AIDS Pathology
 
Hiv infection-and-aids dr bikal
Hiv infection-and-aids dr bikalHiv infection-and-aids dr bikal
Hiv infection-and-aids dr bikal
 
AIDS PRESANTATION.pptx
AIDS PRESANTATION.pptxAIDS PRESANTATION.pptx
AIDS PRESANTATION.pptx
 
Mecanismo les
Mecanismo lesMecanismo les
Mecanismo les
 
AJMS_390_22.pdf
AJMS_390_22.pdfAJMS_390_22.pdf
AJMS_390_22.pdf
 
Upsurge of Cases of Lichen Planus in Iraqi Population in Baghdad City with Fr...
Upsurge of Cases of Lichen Planus in Iraqi Population in Baghdad City with Fr...Upsurge of Cases of Lichen Planus in Iraqi Population in Baghdad City with Fr...
Upsurge of Cases of Lichen Planus in Iraqi Population in Baghdad City with Fr...
 
Unit 16 HIV-AIDS (1).pptx
Unit 16 HIV-AIDS (1).pptxUnit 16 HIV-AIDS (1).pptx
Unit 16 HIV-AIDS (1).pptx
 
Mathematical modeling
Mathematical modelingMathematical modeling
Mathematical modeling
 
13-HIV & AIDS.Hope 25.03.22.pptx
13-HIV & AIDS.Hope 25.03.22.pptx13-HIV & AIDS.Hope 25.03.22.pptx
13-HIV & AIDS.Hope 25.03.22.pptx
 
Infections in immunocompromised patients
Infections in immunocompromised patientsInfections in immunocompromised patients
Infections in immunocompromised patients
 
Hiv infection by ved
Hiv infection by vedHiv infection by ved
Hiv infection by ved
 
Microbiology hiv-yf
Microbiology   hiv-yfMicrobiology   hiv-yf
Microbiology hiv-yf
 
Monocyte lymphocyte ratio with reference to tuberculosis
Monocyte lymphocyte ratio with reference to tuberculosisMonocyte lymphocyte ratio with reference to tuberculosis
Monocyte lymphocyte ratio with reference to tuberculosis
 
Is susceptibility to tuberculosis acquired
Is susceptibility to tuberculosis acquiredIs susceptibility to tuberculosis acquired
Is susceptibility to tuberculosis acquired
 
Is susceptibility to tuberculosis acquired
Is susceptibility to tuberculosis acquiredIs susceptibility to tuberculosis acquired
Is susceptibility to tuberculosis acquired
 
Is susceptibility to tuberculosis acquired
Is susceptibility to tuberculosis acquiredIs susceptibility to tuberculosis acquired
Is susceptibility to tuberculosis acquired
 
HIV and Lung health
HIV and Lung healthHIV and Lung health
HIV and Lung health
 
Jiro chido.pdf
Jiro chido.pdfJiro chido.pdf
Jiro chido.pdf
 

Carvalho 2008

  • 1. Immune cellular parameters of leprosy and human immunodeficiency virus-1 co-infected subjects Introduction Leprosy is a chronic infectious disease, affecting the skin and peripheral nerves, caused by the intracellular bacillus Mycobacterium leprae.1 The incidence of new cases of lep- rosy remains constant at 286 000 per year, and Brazil is one of the countries worst affected, accounting for the majority of new cases reported in the Americas.2 As the prevalence rates of human immunodeficiency virus-1 (HIV-1) infection are escalating in some countries where leprosy is endemic, one might expect that the geographic overlap of the two epidemics may lead to increased numbers of co-infected patients. The current situation concerning leprosy endemicity and HIV-1 prevalence in Brazil and other countries emphasizes the importance of monitoring for co-infections.3 In addition to the public health aspect of this co-infection, these pathogens may have a potentially interesting immunologic interaction in the human host. It has been previously suggested that leprosy is a human infection model in which to study the T helper 1/T helper 2 (Th1/Th2) paradigm,4 permitting the delin- eation of polarized human T helper responses in response to a single pathogen. The spectrum of M. leprae-specific immune responses between these poles correlates with the range of clinical manifestations of the infection.5 At the Karina I. Carvalho,1 Solange Maeda,1 Luciana Marti,2 Jane Yamashita,1 Patrick A. J. Haslett3 and Esper G. Kallas1 1 Federal University of Sa˜o Paulo, Sa˜o Paulo, Brazil, 2 Albert Einstein Research Institute, Sa˜o Paulo, Brazil, and 3 University of Miami, FL, USA doi:10.1111/j.1365-2567.2007.02756.x Received 1 June 2007; revised 15 October 2007; accepted 16 October 2007. Correspondence: E. G. Kallas, MD, PhD, Laborato´rio de Imunologia, Disciplina de Doenc¸as Infecciosas e Parasita´rias, Escola Paulista de Medicina/UNIFESP, Rua Mirassol 207, 04044-010 - Sa˜o Paulo – SP, Brazil. Email: kallas.dmed@epm.br Senior author: Esper Kallas Abstract Leprosy and human immunodeficiency virus-1 (HIV-1) are examples of human infections where interactions between the pathogen and the host cellular immunity determine the clinical manifestations of disease. Hence, a significant immunopathological interaction between HIV-1 and leprosy might be expected. In the present study we explored several aspects of cel- lular immunity in patients co-infected with HIV-1 and Mycobacterium leprae. Twenty-eight individuals were studied, comprising four groups: healthy controls, HIV-1 and M. leprae co-infection, HIV-1 mono-infec- tion, and M. leprae mono-infection. Subjects in the mono-infection and co-infection groups were matched as far as possible for bacillary load and HIV disease status, as appropriate. Peripheral blood mononuclear cells (PBMC) were analysed using six- and seven-colour flow cytometry to evaluate T-cell subpopulations and their activation status, dendritic cell (DC) distribution phenotypes and expression of IL-4 by T cells. The co-infected group exhibited lower CD4 : CD8 ratios, higher levels of CD8+ T-cell activation, increased Vd1 : Vd2 T cell ratios and decreased percentages of plasmacytoid DC, compared with HIV-1 mono-infected subjects. Across infected groups, IL-4 production by CD4+ T lymphocytes was positively correlated with the percentage of effector memory CD4+ T cells, suggesting antigenically driven differentiation of this population of T cells in both HIV-1 and M. leprae infections. Co-infection with M. le- prae may exacerbate the immunopathology of HIV-1 disease. A T helper 2 (Th2) bias in the CD4+ T-cell response was evident in both HIV-1 infection and leprosy, but no additive effect was apparent in co-infected patients. Keywords: HIV; leprosy; co-infection; lymphocytes; IL-4 206 Ó 2008 The Authors Journal compilation Ó 2008 Blackwell Publishing Ltd, Immunology, 124, 206–214 IMMUNOLOGY ORIGINAL ARTICLE
  • 2. Th1 pole, tuberculoid, or paucibacillary, leprosy is characterized by high levels of specific cell-mediated immunity that effectively limits bacillary replication and is associated with limited disease, although often with concomitant immunological damage to the nerves. At the other pole, lepromatous, or multibacillary, leprosy is characterized by a selective unresponsiveness to M. leprae antigens, diffuse cutaneous disease and the uncontrolled multiplication of organisms in the skin, often to extra- ordinary numbers. Much of the morbidity of leprosy results from episodic inflammatory exacerbations of lep- rosy lesions in the skin and nerves, called ‘lepra’ reac- tions, thought to be caused by spontaneous shifts in host immunity.6 Because HIV-1 infection has a profound effect on the incidence and clinico–pathological features of other myco- bacterial diseases, such as tuberculosis, one might expect a significant interaction also to exist between HIV-1 and leprosy.7 In HIV-1/M. tuberculosis co-infections, immune suppression secondary to HIV-1 infection accelerates the progress of tuberculosis, and, conversely, the cellular immune activation associated with tuberculosis is associ- ated with more rapid progression of HIV-1 disease.8,9 In the setting of HIV-1/M. leprae co-infections, there has been a general expectation that immune deficiency caused by HIV-1 infection would shift the spectrum of leprosy towards the lepromatous (Th2) pole, although epidemio- logical data are sparse and conflicting.10 Paradoxically, the most detailed description of leprosy immunopathology in HIV-1 co-infected patients revealed no change in immune cell infiltrates across the leprosy spectrum, despite advanced HIV-1-associated immune deficiency.7,11 On the other hand, there has been little or no attempt to evaluate the impact of M. leprae infection on HIV-1 pathogenesis. This interaction has been studied in the macaque/simian immunodeficiency virus (SIV) model, however, where M. leprae infection was observed to exert an unexpected and unexplained ameliorating effect on SIV disease, pro- longing survival of the animals, despite equal or increased viral burdens.12 In light of these various reported interactions of myco- bacterial infections with HIV and SIV pathogenesis, we were interested in investigating whether human M. leprae co-infection might exacerbate or attenuate HIV-1 patho- genesis. As an initial exploration of these questions, we performed a cross-sectional analysis of immune cellu- lar parameters in blood cells from relatively rare HIV-1 and M. leprae co-infected subjects, in comparison with HIV-1 and M. leprae mono-infected subjects, and healthy volunteers. Our investigation focused on peripheral blood immune cells that are known to be altered in HIV-1 disease and that are implicated in the immunity and/or pathogenesis of mycobacterial infections, including leprosy. Thus, in addition to CD4 and CD8 T-cell subsets, we examined the two main subsets of cd T cells: Vd2 cells and Vd1 cells. Vd2 cells are stimulated by isoprenoid phosphoantigens that are present in bacteria, including mycobacteria.13 This population of cells plays a role in antimycobacterial defense,14,15 but the cell population shrinks dramatically during acute HIV-1 infection, with variable recovery following antiviral chemotherapy.16,17 In contrast, the Vd1 population, of unknown function, expands during HIV-1 infection, so that the ratios of Vd1 to Vd2 T cells are increased with progressive HIV-1 infec- tion.16,17 We also examined the two main subsets of peripheral blood dendritic cells (DC), called plasmacytoid and myeloid DC. DC are key components of the innate immune system, acting as antigen-presenting cells that are essential for the priming and regulation of T-cell immu- nity. Hence, the responses and interactions of these popu- lations of DC are thought to determine whether T cells differentiate into Th1 or Th2 cells,18 spanning the range of phenotypes observed in leprosy. Mycobacteria are known to stimulate DC via toll-like receptors (TLR) pres- ent on both myeloid (TLR2) and plasmacytoid (TLR9) subsets.19–21 Both subsets of DC can be infected by HIV-1, but a differential and striking loss of peripheral blood plasmacytoid DC characterizes progressive HIV-1 dis- ease.22 In light of the complex and contrasting effects of HIV-1 and mycobacterial infections on cd T-cell and DC populations, we were interested in examining these immune cells in patients with HIV-1 and M. leprae co-infections. Materials and methods Subjects and sample collection This study was reviewed and approved by the local institu- tional review board (IRB, Comiteˆ de E´tica em Pesquisa Humana da Universidade Federal de Sa˜o Paulo/UNIFESP), and IRB-approved informed consent was obtained from all participants. Leprosy patients were treated according to World Health Organization guidelines.23 Acquired immu- nodeficiency syndrome (AIDS) was defined using modified criteria adopted by the Brazilian Ministry of Health that includes patients with a CD4 cell count of < 200 cells/ll or clinical conditions related to AIDS.24 Seven healthy controls and seven HIV-seropositive patients, most of whom had CD4+ T-cell counts of < 400 cells/ll, were identified at UNIFESP. Seven patients with leprosy were enrolled at the Leprosy Clinic at the State Health Department (Sao Paulo, Brazil) and were classified according to their bacillary load.25 Seven patients co-infected with leprosy and HIV-1 infection were recruited at UNIFESP, using local identification and refer- ral from other services in Sao Paulo. Leprosy patients were matched for bacillary load with the patients in the co-infected group. In this study, the major presentations Ó 2008 The Authors Journal compilation Ó 2008 Blackwell Publishing Ltd, Immunology, 124, 206–214 207 Immunity in M. leprae and HIV-1 co-infection
  • 3. of leprosy were the paucibacillary form rather than the multibacillary form. The HIV mono-infected and co-infected patients were receiving highly active antiretroviral therapy (HAART) and multidrug therapy (MDT). Patients with immune reconstitution inflammatory syndrome were not included in the present study to avoid potential interference in the immune parameters, as described in different mycobacte- rial diseases.26–28 Peripheral blood mononuclear cells (PBMC) were iso- lated from the study subjects by density-gradient sedi- mentation over Ficoll–Paque (Pharmacia Biotech, Uppsala, Sweden). The isolated PBMC were then washed twice in Hank’s balanced salt solution (Gibco, Grand Island, NY). Cells were cryopreserved in RPMI 1640 (Gibco), supplemented with 20% heat-inactivated fetal bovine serum (FBS; HyClone Laboratories, Logan, UT), 50 U/ml of penicillin (Gibco), 50 lg/ml of streptomycin (Gibco), 10 mM glutamine (Gibco) and 7Á5% dimethyl sulphoxide (DMSO; Sigma, St Louis, MO). Cryopre- served cells were stored in liquid nitrogen until used in the assays. At the time of the assay, PBMC were rapidly thawed in a 37° water bath and washed in RPMI 1640 supplemented with 10% fetal calf serum, 100 U/ml of penicillin, 100 lg/ml of streptomycin and 20 mM glutamine (R10). Cells were counted, checked for viabil- ity and resuspended in R10 at a concentration of 106 cells/ml. Plasma HIV-1 RNA detection The plasma HIV RNA detection load was assessed using the ultrasensitive AMPLICOR HIV-1 MONITOR test ver- sion 1.5 (Roche Diagnostics, Indianapolis, IN), according to the manufacturer’s instructions. Flow cytometry The following monoclonal antibodies were used for surface staining: CD3–allophycocyanin (APC) (clone UCHT1), CD8–allophycocyanin carbocyanin 7 (APC- Cy7) (clone SK1), Vd2–phycoerythrin (PE) (cloneB6), CD45RA–peridin chlorophyll protein (PerCP) (clone HI 100), CCR7–phycoerithrin carbocyanin 7 (PeCY7) (clone 3D12) and CD69–fluorescein isothiocyanate (FITC) (clone FN50), from BD PharMingen (San Jose, CA); CD4–Alexa 610 (clone S3.5) from Caltag Laboratories (Burlingame, CA); Vd1–FITC (clone T58.2) from Endo- gen (Rockford, IL); Lineage Cocktail 1 (Lin 1: CD3, CD14, CD16, CD19, CD20 and CD56) FITC, human leucocyte antigen (HLA)-DR–PerCP (clone L243), CD11c–APC (clone S-HCL3), CD123–PE [anti-interleukin (IL)-3 receptor], CD38–PE (clone HB7), CD4–FITC (clone L120), from BD Biosciences (San Jose, CA); and CD25– PE–CY7 (clone BC96), from e-Bioscience, (San Diego, CA). Intracellular staining for cytokines was performed using mouse anti-human IL-4–PE (clone 3010.211), mouse anti-human interferon (IFN)-c–PE–CY7 (clone B27) and mouse anti-human tumour necrosis factor (TNF)-a–APC (clone Mab11), all from BD PharMingen. Fluoresce minus one (FMO) was used for gate strategy.29 In some experiments, thawed PBMC were incubated in 24-well plates (1 ml/well) (Becton Dickinson, San Jose, CA) in the presence of 1 lM ionomycin (Sigma) and 20 ng/ml of phorbol 12-myristate 13-acetate (PMA; Sigma), for 16 hr. After stimulation, cells were centrifuged at 1500 g for 5 min and transferred into V-bottom 96-well plates (Nunc, Roskilde, Denmark) in 100 ll of staining buffer [phosphate-buffered saline (PBS) supple- mented with 0Á1% sodium azide (Sigma) and 1% FBS, pH 7Á4–7Á6] with the panel of surface monoclonal anti- bodies. Cells were incubated at 4° in darkness for 30 min, washed twice and then resuspended in 100 ll of fixation buffer [1% paraformaldehyde (Polysciences, Warrington, PA) in PBS, pH 7Á4–7Á6]. Intracellular staining was performed after surface stain- ing with CD4–FITC, CD3–PerCP and CD8–APC–CY7. Cells were incubated with 100 ll of 4% fixation buffer and washed with permeabilization buffer (PBS supple- mented with 0Á1% sodium azide, 1% FBS and 0Á1% sapo- nin; Sigma). Each sample was resuspended in 100 ll of permeabilization buffer, incubated for 15 min at room temperature in the dark, washed with 100 ll of staining buffer and incubated for 30 min at 4° in the dark with either no antibody (unstained tube) or anti-IL-4–PE, anti- IFN-c–PE–CY7 and anti-TNF-a–APC in 50 ll of staining buffer.30 Cells were washed with 200 ll of staining buffer and resuspended in 100 ll of 1% paraformaldehyde (PFA) for flow cytometry analysis. Samples were acquired on a FACSCanto or FACSAria, using FACSDIVA software (BD Biosciences), and the analysed with FLOWJO software (Tree Star, San Carlo, CA). Fluorescence voltages were deter- mined using matched unstained cells. Compensation was carried out using CompBeads (BD Biosciences) single- stained with CD3–PerCP, CD4–FITC, CD8–APC–CY7, CD4–PE–CY7, CD3–PE or CD3–APC. Samples were acquired until at least 200 000 events in a live lymphocyte gate or at least 500 000 events in a live DC gate were obtained. Statistical analyses Groups were compared using non-parametric models; data are reported as median and interquartile range. Comparisons among groups were carried out using the Kruskall–Wallis non-parametric test, followed by inter- group comparisons by the Dunnet test. Correlations were performed using the Spearman non-parametric test. P-values were considered significant if <0Á05. Results are expressed in medians and interquartile ranges (IQR). 208 Ó 2008 The Authors Journal compilation Ó 2008 Blackwell Publishing Ltd, Immunology, 124, 206–214 K. I. Carvalho et al.
  • 4. Results Characteristics of the HIV-1-M. leprae co-infected patients Demographic, clinical, microbiological and laboratory characteristics are detailed in Table 1. The median ages of all participants was 38 years (IQR: 35–48) and most were male (83Á9%). No difference in gender distribution was observed between groups. For the leprosy and co- infected groups, 80% of the patients had a paucibacil- lary presentation at the time of diagnosis. Co-infected patients were treated with the appropriate MDT for paucibacillary and multibacillary leprosy. Median CD4+ T-cell counts in both HIV-infected groups were matched (949 cells/ll, IQR 727Á5–1465 for controls; 297 cells/ll, IQR 265–410 for HIV-infected patients; and 236 cells/ll, IQR 161–390 for co-infected patients Table 1). Leprosy and HIV-1 infections lead to marked disturbances of T-lymphocyte distribution The CD4 : CD8 T-cell ratio was decreased in both HIV-1- infected groups, but more in co-infected patients compared with controls (0Á16, IQR 0Á09–0Á20; and 1Á30, IQR 0Á95–1Á9, respectively, P < 0Á001, Fig. 1a). Although not statistically significant, co-infected patients exhibited lower CD4 : CD8 ratios than HIV-1 mono- infected subjects, suggesting more severe immunopathol- ogy in the former group, despite similar CD4+ T-cell counts (Fig. 1a). Table 1. Demographic, clinical and laboratory characteristics of participants Case numbers1 Groups Gender Age (years) Leprosy clinical presentation Bacillary index Leprosy therapy (months of MDT) Viral load (HIV-RNA copies/ml) CD4+ T cells/ mm3 HIV therapy 102 Control Male 29 – – – – 1358 – 103 Control Female 47 – – – – 1695 – 104 Control Male 40 – – – – 742 – 105 Control Male 34 – – – – 774 – 106 Control Male 49 – – – – 1084 – 110 Control Male 54 – – – – 661 – 113 Control Female 51 – – – – 949 – 128 Control Male 37 – – – – 1571 – 131 Control Male 38 – – – – 713 – 142 Control Male 49 – – – – 980 – 1001 HIV Male 37 – – – <399 405 HAART 1004 HIV Male 34 – – – 925 503 HAART 1020 HIV Male 33 – – – <399 410 HAART 1039 HIV Male 35 – – – 200 170 HAART 1050 HIV Male 51 – – – <399 265 HAART 2008 HIV Male 38 – – – <399 275 HAART 2011 HIV Male 38 – – – 762 297 HAART 1 HIV-Leprosy Male 38 BL 2+ 10 <399 161 HAART 2 HIV-Leprosy Male 38 BT Negative 12 <399 269 HAART 3 HIV-Leprosy Male 31 BT 1+ 8 <399 235 HAART 4 HIV-Leprosy Female 51 BL 1+ 12 <399 390 HAART 5 HIV-Leprosy Male 35 BT Negative 12 7220 127 HAART 6 HIV-Leprosy Male 53 BT Negative 2 <399 236 HAART 7 HIV-Leprosy Male 47 BT 1+ 5 <399 481 HAART 10 Leprosy Male 38 LL 3+ 20 – ND 11 Leprosy Male 43 TT Negative 4 – ND 12 Leprosy Male 37 BT Negative 7 – ND 13 Leprosy Male 33 BT Negative 5 – ND 14 Leprosy Male 48 LL 3+ 23 – ND 15 Leprosy Female 31 BL 1+ 14 – ND 16 Leprosy Male 39 LL 3+ 22 – ND BL, borderline-lepromatous; BT, borderline-tuberculoid; HAART, highly active antiretroviral therapy; HIV, human immunodeficiency virus; LL, lepromatous-lepromatous; MDT, multidrug therapy; ND, not done; TT, tuberculoid. 1 Case numbers reflect the enrollment sequences only within each individual group. Ó 2008 The Authors Journal compilation Ó 2008 Blackwell Publishing Ltd, Immunology, 124, 206–214 209 Immunity in M. leprae and HIV-1 co-infection
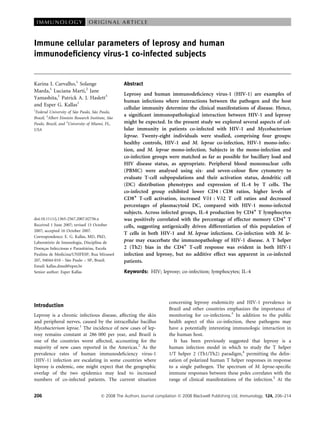
  • 5. Surface activation markers were evaluated in all four groups. Marked HLA-DR up-regulation on CD8+ T cells was observed in both HIV/M. leprae co-infected and HIV mono-infected groups compared with controls [mean flu- orescence intensities of 165 (IQR 94–271), 134 (IQR 114– 249) and 46 (IQR 21–68), respectively, P < 0Á05, Fig. 1b], but this was not seen in CD4+ T cells. There was a non- significant trend towards increased HLA-DR expression in the co-infected compared with the HIV-1 mono-infected group (Fig. 1b). No differences were observed in the expression of CD69, CD25 and CD38 on CD4+ and CD8+ T lymphocytes (data not shown). Dendritic cells and Vd2 T lymphocytes are proportionately diminished in co-infected patients The Vd2 T-cell subset was decreased in the co-infection group when compared with the control group (median 1Á53%, IQR 0Á73–2Á4, P < 0Á05), whereas the percentage of Vd1 T cells was similar in all groups. There was a sta- tistically significant overall difference in the Vd1 : Vd2 cell ratio, exaggeratedly inverted in the co-infected group compared with subjects infected with HIV-1 only (co-infection, 30Á3%, IQR 9Á9–35Á7; HIV, 5Á9%, IQR 3Á8– 13Á7; controls, 0Á63%, IQR 0Á25–3Á1; and leprosy, 2Á86%, IQR 0Á44–10Á84, P < 0Á05, Fig. 1c). The percentages of plasmacytoid DC in total PBMC were diminished in co-infected patients when compared with controls (co-infected, 0Á01%, IQR 0Á005–0Á02; HIV, 0Á02%, IQR 0Á005–0Á18; control, 0Á13%, IQR 0Á09–0Á18; and leprosy, 0Á03%, IQR 0Á0–0Á15, P < 0Á05, Fig. 1d). On the other hand, no significant differences in the percentages of myeloid DC were observed (data not shown). HIV-1 and leprosy drives the maturation of T lymphocytes CD4+ T cells were stained for surface expression of CD45RA and CCR7. Phenotypic nomenclature was based on that proposed by Sallusto et al., where CCR7+ CD45RA+ are described as naı¨ve cells, CCR7+ CD45RA) as central memory cells and CCR7) CD45RA) as effector memory cells 31 . Control subjects had higher percentages of naı¨ve and central memory cells compared with the other groups, with a corresponding decrease in the pro- portion of effector memory cells (Fig. 2). The most pro- nounced difference in these maturation subsets was seen when control subjects were compared with leprosy patients (CCR7+ CD45RA+ naı¨ve: 5Á47%, IQR 1Á66–18Á2 for controls and 0Á56%, IQR 0Á22–1Á84 for leprosy; CCR7+ CD45RA) central memory: 33Á8%, IQR 28Á1–35Á7 for controls and 15Á05%, IQR 8Á6–22 for leprosy; CCR7) CD45RA) effector: 49Á9%, IQR 47Á6–64 for con- trols and 82Á6%, IQR 75Á15–87Á3 for leprosy). For CD8+ T-cell subsets, the only statistically significant difference was observed when comparing central memory CCR7+ CD45RA) cells from control subjects (17Á7%, IQR 13Á15– 30) with co-infected (4Á28%, IQR 2Á63–13Á2) and leprosy (5Á67%, IQR 4Á79–10Á45) patients. Both pathogens tend to direct the immune response towards IL-4 production Next, we assessed cytokine production after PMA and ionomycin stimulation. No differences were observed in the production of TNF-a and IFN-c between CD4+ and CD8+ T lymphocytes. On the other hand, IL-4 produc- tion, determined by high expression of IL-4 in gated Control HIV HIV–leprosy Leprosy 0·0 0·5 1·0 1·5 2·0 2·5(a) (b) (c) (d) CD4:CD8ratioVδ1:Vδ2ratio PlasmocytoidDC(%)HLA-DRMFI P < 0·01 Control HIV HIV–leprosy Leprosy 0 100 200 300 400 500 P < 0·01 Control HIV HIV–leprosy Leprosy 0 10 20 30 40 50 60 70 P < 0·01 Control HIV HIV–leprosyLeprosy 0·0 0·1 0·2 0·3 0·4 0·5 0·6 0·7 P < 0·01 Figure 1. Several cellular immunological mark- ers obtained using flow cytometry were evalu- ated and compared among the four groups of volunteers. These markers comprised (a) the CD4 : CD8 ratio, (b) cellular activation of CD8+ T cells, measured by human leuco- cyte antigen (HLA)-DR expression, (c) the Vd1 : Vd2 ratio and (d) the percentage of plas- macytoid dendritic cells among total peripheral blood mononuclear cells (PBMC). Compari- sons were carried out using the Kruskal–Wallis non-parametric test followed by intergroup comparisons by the Dunnet test. HIV, human immunodeficiency virus; MFI, mean fluores- cence intensity. 210 Ó 2008 The Authors Journal compilation Ó 2008 Blackwell Publishing Ltd, Immunology, 124, 206–214 K. I. Carvalho et al.
  • 6. CD4+ T cells, was statistically lower in controls (0Á57%, IQR 0Á33–0Á93) when compared with the other three groups (1Á09%, IQR 0Á62–2Á85; P = 0Á03). No statistically Central memory Naïve Effector memory Control HIV HIV–leprosy Leprosy 0 10 20 30 40 P < 0·01 Control HIV HIV–leprosy Leprosy 0 10 20 (a) (b) (c) P < 0·01 Control HIV HIV–leprosy Leprosy 45 50 55 60 65 70 75 80 85 90 95 P < 0·01 CCR7+ CD45RA– %inCD4+ TcellsCCR7– CD45RA– %inCD4+ TcellsCCR7+ CD45RA+ %inCD4+ Tcells Figure 2. Distribution of cellular maturation markers of CD4+ T cells. Cellular subpopulations were determined by the expression of CCR7 and CD45RA after gating on CD3+ CD4+ cells. The percent- age of (a) naı¨ve (CCR7+ CD45RA+ ), (b) central memory (CCR7+ CD45RA) ) and (c) effector memory (CCR7) CD45RA) ) cells are depicted for all groups of subjects. HIV, human immunodeficiency virus. 0 5 10 15 20 25 30 35 40 0 1 2 3 4 5 6 7 (c) (b) (a) CD4 + TcellsproducingIL-4(%) r = –0·5861; P = 0·0003 30 40 50 60 70 80 90 100 CCR7 – CD45RA – among CD4 + T cells (%) CCR7 – CD45RA – among CD4 + T cells (%) 0 1 2 3 4 5 6 7 CD4 + TcellsproducingIL-4(%) r = 0·4791; P = 0·0041 Control Co-infected SSC IL-4 0 102 103 104 105 0 1000 2000 3000 4000 0·42% 0 102 103 104 105 4·25% Figure 3. Interleukin-4 (IL-4) production was determined by intra- cellular staining and flow cytometry after stimulation with iono- mycin and phorbol 12-myristate 13-acetate for 16 hr. (a) The IL-4+ gate was set for cells producing high levels of cytokine. The level of IL-4 production was negatively correlated with the percentage of central memory (CCR7+ CD45RA) ) CD4+ T cells (b) and positively correlated with effector memory (CCR7) CD45RA) ) CD4+ T cells (c). The results for all four study subject groups are shown: solid cir- cles, healthy controls; open circles, co-infection; open triangles, human immunodeficiency virus-1; open squares, leprosy. Correla- tions were assessed using the non-parametric Spearman’s test. SSC, side scatter. Ó 2008 The Authors Journal compilation Ó 2008 Blackwell Publishing Ltd, Immunology, 124, 206–214 211 Immunity in M. leprae and HIV-1 co-infection
  • 7. significant differences of cytokine production by CD8+ T cells were observed. The IL-4 production by CD4+ T lymphocytes was nega- tively correlated with the percentage of central memory cells (r = )0Á59, P < 0Á01) and positively correlated with the percentage of effector CD4+ T cells (r = 0Á48, P < 0Á01) (Fig. 3). As shown in Fig. 3, the frequency of IL-4+ T cells in control subjects clustered tightly, whereas those in the three infected groups were increased and in an overlapping distribution. Discussion There is considerable epidemiological overlap between M. tuberculosis and HIV epidemics, so that co-infections may be common in certain areas. In contrast, at present, rather distinct populations tend to be infected with M. leprae and HIV, so co-infections are much less com- mon. However, future projections of spread of the HIV epidemic into areas with more prevalent M. leprae infec- tion may change the co-infection epidemiological char- acteristics. The importance of tuberculosis and HIV co-infection as a public health problem is obvious, but this is less clear for M. leprae and HIV co-infections.32,33 However, the special nature of M. leprae stimulates unique questions about the possible consequences of co-infection. Infection with M. leprae differs in several ways from that with M. tuberculosis – there is a much more gradual evolution of disease, a classic spectrum of clinical manifestations related to Th1 and Th2 responsive- ness by the host, often huge antigenic burdens that are slow to clear, and pathogenesis that is largely caused by spontaneous shifts in host immune responsiveness, result- ing in inflammatory lepra reactions. We set out to compare cellular immune parameters in HIV-1-infected patients with and without leprosy. A limitation of the present study was the small sample size, owing to the relative rarity of HIV-1/M. leprae co-in- fected patients. Moreover, the challenge of interpreting results from this cohort was compounded by the variabil- ity of HIV disease, according to stage of progression, superimposed on the spectral nature of leprosy. In an attempt to derive meaningful data from the present sample, we endeavoured to match HIV-1 and M. leprae co-infected patients with HIV-1 and M. leprae mono- infected subjects, for CD4 and bacillary index, respec- tively (Table 1). In the present study, we confirmed that leprosy mono-infection is associated with increased IL-4 produc- tion by CD4+ T cells (Fig. 3). A similar increase was observed in HIV-1 mono-infection, as has been reported by others,34 but no apparent additive or synergistic effect was seen in HIV-1/M. leprae co-infected patients. Our data suggest that leprosy co-infection may aggravate, rather than ameliorate, HIV pathogenesis, as indicated by the decreased ratio of CD4 : CD8 T cells, higher frequency of activated CD8+ T cells and loss of plasma- cytoid DC, all recognized features of progressive HIV-1 disease. This is in contrast to the observation of Gormus et al., who made the unexpected observation of SIV disease amelioration in the setting of experimental M. le- prae co-infection of rhesus macaques.12 In the latter studies, we speculate that the immunologic environment associated with a high M. leprae antigenic burden might have attenuated the immune activation-driven pathogen- esis of SIV disease. However, our data do not support the hypothesis that M. leprae co-infection can attenuate the immunopathogenesis of human HIV-1 disease. On the contrary, the results suggest that M. leprae co-infec- tion may exacerbate HIV-1 pathogenesis. Clearly, there are important differences between the macaque model system and natural human infections. Macaques are natural hosts of neither M. leprae nor SIV, and the ani- mals were infected with a large intravenous inoculum of bacilli. Perhaps most importantly, no inflammatory man- ifestations of leprosy were described in the experimental animals. On the other hand, inflammatory lepra reactions can complicate up to half of human cases of leprosy, and this immunopathology may indeed account for much of the nerve damage and morbidity of this disease. Cutaneous and systemic expression of pro- inflammatory cytokines, such as TNF-a, have been extensively documented in lepra reactions35,36 and may be expected to promote HIV-1 replication. Indeed, cyto- kine-driven enhancement of viral replication has been invoked to explain the aggravation of HIV-1 disease in patients with concurrent tuberculosis.37 Thus, in HIV-1/ M. leprae co-infection, inflammation associated with clinical or subclinical lepra reactions may offset the potential for any beneficial immune-modulatory effects of M. leprae on HIV-1 disease progression. Sallusto et al. described that immunological memory is displayed by distinct T-cell subsets: lymph node-homing CCR7+ CD45RA) (central memory T cells, TCM) and tis- sue-homing cells CCR7) CD45RA) (effector memory T cells, TEM).31 Our results suggest that leprosy patients have a decreased number of naı¨ve cells when compared with healthy controls, together with a decreased percent- age of TCM and an increased percentage of TEM, mostly in co-infected patients. We hypothesize that the imbalance in the percentage distribution seen in leprosy and co-infected patients reflects a switch from naı¨ve to memory CD4+ T lymphocytes, as a result of continuous antigenic stimulation and cellular activation, as also seen in the context of tuberculosis.38 This finding may well represent a reactive expansion of ‘protective memory’ TEM cells in response to M. leprae and HIV as a result of differentiation of TCM to combat the pathogen, especially in the tissues, considering the high antigenic burden observed in both diseases.39 212 Ó 2008 The Authors Journal compilation Ó 2008 Blackwell Publishing Ltd, Immunology, 124, 206–214 K. I. Carvalho et al.
  • 8. Curiously, a positive correlation was observed between the proportional expansion of circulating TEM CD4+ T cells and the percentage of IL-4+ -producing CD4+ T cells after stimulation with PMA and ionomycin (Fig. 3b). Although our analysis did not permit us to ascertain directly whether TEM are actually the producers of IL-4, it is likely that these Th2-differentiated cells are indeed anti- gen-experienced members of the CD4+ TEM population. This interpretation is consistent with previous reports of higher IL-4 production in the context of M. leprae40,41 and HIV-142 infections. As increased frequencies of these cells were observed in chronic HIV-1 and/or M. leprae infections, there is clearly an association between IL-4 production and the presence of antigen. However, our approach did not address the antigen specificity of the IL-4-producing T cells. Others have demonstrated expres- sion of Th2 cytokines in leprosy lesions,35,40,43 which may represent antigen-driven or cytokine-driven expansion of M. leprae-specific T cells.44 These responses may be influ- enced by the genetic background of the individual as well as by environmental factors.44 We suggest that the contin- uing production of IL-4 by HIV-1 and M. leprae-specific T cells may create a ‘Th2 environment’ in which the priming of T cells to heterologous antigens is biased towards IL-4 production.45 Exploring the association of higher IL-4 production after PMA and ionomycin stimu- lation, and expansion of TEM, may present an opportu- nity to elucidate the mechanisms involved in the possibly deleterious effect of M. leprae infection in HIV-1-infected patients observed in our study. In conclusion, this initial exploration of the cellular immune interactions of leprosy and HIV-1 disease sug- gests that chronic infection with M. leprae might exacer- bate the immunopathogenesis of HIV-1 disease. We speculate that this may be the result of a combination of inflammatory lepra reactions and the aggravated Th2 environment induced by M. leprae antigens. Prospective longitudinal studies are needed to address the questions raised in this work. Acknowledgements This work was partially supported by Fundac¸a˜o Paulista contra a Hansenı´ase, National Institutes of Health, grant #R01-AI052731-06, and The Fogarty International Center, grant #D43 TW00003; KCS’s PhD scholarship was pro- vided by the Conselho Nacional de Desenvolvimento Cientı´fico e Tecnolo´gico (CNPq), Brazilian Ministry of Science and Technology. We are also thankful for support from the Heiser Program for Research in Leprosy and Tuberculosis of The New York Community Trust. Conflicts of interests The authors declare no competing conflicts of interests. References 1 Lockwood DN, Kumar B. Treatment of leprosy. BMJ 2004; 328:1447–8. 2 Meima A, Smith WC, van Oortmarssen GJ, Richardus JH, Habbema JD. The future incidence of leprosy: a scenario analy- sis. Bull World Health Organ 2004; 82:373–80. 3 Pereira GA, Stefani MM, Araujo Filho JA, Souza LC, Stefani GP, Martelli CM. Human immunodeficiency virus type 1 (HIV-1) and Mycobacterium leprae co-infection: HIV-1 subtypes and clin- ical, immunologic, and histopathologic profiles in a Brazilian cohort. Am J Trop Med Hyg 2004; 71:679–84. 4 Mosmann TR, Cherwinski H, Bond MW, Giedlin MA, Coffman RL. Two types of murine helper T cell clone. I. Definition according to profiles of lymphokine activities and secreted pro- teins. J Immunol 1986; 136:2348–57. 5 Modlin RL. Th1-Th2 paradigm: insights from leprosy. J Invest Dermatol 1994; 102:828–32. 6 Bloom BR. Learning from leprosy: a perspective on immunology and the Third World. J Immunol 1986; 137:i–x. 7 Ustianowski AP, Lawn SD, Lockwood DN. Interactions between HIV infection and leprosy: a paradox. Lancet Infect Dis 2006; 6:350–60. 8 Toossi Z, Mayanja-Kizza H, Hirsch CS et al. Impact of tubercu- losis (TB) on HIV-1 activity in dually infected patients. Clin Exp Immunol 2001; 123:233–8. 9 Whalen C, Horsburgh CR, Hom D, Lahart C, Simberkoff M, Ellner J. Accelerated course of human immunodeficiency virus infection after tuberculosis. Am J Respir Crit Care Med 1995; 151:129–35. 10 Nath I, Vemuri N, Reddi AL, Jain S, Brooks P, Colston MJ, Misra RS, Ramesh V. The effect of antigen presenting cells on the cytokine profiles of stable and reactional lepromatous lep- rosy patients. Immunol Lett 2000; 75:69–76. 11 Sampaio EP, Caneshi JR, Nery JA et al. Cellular immune response to Mycobacterium leprae infection in human immuno- deficiency virus-infected individuals. Infect Immun 1995; 63:1848–54. 12 Gormus BJ, Murphey-Corb M, Baskin GB, Uherka K, Martin LN, Marx PA, Xu K, Ratterree MS. Interactions between Myco- bacterium leprae and simian immunodeficiency virus (SIV) in rhesus monkeys. J Med Primatol 2000; 29:259–67. 13 Eberl M, Hintz M, Reichenberg A, Kollas AK, Wiesner J, Jomaa H. Microbial isoprenoid biosynthesis and human gammadelta T cell activation. FEBS Lett 2003; 544:4–10. 14 Barnes PF, Grisso CL, Abrams JS, Band H, Rea TH, Modlin RL. Gamma delta T lymphocytes in human tuberculosis. J Infect Dis 1992; 165:506–12. 15 Fujita M, Miyachi Y, Nakata K, Imamura S. Appearance of gamma delta T cell receptor-positive cells following alpha beta T cell receptor-positive cells in the lepromin reaction of human skin. Immunol Lett 1993; 35:39–44. 16 Poccia F, Gougeon ML, Agrati C et al. Innate T-cell immunity in HIV infection: the role of Vgamma9Vdelta2 T lymphocytes. Curr Mol Med 2002; 2:769–81. 17 Poles MA, Barsoum S, Yu W et al. Human immunodeficiency virus type 1 induces persistent changes in mucosal and blood gammadelta T cells despite suppressive therapy. J Virol 2003; 77:10456–67. Ó 2008 The Authors Journal compilation Ó 2008 Blackwell Publishing Ltd, Immunology, 124, 206–214 213 Immunity in M. leprae and HIV-1 co-infection
  • 9. 18 Pulendran B. Modulating TH1/TH2 responses with microbes, dendritic cells, and pathogen recognition receptors. Immunol Res 2004; 29:187–96. 19 Kadowaki N, Ho S, Antonenko S, Malefyt RW, Kastelein RA, Bazan F, Liu YJ. Subsets of human dendritic cell precursors express different toll-like receptors and respond to different microbial antigens. J Exp Med 2001; 194:863–9. 20 Krutzik SR, Ochoa MT, Sieling PA et al. Activation and regula- tion of Toll-like receptors 2 and 1 in human leprosy. Nat Med 2003; 9:525–32. 21 Bafica A, Scanga CA, Feng CG, Leifer C, Cheever A, Sher A. TLR9 regulates Th1 responses and cooperates with TLR2 in mediating optimal resistance to Mycobacterium tuberculosis. J Exp Med 2005; 202:1715–24. 22 Levy JA, Scott I, Mackewicz C. Protection from HIV/AIDS: the importance of innate immunity. Clin Immunol 2003; 108:167– 74. 23 Organizaton WH. Chemotherapy of leprosy for control pro- gramme, report of WHO study group. WHO TechRepSer 1982; 675:1–33. 24 Sau´de MD. Recomendac¸o˜es para Terapia Anti-Retroviral em Adul- tos e Adolescentes Infectados pelo HIV. Brası´lia-DF: Ministe´rio da Sau´de, 2006:1–85. 25 Ridley DS, Jopling WH. Classification of leprosy according to immunity. A five-group system. Int J Lepr Other Mycobact Dis 1966; 34:255–73. 26 Hirsch HH, Kaufmann G, Sendi P, Battegay M. Immune recon- stitution in HIV-infected patients. Clin Infect Dis 2004; 38:1159– 66. 27 Goebel FD. Immune reconstitution inflammatory syndrome (IRIS) – another new disease entity following treatment initia- tion of HIV infection. Infection 2005; 33:43–5. 28 Couppie P, Abel S, Voinchet H, Roussel M, Helenon R, Huerre M, Sainte-Marie D, Cabie A. Immune reconstitution inflamma- tory syndrome associated with HIV and leprosy. Arch Dermatol 2004; 140:997–1000. 29 Roederer M. Spectral compensation for flow cytometry: visuali- zation artifacts, limitations, and caveats. Cytometry 2001; 45:194– 205. 30 Kallas EG, Gibbons DC, Soucier H, Fitzgerald T, Treanor JJ, Evans TG. Detection of intracellular antigen-specific cytokines in human T cell populations. J Infect Dis 1999; 179:1124–31. 31 Sallusto F, Lenig D, Forster R, Lipp M, Lanzavecchia A. Two subsets of memory T lymphocytes with distinct homing poten- tials and effector functions. Nature 1999; 401:708–12. 32 Stenger S, Modlin RL. T cell mediated immunity to Mycobacte- rium tuberculosis. Curr Opin Microbiol 1999; 2:89–93. 33 Antas PR, Sales JS, Pereira KC, Oliveira EB, Cunha KS, Sarno EN, Sampaio EP. Patterns of intracellular cytokines in CD4 and CD8 T cells from patients with mycobacterial infections. Braz J Med Biol Res 2004; 37:1119–29. 34 Sousa AE, Chaves AF, Doroana M, Antunes F, Victorino RM. Bulk cytokine production versus frequency of cytokine-produc- ing cells in HIV1 infection before and during HAART. Clin Immunol 2000; 97:162–70. 35 Yamamura M, Wang XH, Ohmen JD, Uyemura K, Rea TH, Bloom BR, Modlin RL. Cytokine patterns of immunologically mediated tissue damage. J Immunol 1992; 149:1470–5. 36 Barnes PF, Abrams JS, Lu S, Sieling PA, Rea TH, Modlin RL. Patterns of cytokine production by mycobacterium-reactive human T-cell clones. Infect Immun 1993; 61:197–203. 37 de Castro Cunha RM, Kallas EG, Rodrigues DS, Nascimento Burattini M, Salomao R. Interferon-gamma and tumour necrosis factor-alpha production by CD4+ T and CD8+ T lymphocytes in AIDS patients with tuberculosis. Clin Exp Immunol 2005; 140:491–7. 38 Rodrigues DS, Medeiros EA, Weckx LY, Bonnez W, Salomao R, Kallas EG. Immunophenotypic characterization of peripheral T lymphocytes in Mycobacterium tuberculosis infection and dis- ease. Clin Exp Immunol 2002; 128:149–54. 39 Sallusto F, Geginat J, Lanzavecchia A. Central memory and effector memory T cell subsets: function, generation, and main- tenance. Annu Rev Immunol 2004; 22:745–63. 40 Yamamura M, Uyemura K, Deans RJ, Weinberg K, Rea TH, Bloom BR, Modlin RL. Defining protective responses to patho- gens: cytokine profiles in leprosy lesions. Science 1991; 254:277– 9. 41 Salgame P, Abrams JS, Clayberger C, Goldstein H, Convit J, Modlin RL, Bloom BR. Differing lymphokine profiles of func- tional subsets of human CD4 and CD8 T cell clones. Science 1991; 254:279–82. 42 Galli G, Annunziato F, Mavilia C et al. Enhanced HIV expres- sion during Th2-oriented responses explained by the opposite regulatory effect of IL-4 and IFN-gamma of fusin/CXCR4. Eur J Immunol 1998; 28:3280–90. 43 Sieling PA, Abrams JS, Yamamura M, Salgame P, Bloom BR, Rea TH, Modlin RL. Immunosuppressive roles for IL-10 and IL-4 in human infection. In vitro modulation of T cell responses in leprosy. J Immunol 1993; 150:5501–10. 44 Mitra DK, De Rosa SC, Luke A et al. Differential representations of memory T cell subsets are characteristic of polarized immu- nity in leprosy and atopic diseases. Int Immunol 1999; 11:1801– 10. 45 Stutz A, Graf P, Beinhauer B, Hammerschmid F, Neumann C, Woisetschlager M, Jung T. CD45 isoform expression is associ- ated with different susceptibilities of human naive and effector CD4+ T cells to respond to IL-4. Eur J Immunol 2005; 35:575– 83. 214 Ó 2008 The Authors Journal compilation Ó 2008 Blackwell Publishing Ltd, Immunology, 124, 206–214 K. I. Carvalho et al.