
Recommended
Recommended
More Related Content
Similar to All the charts like these need to be in the appendix!APPENDIX.docx
Similar to All the charts like these need to be in the appendix!APPENDIX.docx (20)
More from nettletondevon
More from nettletondevon (20)
Recently uploaded
Recently uploaded (20)
All the charts like these need to be in the appendix!APPENDIX.docx
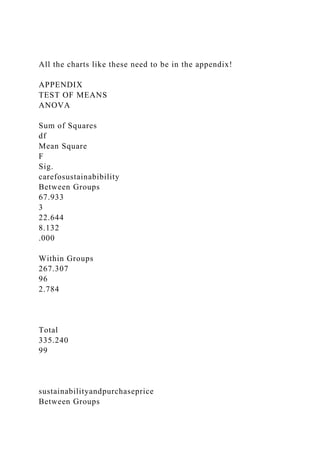
- 1. All the charts like these need to be in the appendix! APPENDIX TEST OF MEANS ANOVA Sum of Squares df Mean Square F Sig. carefosustainabibility Between Groups 67.933 3 22.644 8.132 .000 Within Groups 267.307 96 2.784 Total 335.240 99 sustainabilityandpurchaseprice Between Groups
- 2. 70.030 3 23.343 8.818 .000 Within Groups 254.130 96 2.647 Total 324.160 99 sustainabilefashionawareness Between Groups 129.927 3 43.309 18.071 .000 Within Groups 230.073 96 2.397 Total 360.000
- 3. 99 productionprocessawareness Between Groups 85.591 3 28.530 11.902 .000 Within Groups 230.119 96 2.397 Total 315.710 99 careforsustainablefashion Between Groups 94.141 3 31.380 14.315 .000 Within Groups 210.449 96
- 4. 2.192 Total 304.590 99 ennvironmentalconcern Between Groups 128.793 3 42.931 13.548 .000 Within Groups 304.197 96 3.169 Total 432.990 99 spendinglimit Between Groups 60.032 3 20.011
- 5. 12.333 .000 Within Groups 155.758 96 1.622 Total 215.790 99 variables Between Groups 82.100 3 27.367 17.439 .000 Within Groups 150.650 96 1.569 Total 232.750 99
- 6. locationofshopping Between Groups 134.788 3 44.929 22.468 .000 Within Groups 191.972 96 2.000 Total 326.760 99 buyingdecisions Between Groups 79.543 3 26.514 7.637 .000 Within Groups 333.297 96 3.472
- 7. Total 412.840 99 importanceofsustainablemindset Between Groups 88.662 3 29.554 18.149 .000 Within Groups 156.328 96 1.628 Total 244.990 99 age Between Groups .272 3 .091 1.566 .203
- 8. Within Groups 5.568 96 .058 Total 5.840 99 Frequency shoppingfrequency Frequency Percent Valid Percent Cumulative Percent Valid Every 6 Months 28 28.0 28.0 28.0
- 10. 37.0 Monthly 27 27.0 27.0 64.0 Every 6 Months 28 28.0 28.0 92.0 Yearly 8 8.0 8.0 100.0 Total 100 100.0 100.0 carefosustainabibility Frequency Percent Valid Percent Cumulative Percent Valid strongly disagree 7 7.0
- 11. 7.0 7.0 disagree 5 5.0 5.0 12.0 somewhat disagree 13 13.0 13.0 25.0 neutral 20 20.0 20.0 45.0 somewhat agree 17 17.0 17.0 62.0 agree 13 13.0 13.0 75.0 strongly agree 25 25.0
- 12. 25.0 100.0 Total 100 100.0 100.0 productionprocessawareness Frequency Percent Valid Percent Cumulative Percent Valid strongly unaware 17 17.0 17.0 17.0 unaware 23 23.0 23.0 40.0 somewhat unaware 27 27.0 27.0 67.0 nuetral
- 13. 8 8.0 8.0 75.0 somewhat aware 9 9.0 9.0 84.0 aware 10 10.0 10.0 94.0 strongly aware 6 6.0 6.0 100.0 Total 100 100.0 100.0 spendinglimit Frequency Percent Valid Percent Cumulative Percent
- 17. 21 21.0 21.0 21.0 Online Stores 10 10.0 10.0 31.0 Swap Meet 6 6.0 6.0 37.0 thrift stores 4 4.0 4.0 41.0 Both a - b 47 47.0 47.0 88.0 all of the above 12 12.0 12.0 100.0 Total
- 18. 100 100.0 100.0 importanceofsustainablemindset Frequency Percent Valid Percent Cumulative Percent Valid strongly disagree 5 5.0 5.0 5.0 disagree 7 7.0 7.0 12.0 somewhat disagree 11 11.0 11.0 23.0 nuetral 24 24.0 24.0 47.0
- 19. somewhat agree 29 29.0 29.0 76.0 agree 12 12.0 12.0 88.0 strongly agree 12 12.0 12.0 100.0 Total 100 100.0 100.0 variables Frequency Percent Valid Percent Cumulative Percent Valid price 35 35.0
- 20. 35.0 35.0 Quality 20 20.0 20.0 55.0 Eithically Sourced 18 18.0 18.0 73.0 Comfort 15 15.0 15.0 88.0 Durability 6 6.0 6.0 94.0 how it fits 6 6.0 6.0 100.0 Total 100 100.0
- 21. 100.0 sustainabilefashionawareness Frequency Percent Valid Percent Cumulative Percent Valid strongly disagree 8 8.0 8.0 8.0 disagree 18 18.0 18.0 26.0 somewhat disagree 18 18.0 18.0 44.0 neutral 20 20.0 20.0 64.0 somewhat disagree 12
- 22. 12.0 12.0 76.0 agree 6 6.0 6.0 82.0 strongly disagree 18 18.0 18.0 100.0 Total 100 100.0 100.0 buyingdecisions Frequency Percent Valid Percent Cumulative Percent Valid strongly disagree 24 24.0 24.0 24.0
- 23. disagree 12 12.0 12.0 36.0 somewhat disagree 16 16.0 16.0 52.0 nuetral 15 15.0 15.0 67.0 somewhat agree 11 11.0 11.0 78.0 agree 11 11.0 11.0 89.0 strongly agree 11 11.0 11.0 100.0
- 24. Total 100 100.0 100.0 age Frequency Percent Valid Percent Cumulative Percent Valid under 18 1 1.0 1.0 1.0 18-25 94 94.0 94.0 95.0 25-35 5 5.0 5.0 100.0 Total 100 100.0 100.0
- 25. Here’s what where are doing The research question is We are trying to open a women clothing line in our store and conducted a servey to see what would happen This is the survey. You can see it in the SPSS file Thank you for your time! This is the Fqy column and so on 1. How many times do you shop for clothes per month? Weekly Monthly Every 6 months yearly 2. Do you care about the use of sustainable products? Strongly agree 1 2 3 4 5 6 7 Strongly Disagree 3. If you knew that your next product purchase was sustainable/ethically made, would you spend more money on it? Strongly agree 1 2 3 4 5 6 7 Strongly Disagree 4. What does the term “sustainable clothing” mean to you? _____________________________________________________ _________________
- 26. 5. How well do you know what sustainable fashion/clothing is? Strongly aware 1 2 3 4 5 6 7 Strongly Unaware 6. To what extent do you care about sustainable fashion? Strongly agree 1 2 3 4 5 6 7 Strongly Disagree 7. How well do you know how your clothes are made/processed? Strongly aware 1 2 3 4 5 6 7 Strongly Unaware 8. How much does the sustainability factor affect into your buying decisions? Strongly agree 1 2 3 4 5 6 7 Strongly Disagree 9. How important is the environment to you? Strongly agree 1 2 3 4 5 6 7 Strongly Disagree 10. Circle 2 variables that ultimately affect your clothing purchase a. Price b. Quality c. Ethically Sourced d. Comfort e. Durability f. How it fits
- 27. 11. How much do you usually spend on a high quality material T-Shirt? a. $ 20.00 - $25.00 b. $ 25.00 - $30.00 c. $ 30.00 - $35.00 d. $35.00 - $40.00 e. $40.00 - $45.00 f. $45.00 - $50.00 g. Other: $______ 12. Where do you usually buy your clothes? a. Shopping Mall b. Online Stores c. Swap Meet d. Thrift Stores e. Both a & b f. All of the above 13. How important is it to have an environmentally / sustainable mindset towards clothing? Strongly agree 1 2 3 4 5 6 7 Strongly Disagree 14. Have you heard of the clothing store: Industry of all nations? Strongly aware 1 2 3 4 5 6 7 Strongly Unaware 15. Are you? Male Female 16. How old are you? a. Under 18 b. 18 – 25 c. 25 – 35
- 28. d. 35 + This is the example that I want you to follow Data analysis and findings A variety of statistical analyses were conducted to assess students attitudes and perspectives on whether or not offers enough healthy food options on campus. Our finding for each test are presented by first listing the null- hypothesis and alternative hypothesis, following by our data analysis. Per a cross-tabulation test (Figure A) we were able to identify what percentage of full-time and part-time students were considered healthy and unhealthy. Our results showed that out of the 98 full-time students only 74.5% are considered unhealthy while 25.5% are healthy. Of the six part-time students, 83.3% are unhealthy and 16.7% are healthy. Null Hypothesis5: There is no significant difference in the weekly average amount spend on campus meals between healthy and unhealthy students. Alternative-Hypothesis5: There is a significant difference in the weekly average amount spend on campus meals between healthy and unhealthy students. An Independent Sample T-test was used to compare the weekly average spending for healthy and unhealthy students. Looking at the means only [n = 104, Munhealthy = 3.52, Mhealthy = 2.92] the unhealthy students in the sample did spend more money on average (Table 1). However, the significance level [p = .609] (Table 1A) is greater than our confidence 95% or 0.05. The reason [p = .609] is due to the variance in the two groups. The
- 29. variance is also tested when using an independent sample t-test through “Lavene’s Test for Equality of Variance” where we have the following hypotheses: Null Hypothesis6: There is no significant difference in variance between healthy and unhealthy students in regards to current food expectations. Alternative-Hypothesis6: There is a significant difference in variance between healthy and unhealthy students in regards to current food expectations. The analysis of the variance showed a significance level higher than our 0.05 confidence level [p = .472], therefore, we fail to reject the null-hypothesis and assume the variance to be equal. In other words, it is the significant level .609 that will tell us whether the weekly average spending difference is of significance. That is, with 95% confidence there is no significant difference in the weekly average amount spend on campus meals between healthy and unhealthy students. Null Hypothesis7: There is no difference in the current food expectation-level between healthy and unhealthy students. Alternative-Hypothesis7: There is a significant difference in the current food expectation-level between healthy and unhealthy students. An Independent Sample T-test was used to compare the means of the expectation level with current food options between healthy and unhealthy students. Looking at the means only [n = 104, Munhealthy = 5.53, Mhealthy = 5.54] the unhealthy students in the sample did, on average, feel that the current food options met their expectations (Table 2). However, the significance level [p = .977] (Table 2A) is greater than our confidence 95% or 0.05. The reason [p = .977] is due to the variance in the two groups. The “Lavene’s Test for Equality of Variance” tested the variance between the two groups where we had the following hypotheses: Null Hypothesis8: There is no significant difference in variance between healthy and unhealthy students in regards to current
- 30. food expectations. Alternative-Hypothesis8: There is a significant difference in variance between healthy and unhealthy students in regards to current food expectations. “Lavene’s Test for Equality of Variance” we got a significance of [p = 0.025], which is lower than our confidence-level of 0.05 or 95%. Therefore, we reject the null-hypothesis and read the independent sample t-test based upon the variances not being equal. This means that the significance we interpret to see if there is a difference in food expectations is [p = .977]. Here, our p-value is more than our confidence level of 0.05; therefore, we fail to reject the null-hypothesis, and can with 95% confidence say that, there is no significant difference in the current food expectation-level between healthy and unhealthy students.