LAND-USE/ LAND-COVER CLASSIFICATION USING GIS AND REMOTE SENSING- PUNE CITY
•
1 like•88 views

LAND-USE/ LAND-COVER CLASSIFICATION USING GIS AND REMOTE SENSING- PUNE CITY
Recommended

Recommended
More Related Content
What's hot
What's hot (18)
Similar to LAND-USE/ LAND-COVER CLASSIFICATION USING GIS AND REMOTE SENSING- PUNE CITY
Similar to LAND-USE/ LAND-COVER CLASSIFICATION USING GIS AND REMOTE SENSING- PUNE CITY (20)
More from Neha Bansal
More from Neha Bansal (20)
Recently uploaded
Recently uploaded (20)
LAND-USE/ LAND-COVER CLASSIFICATION USING GIS AND REMOTE SENSING- PUNE CITY
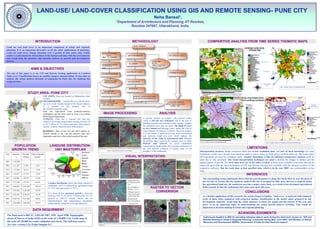
- 1. Interpretation accuracy &data extraction affect due to low resolution data, and lack of local knowledge are some limitations, as this was a project work taken up under a course, hence no field survey could be taken up. The master plan/ SOI toposheets are used for validation check. Another limitations is that no statistical comparative analysis could be done due to time constraint. The visual interpretation techniques are used to identify the change in landuse and the spatial pattern of growth. The work done here are on the older versions as these were available at that time and can be improved upon with the latest techniques of GIS and Remote Sensing now available with the advance versions of the respective softwares. But the work done at that specified time, which is in the year 2003, was commendable at that time. LAND-USE/ LAND-COVER CLASSIFICATION USING GIS AND REMOTE SENSING- PUNE CITY Neha Bansal1, 1Department of Architecture and Planning, IIT Roorkee, Roorkee 247667, Uttarakhand, India. Authors are thankful to IIRS for providing reference data to work during the short term course on “GIS and Remote Sensing in Urban & Regional Planning” conducted during May- June 2003, and Ministry of Human Resource and Development (MHRD), Government of India for their financial support. As a further application of this research, the actual change in landuse / land cover is analyzed with temporal series of data, when compared with projected landuse classification in the master plans prepared by the development authority would help the urban planners to know the spatial growth pattern of the area and prove to be an important input in understanding the urban growth pattern variables. This would be important in decision making in urban and regional planning. INTRODUCTION METHODOLOGY CONCLUSIONS INFERENCES Land use and land cover is an important component of urban and regional planning. It is an important derivative in all the other applications of planning. Land use land cover change detection over a period of time series data would enable to understand the interactions of the human activities with the environment and would help the planners and decision makers in growth and development process. ACKNOWLEDGMENTS: STUDY AREA- PUNE CITY Year Populatio n Decadal variation %age of decadal growth 1891 1,18,790 -- -- 1901 1,11,341 -7,359 -6.91 1911 1,17,456 +6,115 +5.49 1921 1,33,227 +15,771 +13.42 1931 1,62,001 +28,774 +21.60 1941 2,37,546 +75,545 +46.63 1951 4,80,942 +2,43,396 +102.56 1961 5,95,562 +1,16,620 +24.24 1971 8,56,105 +2,58,543 +43.20 1981 12,03,351 +3,47,246 +40.56 1991 15,64,000 +3,60,649 +29.97 The Data used is IRS 1C, LIIS-III 1987, 1991, April 1998, Topographic sheets of Survey of India (SOI) at the scale of 1:50,000, City Guide map at the scale of1:20,000 for result validation and check. The Software used is Arc view version 3.2a, Erdas Imagine 8.1. DATA REQUIRMENT IMAGE PROCESSING RASTER TO VECTOR CONVERSION COMPARITIVE ANALYSIS FROM TIME SERIES THEMATIC MAPS River.shp agricultural lan barrage commercial contonment dense settlement dried water body gaonthon hilly area industry institute org-open space others public space railway lines recreation river stream settlement sparce settlemen vacant land vegetation village settleme Waterbodies.shp 10 0 10 Kilometers N E W S Landuse/ Land cover of Pune City Clip1.shp agri/vege builtup commercial hilly area industry others public space recreation/open river stream vacant land Roads-1.shp major road minor roads rly track Waterbodies.shp Rivers.shp Commercial.shp 3 0 3 Kilometer N E W S New Settlement New Public spaces Settlement growth direction New Settlement Figure . Landuse / land cover Classification in 1991 Back-ground.shp City.shp Roads-1.shp major road minor roads rly track Waterbodies.shp Rivers.shp Surround_settlement.shp 3 0 3 Kilome N E W S New Settlement New Settlement New Settlement Settlement growth direction Settlement growth direction Figure 9. Landuse / land cover Change Detection and Growth Direction River.shp agricultural lan barrage commercial contonment dense settlement dried water body gaonthon hilly area industry institute org-open space others public space railway lines recreation river stream settlement sparce settlemen vacant land vegetation village settleme City.shp Waterbodies.shp Rivers.shp Roads-1.shp major road minor roads rly track 5 0 5 10 Kilometers N E W S Pune City Extent & Its Surrounding Landuses New Settlements New Settlement Settlement growth direction Figure 8. Landuse / land cover Classification in 1998 Figure 5. Different land uses and land cover as identified are indicated in series of images here Figure 3. Satellite Image of Pune city and surrounding area Figure 4. Vectorisation process is indicated here VISUAL INTERPRETATION Figure 2. Image enhancement done in Erdas Imagine ANALYSIS The surrounding urban settlements shows that the growth pattern is along the North West & west direction of the city due to reasons like the southern south of the city is occupied by hilly area, the west is majorly under the agricultural land use, the southwest area has a major water body, as a result it has developed agricultural fields around, & thus the settlements have also come up in this area. LIMITATIONS A spectral analysis of imagery -The spectral colour varies in old and new settlement, due to the type of building materials and also due to their ageing; brighter the settlement areas, they are newer. The depth of water in river channel and drainage varies, darker the color of water channel, the deeper it would be. Since the imagery is of the month of april, most of the crops are matured and represent bright red color which indicate the maturity of the crops in agricultural field. Whereas the pinkish shade represent the younger crops on field. Planned road network are easily identifiable represented by bright shade, due to greater reflectance of the road material compared to kuchta roads on the periphery of the settlements. The aim of this paper is to use GIS and Remote Sensing application in Landuse /land cover Classification based on satellite imagery interpretation. It also aims to analyze the urban pattern &trends of expansion in Pune city, by studying the temporal data. AIMS & OBJECTIVES LOCATION: Pune city located in Maharashtra State of India. PHYSIOGRAPHIC : located 560 m (1,840 ft) above sea level on the western margin of the Deccan plateau. It is situated on the leeward side of the Sahyadri mountain range. Pune has experienced some moderate-intensity earthquakes and has been rated in Zone 4, by Indian Metrological Department. CLIMATE: Pune has a tropical wet and dry climate with average temperatures ranging between 20 to 28 °C (68 to 82 °F). Pune experiences three distinct seasons: summer, monsoon and a mild autumn. RAINFALL: Most of the 722 mm (28.4 inches) of Annual rainfall in the city fall between June and September, and July is the wettest month of the year. public 2.76 industrial 1.68 office 0.29 commercial 1.62 residential 36.27 others 0.74 hilly area 5.24 defence 5.21 agriculture 17.74 utilities 1.08 transport 11.61 open-spaces 12.76 residential commercial office industrial public utilities transport open-spaces defence agriculture hilly area others POPULATION GROWTH TREND LANDUSE DISTRIBUTION- 1991 MASTERPLAN Landuse distribution shows that major landuse is residential 36.27 % followed by agricultural land 17.74 % and open spaces 12.76 %. It is observed that maximum growth is observed between 1941-51 of 102.56 % followed by 43.2 % growth in 1961-71 decade mainly due to industrialization after independence, population settled mainly along the rivers and industries. Figure . Landuse / land cover Classification in 1989