SlideShare a Scribd company logo
1 of 9
Download to read offline
Measuring the variations in regional milk supply and the lack of response to the national income over feed cost margins specified by 2014 Farm Bill
JAERD
Measuring the variations in regional milk supply and
the lack of response to the national income over feed
cost margins specified by 2014 Farm Bill
Maryfrances Miller
Texas A&M University-Commerce, P.O. Box 3011, Commerce, Texas 75429, USA.
Email: frannie.miller@tamuc.edu
The 2014 Farm Bill changed dairy policy from a price floor and counter-cyclical payment plan to
a federal insurance program for income over feed cost margins. Milk production response to
low margin periods between 2000 and 2012 is evaluated by region of the country. No evidence
was found of production response from eastern and mid-western dairies to low margin periods.
Only slight response was evident in western regions. Although current federal expenditures
under the program have been limited by low participation beyond the catastrophic-insurance
level, the negligible production response during low margin periods may have significant policy
ramifications in coming years. The lack of a short-term corrective mechanism in milk markets
continues to be an issue.
Keywords: Dairy, agricultural policy, Margin Protection Program-Dairy, 2014 Farm Bill, margins
INTRODUCTION
The 2014 U.S. Farm Bill dramatically changed dairy
policy. It provides an insurance program, known as
Margin Protection Program (MPP)-Dairy, for dairy
farmers to insure an Income Over Feed Cost (IOFC)
margin on a percentage of their milk production. The
IOFC margins are defined as the difference between the
price of a hundred pounds of milk and the price of a
specified dairy feed ration. When this margin falls below
the insured level, direct indemnity payments will be made
to farmers to make up the difference on covered milk
production (Bozic, 2013).The program has been
described as a way to move away from the straight
subsidies of the past and toward a concept that requires
a more active risk management role by farmers.
The motivation to change dairy policy was largely
a result of the disastrous price environment for dairy
farmers that occurred in 2009. Using the equation
specified in the 2014 Farm Bill for calculating IOFC
margins, they averaged $12 per hundredweight in 2007,
hitting record high in August at $14.65 per hundredweight
in August. A year later, in August 2008, margins had
fallen to $7.69 per hundredweight of milk, a drop of
almost 48 percent. In the next 10 months, they continued
to slide another 71 percent, hitting a low of $2.25 per
hundred weights in June 2009. Even as profitability
decreased sharply, milk production increased. As
margins plunged, milk production began its annual spring
upswing, and prices were pushed lower. Consensus
formed around the idea that policy could no longer be tied
to only the revenue from milk, instead it needed to focus
on the margin of milk over feed prices.
In the past, the safety net for the United States
dairy industry was provided through the Milk Income Loss
Contract (MILC). This program created under the 2002
Farm Bill, formally known as the Farm Security and Rural
Investment Act of 2002. Under the MILC program,
benefits were limited by production caps. This meant
dairy regions with higher percentages of small farms
Journal of Agricultural Economics and Rural Development
Vol. 3(2), pp. 130-138, January, 2017. © www.premierpublishers.org, ISSN: 2167-
0477
Research Article
Measuring the variations in regional milk supply and the lack of response to the national income over feed cost margins specified by 2014 Farm Bill
Miller M. 131
received disproportionally larger shares of MILC, and
regions characterized by larger farms received less in
federal benefits, proportional to actual milk production
(Chang, 2011). Under the new MPP-Dairy program,
benefits received will be a function of milk production and
the individual farmer’s choices of participation in the
program. Accordingly, benefits to larger farms are now
expected to increase.
The complications and difficulties associated with
dairy policy are often blamed on the highly perishable
nature of fluid milk. But, a significant portion of the
difficulty of regulating milk markets is geographical in
nature. This research focuses on regional imbalances
that may occur as part of the new policy. Specifically, the
focus here is to compare and contrast the response to
low IOFC margin periods from region to region.
The slow response of milk production to milk
price has been investigated by Chavas and Klemme
(1986), and recently by Bozic et al. (2011). Chavas and
Klemme developed a model that incorporated cow
biology into their model of supply elasticity. Bozic et al.
modified this approach and used a mixed frequency
model, which combined quarterly yield data with annual
herd and heifer numbers. In the period from 1975 to
2005, they found a declining trend in long-run supply
responsiveness. However, while milk was becoming less
own-price elastic, it was becoming more responsive to
feed costs (Bozic et al., 2011).
Chavas et al. (1990), and Wee sink and Howard
(1990), both investigated how own-price elasticity differed
regionally. Chavas et al. (1990) was motivated by
dramatic westward shifts in the geography of milk
production. California had gone from producing 5.1
percent of the nation’s milk in 1950 to 12 percent in 1987.
This trend has continued. In 2012, California production
had grown to 20.9 percent of national milk production
(National Agricultural Statistics Service, 2013).For own-
price supply elasticity in the very short-run, they found
milk supply Elasticities ranged from a low of 0.015 in the
New England region to a high of 0.110 in the East South
Central region. At twenty years, the variation was
phenomenal; the Pacific region had an elasticity of 9.843,
while the South Atlantic remained inelastic at 0.527 even
in this time horizon. The Pacific region appeared to have
more flexibility and responsiveness to feed cost,
slaughter price, and slightly more than other regions for
risk, as well (Chavas et al., 1990).Wee sink and Howard
(1990) evaluated the regional response to a change in
the US dairy policy that lowered milk support prices
between 1950 and 1986 and found considerable regional
variation in response to price changes. They found that
realignment of dairy production from a drop in federal
milk support prices would be largely born by the Midwest.
Wee sink and Tauer (1990) focused on how technical
changes would change regional production shares in
response to changes in dairy policy. All of the work
comparing regional elasticity to date focused on the dairy
industry prior to 1990. In 1990, Dairy Product Price
Support Program was reduced to $10.10 per
hundredweight, effectively changing it to a non-binding
price floor and allowing dairy prices to become
increasingly volatile (Blayney, 2002).
Bryant, Outlaw and Anderson (2007) investigated
the supply response to the MILC program. They avoided
the complexities of a dynamic programming approach in
favor of a partial adjustment model of the long-run
equilibrium. Using their model, they estimated the speed
of adjustment to equilibrium levels in response to a
sustained change in supply determinant as 10.5 years
Bryant et al. (2007).
The partial adjustment model used by Bryant,
Outlaw and Anderson (2007) is modified and used to
evaluate the response of regional milk production, not to
the price of milk, but to the low margin periods as defined
by the 2014 Farm Bill. A time series model is used to
compare the response of milk production within each
region to the low margin periods on which the new farm
bill is focused. This is used to investigate the regional
aggregate milk production response to the IOFC national
margin, as it is specified in the farm bill.
Milk prices fluctuate from region to region with
local market conditions, so do feed costs. Alfalfa hay,
which constitutes the forage portion of the ration, is not
even grown or widely fed in a number of states. However,
the program will be conducted using the national price for
both feed and milk, so the response in output to these
national prices will drive program expenditures and
efficacy. The variation in regional prices means that a
farm’s individual margin is not what is insured. The farm
is insured only for deterioration of the national margin.
This creates something analogous to a basis risk for
traditional risk management approaches. Instead of
measuring a region’s response to the actual prices
received and paid within the region, which is not what the
program covers, here the regional output response to
national average prices is measured, which is what the
program covers. Previous work on supply elasticity has
either measured national response to national prices or
regional response to regional prices.
MATERIALS AND METHODS
Historic price information for milk, corn, soybean
meal, and alfalfa hay is used to calculate national IOFC
margins as directed under the Dairy subtitle of the 2014
Farm Bill. Margins are calculated for the period from
January 2000 through December 2012. Milk production
response is measured at quarterly intervals so that data
from each of the 48 contiguous states is included. The
Measuring the variations in regional milk supply and the lack of response to the national income over feed cost margins specified by 2014 Farm Bill
J Agric. Econ. Rural Devel. 132
Table 1. Application of margin calculations to historical
price information from 2000 to 2013.
Margin
Level
Two-
month
periods
Quarterly
periods
Separate
events
$8.00 33 20 7
7.50 223 15 5
7.00 18 11 4
6.50 12 9 4
6.00 10 6 3
5.50 7 5 2
5.00 7 5 2
4.50 6 5 2
4.00 6 4 2
legislation allows for indemnity payments to be made
when margins drop for two consecutive months, but
monthly data is not available for states that are not major
dairy production states, so quarterly data was used. It is
important to note that this is a slight variation from the
specifics of the enacted legislation. The number of
periods when a margin payment would have been made
is shown in table 1. A dummy variable was created to
indicate quarters for which the average margin was below
a $7.00 per hundredweight margin (LOW). The number of
low margin periods for each trigger value is shown in
Table 1. The four periods included for a $7.00 margin
trigger, which was the focus of the analysis, are: a) the
third quarter of 2002, lasting one year through the second
quarter of 2003, with an average margin during the period
of $6.24per hundredweight; b) the second quarter of
2006, lasting one quarter, with an average margin of
$6.82per hundredweight; c) the second quarter of 2009,
lasting three quarters through third quarter of 2009, with
an average margin of $3.57per hundredweight; and d)
the first quarter of 2012, lasting three quarters through
third quarter of 2012, when the average margin was
$4.53per hundredweight. Table 1 shows the number of
periods for which indemnity payments would have
occurred between 2000and 2013, using the margin
calculation specified under the new program. Because
quarterly data is used here, the number of quarterly
average margin levels below each level is also
presented. The number of events refers to the number of
contiguous periods below a given margin level.
A partial adjustment specification is used to
evaluate how aggregate regional output grows or
declines in relation to national IOFC margins (Bryant et
al., 2007, 138). Paralleling the analysis in Bryant et al.
(2007), the long-run equilibrium level of dairy production
desired at time t is posited as:
*
it t itQ X    (1)
The production by region is assumed to evolve according
to the adjustment process shown in equation 2 using as
the adjustment parameter.
*
, 1 , 1(1 )( )it i t t it i t tQ Q Q Q       (2)
Equation 1 is substituted into equation 2 and solved for
itQ . 𝛽is substituted for 𝛽 1 − 𝛾 and 𝜇 is substituted
for 𝜇 1 − 𝛾 . Solving for itQ leaves:
*
, 1it t it i t tQ X Q Q      (3)
It is assumed that 0 << 1, that quantity of milk
does not adjust to equilibrium levels instantaneously. For
each region t indicates the speed of adjustment. This
incorporates the behavior of producers who adjust their
output when they realize that
*
1t tQ Q but weigh the
benefits of producing at the optimum against the costs of
adjusting feed, yield, and eventually herd size (Bryant et
al., 2007).
The model is specified using equation 4, with
LOW used as a dummy variable to indicate low margin
periods, M indicating the IOFC margin level, S as the
slaughter price of cull cattle, Y as the yield per cow, and
D denoting the three quarterly dummy variables.
0 1 2 3 4 5
6 , 1,2...,6 7 1 8 2 9 3
t t t t t it
i t
Q LOW M LOW M S Y
Q D D D
     
   
       
  
(4)
Measuring the variations in regional milk supply and the lack of response to the national income over feed cost margins specified by 2014 Farm Bill
Miller M. 133
According to economic theory, the coefficient for
tM should be positive, as IOFC margins increase,
production should respond accordingly. Likewise, the
coefficient for the dummy variable indicating periods of
low margins, tLOW , should be negative, as these
periods should be characterized by lower quantities of
milk supplied. The interaction term, t tLOW M is
included to test whether or not the sensitivity of output to
margins increases when those margins are low. This is
expected to be positive, if margins decline while they are
already low, output reductions are expected to
accelerate. Ceteris paribus, an increase in the price of
beef for culled cows should increase the culling rate and
decrease output of milk. Yield is expected to be positive
but small, an increase in yield would be expected to
increase milk production. However, according to a
Cornell Cooperative Extension publication on Dairy
Replacement Program Costs and Analysis created by
Jason Karszes in 1993, there was no statistically
significant relationship, in the New York farms he studied,
between culling rates and yield.
The coefficient for lagged production is expected
to be positive, higher output in the previous period is
likely to increase production in this period. Essentially,
the goal of dairy policy is to dampen this relationship
between what a farmer does today and yesterday and
instead increase the response to market conditions. Milk
production is highly seasonal so three quarterly dummy
variables are included. The fourth quarter is omitted and
captured in the intercept. The first and second quarter
coefficients should be positive as the “spring flush”
increases production, and the third quarter should be
negative as warm summers decrease feed consumption
and days in milk increase from slightly seasonal breeding
patterns.
Output in each region, itQ is modeled as the
dependent variable. Dummy variables for three quarters
are included to adjust for highly seasonal variation in
output. Time is t and i indicates the region of the country.
tX and  represent vectors of supply determinants and
their parameters. The random disturbance is captured by
t . The supply determinants included the IOFC margin,
t , are calculated from the price of corn, alfalfa, soybean
meal, and milk price as specified by the legislation. The
national price of beef from slaughtered cows, S, and yield
per cow, Y, for the regions also included as explanatory
variables.
Milk price over feed cost margins from time t
were used instead of time t-1 partially because of the
structure of milk payments to farmers. Farms receive
payment for milk shipped in June in July, so price data
from June is not realized on the farm until July.
Furthermore, a high number of farmers watch milk futures
prices, even if they do not actively hedge their production.
Data was obtained primarily from National Agricultural
Statistics Service (NASS) through the Quick stats feature.
State data for milk production was grouped into five
regions, using the regions defined by the Cooperatives
Working Together (CWT) program as shown in Figure 1.
As the name implies, this organization was formed
through the cooperation of thirty-five milk marketing
cooperatives and individual producers and is managed by
a non-profit organization, the National Milk Producers
Federation (NMPF).
Yield data for the region is estimated by
averaging the three months in each quarter for each of
the top 23 dairy states for which monthly data are
available. The shading in Figure 1 denotes when data
was available. The states with the darkest shading have
monthly data available throughout the time period.
Monthly data became available for Colorado, Kansas,
and Oregon beginning in 2003.Monthly data collection
ceased for Kentucky and began for Utah in 2008. The
average quarterly yield for these states is then used as
the estimate for the entire region. Because yield is largely
a function of geographic variables, like weather/climate
and related influences on feed, yield in neighboring dairy
states seemed to be a decent proxy. This is a better
approximation for region 3, which contains many of the
top 23 dairy states, and more problematic for region 2,
which only contains two states for which monthly data is
collected. Monthly data was not collected for March
through June of2013 due to the government shutdown,
so the series ends in 2012. Milk prices, corn prices, and
alfalfa prices were obtained from NASS, while soybean
meal prices were obtained from the Agricultural
Marketing Service (AMS). The calculations on milk over
feed margins were made in accordance with the formula
specified in the proposed legislation. The estimated feed
cost is given in equation 5 with the dollar symbols
denoting prices.
$Feed=1.0728$Corn+0.00735$SoybeanMeal+0.0137
$Alfalfa Hay (5)
Much of the previous literature, including Bryant
et al., used cow numbers as the dependent variable.
Here, milk production is used instead to enable a more
timely estimation of the response to the type of low
margin periods addressed in the farm bill. Cow numbers
are not used for a combination of reasons. There have
been major changes in dairy policy and geographic
structure of the industry since 2000, so it was important
to confine the time period to the recent past after those
changes (Miller and Blayney, 2006). Herd size
information is only available annually. Since the question
being researched is focused on responses to low margin
periods, which usually last less than a full year, this
makes annual cow numbers of little use to the question
Measuring the variations in regional milk supply and the lack of response to the national income over feed cost margins specified by 2014 Farm Bill
J. Agric. Econ. Rural Devel. 134
Figure 1. Regions are based on the grouping of states created by the Cooperatives Working
Together (CWT) program. Shaded states have monthly data available through USDA, which only
collects monthly data for top dairy production states. Monthly data collection ceased for Kentucky
and began for Utah in 2008. Monthly data became available for Colorado, Kansas, and Oregon
beginning in 2003.
posed. Chavas and Klemme found that the majority of
long run output adjustment comes from changes in herd
size, while changes in yield explain smaller changes in
the short-term (Chavas and Klemme, 1986). The
response being measured is only a measurement of the
change in output and does not attempt to distinguish
between which portion is obtained through changes in
regional herd size and which portion is from changes in
yield per cow. It is important to note that while changes in
yield are not as important to output response as changes
in cow numbers, year-over-year changes in the rate of
production per cow have raised production per head by
almost 20 percent just since 2000.
Because of the limited data range, and to include
in the discussion effects that are even weakly statistically
significant, an acceptable probability level for a Type I
error was set at 15 percent. In this case, a “finding of no
significance” is politically significant and could contribute
to greater federal outlays on this program than expected.
If there is no significant response in production to low
margin periods, the duration of the low margin periods
will be longer than if there was a reliable and significant
production response. Without a reliable drop in
production, the market correction that pushes margins
back up is delayed. Under the new program, the amount
of federal expenditure will depend on the duration of low
margin periods, as well as the actual margin deficiency.
Natural logarithms are used for each variable except the
dummy variables. Each variable was checked for
presence of a unit root, using the Augmented Dickey
Fuller test in E-views software. Production in region 1
was stationary and was modeled as the log of output.
Production in the other four regions, yield in each region,
and beef prices were modeled as a first difference to
achieve stationary. A step-wise approach was used to
determine the correct number of lags to include in each
region. The specification used a linear model with six lags
of the dependent variable. Breusch-Godfrey tests were
conducted for each regional equation to check for serial
correlation.
RESULTS
The results from model estimation are included in Table
2. The main variable of interest pursuant to the 2014
Farm Bill is the dummy variable for low margins. The
response in the West, region 5, was the only region with
a statistically significant response in milk production. It is
apparent that both the predictability of the response to
low margin periods, and the actual response in
production, increases as we move westward across the
country. In region 4, production during the periods when
margins dipped below $7.00 dropped by 4.8 percent. In
region5, production dropped by 5.9 percent during those
periods. Using 2012 average production, a 4.8percent
reduction in region 4 constitutes a drop of almost 4 million
pounds/day. In region 5, a 5.9percent drop is equivalent
to 10.8 million pounds of daily milk production.
Measuring the variations in regional milk supply and the lack of response to the national income over feed cost margins specified by 2014 Farm Bill
Miller M. 135
Table 2. Coefficients that are statistically significant at a 15 percent significance level are in bold. The adjusted R2 for each
equation is given at the bottom of the table. P-values are included below each coefficient.
Region 1 2 3 4 5
Intercept
P-value
1.566
0.39
0.071
0.43
-0.007
0.81
-0.015
0.71
-0.046
0.10
LOW 0.024
0.56
-0.006
0.91
0.014
0.66
-0.048
0.28
-0.059
0.05
Margin 0.011
0.42
-0.007
0.70
0.000
0.97
0.011
0.49
0.009
0.44
Margin -0.004
0.54
0.013
0.88
-0.010
0.56
0.028
0.23
0.031
0.05
Beef price -0.018
0.51
0.003
0.93
0.001
0.98
-0.070
0.05
0.000
0.97
Yieldi 0.039
0.42
0.058
0.67
0.145
0.08
0.234
0.04
-0.137
0.13
First Quarter 0.029
0.17
-0.024
0.78
0.011
0.57
0.039
0.24
0.062
0.00
Second Quarter 0.023
0.44
-0.001
0.99
0.038
0.08
0.046
0.16
0.078
0.00
Third Quarter -0.044
0.06
0.204
0.04
-0.005
0.76
-0.055
0.07
0.016
0.32
1.292
0.00
0.083
0.66
0.010
0.53
0.055
0.71
-0.041
0.79
-0.697
0.02
-0.238
0.23
-0.441
0.10
-0.132
0.43
-0.186
0.22
0.551
0.09
0.265
0.16
0.301
0.04
0.061
0.71
0.151
0.34
-0.354
0.27
-0.156
0.48
-0.038
0.83
-0.150
0.33
-0.112
0.48
0.052
0.86
0.078
0.69
-0.126
0.46
-0.154
0.26
-0.210
0.19
0.047
0.81
-0.121
0.55
0.002
0.99
-0.116
0.41
-0.029
0.86
R
2
0.89 0.98 0.98 0.94 0.88
The lack of a statistically significant effect in the
eastern regions for the low-margin dummy variable
demonstrates that there has been no reliable effect on
output resulting from periods when the national margin is
below $7.00. Technically, we fail to reject the null
hypothesis that this coefficient is equal to zero. This is
reinforced by a consistent result for the variable Margin.
In each region, there is no evidence that the coefficient
for the production response to the specified national
margin is different from zero. The p-value is greater than
0.40 for each region, and the coefficients are also quite
small.
The dummy variable for low margin periods was
interacted with the margin series to evaluate the
response in milk production to the IOFC margin
specifically during low margin periods. This was only
statistically significant in region 5. In region 4, the
coefficient for Margin is 0.011, but the coefficient for
Margin  LOW is 0.028. In region 5, the coefficient for
Margin is 0.009, but the coefficient for MarginLOW is
0.031. In the western regions, production increases are
much quicker to respond to drops or improvements in low
margins than in the rest of the United States. The
coefficient for beef prices was much greater than
expected, particularly in region 4. In region 4, the price of
beef for cull cows was significant, and the absolute size
of the coefficient was greater in absolute terms (-0.07)
than for any other variable across all regions except yield.
1tQ 
2tQ 
3tQ 
4tQ 
5tQ 
6tQ 
Measuring the variations in regional milk supply and the lack of response to the national income over feed cost margins specified by 2014 Farm Bill
J. Agric. Econ. Rural Devel. 136
Table 2. Output response to different levels of low margins. This table presents the
coefficient and p-value for regressions run in each region for the dummy variable for
low margins. LOW8 had a value of 1 if the observed average margin for a quarter fell
below $8.00 and so on for $7.00, $6.00, and $4.00 margins. P-values are included
below the coefficient.
Region 1 2 3 4 5
LOW$8.
00
0.031
0.41
-0.043
0.48
0.025
0.50
-0.009
0.85
-0.043
0.21
LOW$7.
00
0.024
0.56
-0.006
0.91
0.014
0.66
-0.048
0.28
-0.059
0.05
LOW$6.
00
0.049
0.26
0.500
0.43
0.039
0.45
-0.039
0.45
-0.029
0.40
LOW$4.
00
0.039
0.56
0.032
0.88
0.076
0.24
-0.030
0.73
-0.043
0.24
This seemed unlikely, since most other research
has found a quite limited reaction to changes in beef
prices. Furthermore, it seems implausible that output
decisions related to milk price over feed income would be
best explained by beef prices for cull cows. However, a
possible explanation for this result is the interaction of the
CWT program, which is used here to categorize the
regions, and beef prices. The CWT program was a
farmer-run, private organization that charged an
assessment on milk production of participating farmers.
Periodically, “herd retirement” programs were
conducted to reduce the supply of milk in the U.S.
Farmers submitted competitive bids and the program
would purchase the milk production history of farmers
whose bids were selected. If selected, a herd had to be
sold immediately for slaughter. The realized price to the
farmer for their herd was the combination of the milk
production history and the slaughter price for the cows.
Higher beef prices would allow a farmer to submit a lower
CWT herd retirement bid, increasing the odds of being
included in the program. This might amplify the
connection between beef prices and production
response. Furthermore, the largest two herd retirement
programs (of ten) were conducted during 2009 during
periods of low margins. The high level of participation in
herd retirements by region 4 and the higher level of
response of milk production to beef price supports this
notion.
Changes in yield were significant in regions 3, 4,
and 5. The ideal climate and the advances in dairy
infrastructure in region 5 is noticeable, the average
production per cow over the entire period is 17
pounds/day higher than in region 2. As region 4 has
grown insignificance to the dairy industry, yield per cow
has surpassed region 5 beginning around 2009. During
the low prices of2002-03, output per cow dropped and
eventually recovered. In 2009 and 2012, the response
was instead a slight increase in output per cow, although
it did begin to drop during the second quarter of 2012.
Since yield is calculated as total output in a state divided
by milking cows, this change in output per cow is, again,
likely a function of the CWT program on which the
regions are delineated. Participation in the CWT program
lowers the number of cows. The drop in production is
captured first in the monthly milk production survey, but
the cow numbers are only surveyed annually. It still
means there is a significant response captured through
this variable, but it is likely at least partially due to a
change in cow numbers and not entirely reflective of
changes in output per head. Another issue investigated
was how the output response varied with different levels
of low margin periods. The results are inconclusive, but
are shown in Table 3. The move from $8.00 margins to
$7.00 margins fits economic theory, as margins are
eroded, the output becomes more negative (or at least
less positive.) One possible explanation of the movement
in opposite direction in regions 1and 2 are that these
areas often sell heifers to other regions. During low
margin periods, the market for replacement heifers may
dry up, and farms in these regions possibly freshen a
larger percentage of heifers into their own herds. While
this is a possible explanation for the economic meaning
of the coefficients, the null hypothesis that these
coefficients are equal to zero cannot be rejected.
While the results for low margins are quite
inconclusive, under the new program actual margins for
participating farmers will be increased through indemnity
payments during low margin periods. The coefficients for
the move from $8.00 to $7.00 margins in table 5,
supports the likely economic result that this would reduce
the output response. However, the results from the
LOW$6.00
and LOW$4.00
coefficients contradict this.
Possibly, these periods are simply too short to allow a full
response in dairy production to be discerned or even
implemented at the farm. For instance, there are only four
quarters between 2000 and 20012 for which the average
margin is below $4.00. These periods occurred during the
first two quarters of 2009 and the second and third
quarters of 2012.
DISCUSSION
The regional variation in the response to low
margin periods has important political and industry
significance, but the results are hardly surprising.
Measuring the variations in regional milk supply and the lack of response to the national income over feed cost margins specified by 2014 Farm Bill
Miller M. 137
Previous research has supported the finding that regions
4 and 5 are much more elastic, both in response to milk
and to feed prices. The margin insurance program will
shift benefits towards the larger dairies more
characteristic of western states, allowing large dairies in
those regions more protection from low margins than
what was available under MILC. This aligns the farm
program more closely with the volume of milk production.
During the years investigated, the market
response to low margins has come from regions 4and 5
and no evidence could be found that dairies in the
eastern part of the country slow production in response to
low margins. Depending on participation choices, the two
western regions could potentially receive larger amounts
of federal assistance than what would have been
possible under previous policy, given the production caps
required by the MILC program. The results here show
that the only statistically significant response in milk
production to these extremely low margin periods occurs
in region 5. During the study period, this region was,
proportionate to milk production volume, less protected
from market fluctuations through MILC than other
regions. If the federal safety net provides a more even
level of protection from short-term disequilibrium, this
could easily dampen the supply reduction that normally
occurs from this region. If this occurs, the low margin
periods could become more protracted. The speed of
response to low margins is important because, in addition
to the farm-level losses, it will affect the cost of the
program for the federal government.
Admittedly, participation in the program has been
almost entirely limited to the catastrophic-level coverage
at $4.00. From calculations made from program
participation results provided by the USDA Farm Service
factsheet on the program, the percent of covered milk
production at this minimum level for each region for the
2016 year was:89.7percent of region 1 covered milk
production; 81.1 percent of region 2covered milk
production; 79.4 percent for region 3covered milk
production; 83.0 percent for region 4covered milk
production; and 95.8 percent for region 5. It appears that
only farms that purchased IOFC margin insurance for
$6.00 and higher will receive indemnity payments for
2016. Nationally, this is limited to only 10.3 percent of all
milk production covered in the program and to
approximately 9 percent of total US milk production
(using 2015 US annual milk production). However, the
margins of 2016 may have many farmers reconsidering
their choices of which margin level to insure. If farmer
participation in the program shifts to purchasing higher
IOFC margin insurance and markets continue to soften,
the federal outlays for this program could further
decrease milk supply elasticity. The lack of a short-term
correction mechanism that was sought by the industry
when the original legislation for the 2014 Farm Bill Dairy
subtitle was proposed is still a problem for the dairy
industry. The MPP-Dairy program could potentially
exacerbate this problem by dulling the production
response that has historically occurred in the western
states of region 5. At current participation levels, this is
not likely to be a problem, unless IOFC margin drops
occur similar to levels in 2009 or 2012.
ACKNOWLEDGEMENT
The author owned a dairy farm from April 2010 through
March 2016, and participated in the MPP-Dairy program.
While this experience provided intimate experience with
the frustration of farming during periods of low IOFC
margins, the sale of the cattle removed any potential
conflict of interest that could be imagined to arise from
research in aggregate production responses to dairy
policy.
REFERENCES
Adelaja A (1991). Price changes, supply elasticities,
industry organization, and dairy output distribution.
American Journal of Agricultural Economics73: 89-102.
ARMS Survey Data (2014).Milk production costs and
returns per hundredweight. USDA Online database.
Accessed July 2014.
Blaney DP (2002). The changing landscape of US milk
production. USDA Economic Research Service
Statistical Bulletin. Number 978. Washington D.C.
Bozic M, Cameron S, Thraen CS, Newton, J (2013).
Farm Bill dairy margin formula explained. World Dairy
Situation – supplemental resource. Accessed
September 30, 2014.
Bozic M, Kanter CA, Gould BW (2012). Tracing the
evolution of the aggregate U.S. milk supply elasticity
using a herd dynamics model. Agricultural
Economics.43: 515-530.
Bryant HL, Outlaw JL, Anderson, D (2007). Aggregate
milk supply response to the Milk Income Loss Contract
program. Journal of Agribusiness. 25: 133–146.
Chang HH, Mishra AK (2011). Does the Milk Income
Loss Contract program improve the technical efficiency
of US dairy farms? Journal of Dairy Science.94: 2945-
2951.
Chavas J, Klemme R (1986). Aggregate milk supply
response and investment behavior on U.S. dairy farms.
American Journal of Agricultural Economics 68: 55–66.
Chavas J, Kraus A, Jesse E (1990). A regional analysis
of milk supply response in the United States. North
Central Journal of Agricultural Economics.12: 149.
Edwards, Browne and Torah Montessori School v.
National Milk Producers Federation; Dairy Farmers of
America; Dairylea Cooperative; Land O’Lakes; Agri-
Mark, Inc. United States District Court – Northern
Measuring the variations in regional milk supply and the lack of response to the national income over feed cost margins specified by 2014 Farm Bill
J. Agric. Econ. Rural Devel. 138
District of California. Class Action Lawsuit. September
26, 2011.
Erba EM, Novakovic, AM (2005). The evolution of milk
pricing and government intervention in dairy
markets.Cornell Program on Dairy Markets and Policy.
Greene WH (1993). Econometric Analysis.2
nd
ed.
Macmillan Publishing Company. New York, NY.
Manchester A, Blayney DP (2001). Milk pricing in the
United States. USDA Economic Research Service
Agriculture Information Bulletin No. 761. Washington
D.C.
Miller JJ, Blayney DP (2006). Dairy backgrounder.
Online. Accessed November 28, 2013.
National Agricultural Statistics Service (2013).
USDA/National Agricultural Statistics Service Quick
Stats Database. Online database. Accessed July
2014.
Shields DA (2009). Dairy Pricing Issues. Congressional
Research Service. R40903.Washington D.C.
Shields DA (2010). Consolidation and concentration in
the US dairy industry. Congressional Research
Service. R41224.Washington D.C.
USDA Farm Service Agency 2014 Farm Bill – Fact Sheet
(2016).Margin Protection Program for Dairy. Website:
https://www.fsa.usda.gov/programs-and-services/Dairy-
MPP/index Accessed August 2016.
Weersink A, Howard W (1990) Regional adjustment
response in the US dairy sector to changes in milk
support price. Western Journal of Agricultural
Economics. 13-21.
Weersink A, Tauer LW (1990). Regional and temporal
impacts of technical change in the U.S. dairy sector.
American Journal of Agricultural Economics.72: 923–
934.

More Related Content

What's hot

Does Household Participation in Food Markets Increase Dietary Diversity? Evid...
Does Household Participation in Food Markets Increase Dietary Diversity? Evid...Does Household Participation in Food Markets Increase Dietary Diversity? Evid...
Does Household Participation in Food Markets Increase Dietary Diversity? Evid...IFPRIMaSSP
 
Productivity and Income SDGs 2.3.1 & 2.3.2_ENGLISH
Productivity and Income SDGs 2.3.1 & 2.3.2_ENGLISHProductivity and Income SDGs 2.3.1 & 2.3.2_ENGLISH
Productivity and Income SDGs 2.3.1 & 2.3.2_ENGLISHFAO
 
Farm Credit Canada - 2013 Farmland Values Report
Farm Credit Canada - 2013 Farmland Values ReportFarm Credit Canada - 2013 Farmland Values Report
Farm Credit Canada - 2013 Farmland Values ReportVeripath Partners
 
EPAR_UW_310_National-Level_Maize Yield Trends_5.31.16
EPAR_UW_310_National-Level_Maize Yield Trends_5.31.16EPAR_UW_310_National-Level_Maize Yield Trends_5.31.16
EPAR_UW_310_National-Level_Maize Yield Trends_5.31.16Claire Guilmette (Aylward)
 
Losses in Food Balance Sheets: Current Status, Imputation, ans SDG 12.3
Losses in Food Balance Sheets: Current Status, Imputation, ans SDG 12.3Losses in Food Balance Sheets: Current Status, Imputation, ans SDG 12.3
Losses in Food Balance Sheets: Current Status, Imputation, ans SDG 12.3FAO
 
Losses in Food Balance Sheets: Current Status, Imputation, and SDG 12.3
Losses in Food Balance Sheets: Current Status, Imputation, and SDG 12.3Losses in Food Balance Sheets: Current Status, Imputation, and SDG 12.3
Losses in Food Balance Sheets: Current Status, Imputation, and SDG 12.3FAO
 
Understanding the factors that influence cereal legume adoption amongst small...
Understanding the factors that influence cereal legume adoption amongst small...Understanding the factors that influence cereal legume adoption amongst small...
Understanding the factors that influence cereal legume adoption amongst small...Madalitso Hanjahanja Mondiwa
 
Food price inflation and consumer welfare in ghana
Food price inflation and consumer welfare in ghanaFood price inflation and consumer welfare in ghana
Food price inflation and consumer welfare in ghanananaeghan
 
FOOD BALANCE SHEETS (FBS) Lusaka, 12-16 November 2012
FOOD BALANCE SHEETS (FBS) Lusaka, 12-16 November 2012FOOD BALANCE SHEETS (FBS) Lusaka, 12-16 November 2012
FOOD BALANCE SHEETS (FBS) Lusaka, 12-16 November 2012FAO
 
TeamPaper - Chicken - Organic vs Traditional - Dec 2016
TeamPaper - Chicken - Organic vs Traditional - Dec 2016TeamPaper - Chicken - Organic vs Traditional - Dec 2016
TeamPaper - Chicken - Organic vs Traditional - Dec 2016Alex Sivo, MBA
 
Getting Down to Details: How to Use Velocity Reports to Up Your Game on Sourc...
Getting Down to Details: How to Use Velocity Reports to Up Your Game on Sourc...Getting Down to Details: How to Use Velocity Reports to Up Your Game on Sourc...
Getting Down to Details: How to Use Velocity Reports to Up Your Game on Sourc...Farm to Institution New England
 
The increasing costs of Animal Source Foods in Ethiopia: Evidence and Implica...
The increasing costs of Animal Source Foods in Ethiopia: Evidence and Implica...The increasing costs of Animal Source Foods in Ethiopia: Evidence and Implica...
The increasing costs of Animal Source Foods in Ethiopia: Evidence and Implica...essp2
 
Growing Local Resource Index January 2010 | American Farmland Trust
Growing Local Resource Index January 2010 | American Farmland Trust Growing Local Resource Index January 2010 | American Farmland Trust
Growing Local Resource Index January 2010 | American Farmland Trust American Farmland Trust
 
Do cash + interventions enable greater resilience and dietary diversity than ...
Do cash + interventions enable greater resilience and dietary diversity than ...Do cash + interventions enable greater resilience and dietary diversity than ...
Do cash + interventions enable greater resilience and dietary diversity than ...IFPRIMaSSP
 
Last but not least: The impact of the Farmer Input Subsidy Program on livesto...
Last but not least: The impact of the Farmer Input Subsidy Program on livesto...Last but not least: The impact of the Farmer Input Subsidy Program on livesto...
Last but not least: The impact of the Farmer Input Subsidy Program on livesto...IFPRIMaSSP
 

What's hot (19)

Does Household Participation in Food Markets Increase Dietary Diversity? Evid...
Does Household Participation in Food Markets Increase Dietary Diversity? Evid...Does Household Participation in Food Markets Increase Dietary Diversity? Evid...
Does Household Participation in Food Markets Increase Dietary Diversity? Evid...
 
Productivity and Income SDGs 2.3.1 & 2.3.2_ENGLISH
Productivity and Income SDGs 2.3.1 & 2.3.2_ENGLISHProductivity and Income SDGs 2.3.1 & 2.3.2_ENGLISH
Productivity and Income SDGs 2.3.1 & 2.3.2_ENGLISH
 
Farm Credit Canada - 2013 Farmland Values Report
Farm Credit Canada - 2013 Farmland Values ReportFarm Credit Canada - 2013 Farmland Values Report
Farm Credit Canada - 2013 Farmland Values Report
 
Febnews11
Febnews11Febnews11
Febnews11
 
EPAR_UW_310_National-Level_Maize Yield Trends_5.31.16
EPAR_UW_310_National-Level_Maize Yield Trends_5.31.16EPAR_UW_310_National-Level_Maize Yield Trends_5.31.16
EPAR_UW_310_National-Level_Maize Yield Trends_5.31.16
 
Losses in Food Balance Sheets: Current Status, Imputation, ans SDG 12.3
Losses in Food Balance Sheets: Current Status, Imputation, ans SDG 12.3Losses in Food Balance Sheets: Current Status, Imputation, ans SDG 12.3
Losses in Food Balance Sheets: Current Status, Imputation, ans SDG 12.3
 
Losses in Food Balance Sheets: Current Status, Imputation, and SDG 12.3
Losses in Food Balance Sheets: Current Status, Imputation, and SDG 12.3Losses in Food Balance Sheets: Current Status, Imputation, and SDG 12.3
Losses in Food Balance Sheets: Current Status, Imputation, and SDG 12.3
 
Understanding the factors that influence cereal legume adoption amongst small...
Understanding the factors that influence cereal legume adoption amongst small...Understanding the factors that influence cereal legume adoption amongst small...
Understanding the factors that influence cereal legume adoption amongst small...
 
Food price inflation and consumer welfare in ghana
Food price inflation and consumer welfare in ghanaFood price inflation and consumer welfare in ghana
Food price inflation and consumer welfare in ghana
 
FOOD BALANCE SHEETS (FBS) Lusaka, 12-16 November 2012
FOOD BALANCE SHEETS (FBS) Lusaka, 12-16 November 2012FOOD BALANCE SHEETS (FBS) Lusaka, 12-16 November 2012
FOOD BALANCE SHEETS (FBS) Lusaka, 12-16 November 2012
 
TeamPaper - Chicken - Organic vs Traditional - Dec 2016
TeamPaper - Chicken - Organic vs Traditional - Dec 2016TeamPaper - Chicken - Organic vs Traditional - Dec 2016
TeamPaper - Chicken - Organic vs Traditional - Dec 2016
 
Getting Down to Details: How to Use Velocity Reports to Up Your Game on Sourc...
Getting Down to Details: How to Use Velocity Reports to Up Your Game on Sourc...Getting Down to Details: How to Use Velocity Reports to Up Your Game on Sourc...
Getting Down to Details: How to Use Velocity Reports to Up Your Game on Sourc...
 
BEHAILU DEFENCE PPT (final 4)
BEHAILU DEFENCE PPT (final 4)BEHAILU DEFENCE PPT (final 4)
BEHAILU DEFENCE PPT (final 4)
 
The increasing costs of Animal Source Foods in Ethiopia: Evidence and Implica...
The increasing costs of Animal Source Foods in Ethiopia: Evidence and Implica...The increasing costs of Animal Source Foods in Ethiopia: Evidence and Implica...
The increasing costs of Animal Source Foods in Ethiopia: Evidence and Implica...
 
MTBiz August 2012
MTBiz August 2012 MTBiz August 2012
MTBiz August 2012
 
Growing Local Resource Index January 2010 | American Farmland Trust
Growing Local Resource Index January 2010 | American Farmland Trust Growing Local Resource Index January 2010 | American Farmland Trust
Growing Local Resource Index January 2010 | American Farmland Trust
 
Food Waste - Assessment USA
Food Waste - Assessment  USAFood Waste - Assessment  USA
Food Waste - Assessment USA
 
Do cash + interventions enable greater resilience and dietary diversity than ...
Do cash + interventions enable greater resilience and dietary diversity than ...Do cash + interventions enable greater resilience and dietary diversity than ...
Do cash + interventions enable greater resilience and dietary diversity than ...
 
Last but not least: The impact of the Farmer Input Subsidy Program on livesto...
Last but not least: The impact of the Farmer Input Subsidy Program on livesto...Last but not least: The impact of the Farmer Input Subsidy Program on livesto...
Last but not least: The impact of the Farmer Input Subsidy Program on livesto...
 

Similar to Measuring the variations in regional milk supply and the lack of response to the national income over feed cost margins specified by 2014 Farm Bill

Regional impacts of federal milk market policy alternatives
Regional impacts of federal milk market policy alternativesRegional impacts of federal milk market policy alternatives
Regional impacts of federal milk market policy alternativesProfitable Growth Services, LLC
 
Stability criterion of periodic oscillations in a (5)
Stability criterion of periodic oscillations in a (5)Stability criterion of periodic oscillations in a (5)
Stability criterion of periodic oscillations in a (5)Alexander Decker
 
Article milk prices and production costs world wide
Article milk prices and production costs world wideArticle milk prices and production costs world wide
Article milk prices and production costs world wideHuongNguyen14273
 
Ex-ante Simulation for Fuel Subsidy Reallocation and the Expansion of a Unive...
Ex-ante Simulation for Fuel Subsidy Reallocation and the Expansion of a Unive...Ex-ante Simulation for Fuel Subsidy Reallocation and the Expansion of a Unive...
Ex-ante Simulation for Fuel Subsidy Reallocation and the Expansion of a Unive...Meltem Aran, Ph.D.
 
An updated version of lifetime net merit incorporating additional fertility t...
An updated version of lifetime net merit incorporating additional fertility t...An updated version of lifetime net merit incorporating additional fertility t...
An updated version of lifetime net merit incorporating additional fertility t...John B. Cole, Ph.D.
 
Feeding and Fueling the World to 2030 and Beyond: Land Use Change from a Food...
Feeding and Fueling the World to 2030 and Beyond: Land Use Change from a Food...Feeding and Fueling the World to 2030 and Beyond: Land Use Change from a Food...
Feeding and Fueling the World to 2030 and Beyond: Land Use Change from a Food...Siwa Msangi
 
Global Food Security Alarm
Global Food Security AlarmGlobal Food Security Alarm
Global Food Security AlarmANM Farukh
 
Channing Arndt at Egypt NPS Seminar
Channing Arndt at Egypt NPS SeminarChanning Arndt at Egypt NPS Seminar
Channing Arndt at Egypt NPS SeminarAhmed Ali
 
Oral Presentation - Impact of Farmer Input Support Programme on Benefiting Fa...
Oral Presentation - Impact of Farmer Input Support Programme on Benefiting Fa...Oral Presentation - Impact of Farmer Input Support Programme on Benefiting Fa...
Oral Presentation - Impact of Farmer Input Support Programme on Benefiting Fa...Alfred Sianjase
 
29797 66821-1-sm
29797 66821-1-sm29797 66821-1-sm
29797 66821-1-smSumit Gupta
 
Cows, missing milk markets and nutrition in rural ethiopia
Cows, missing milk markets and nutrition in rural ethiopiaCows, missing milk markets and nutrition in rural ethiopia
Cows, missing milk markets and nutrition in rural ethiopiaessp2
 
Cows, missing milk markets and nutrition in rural ethiopia
Cows, missing milk markets and nutrition in rural ethiopiaCows, missing milk markets and nutrition in rural ethiopia
Cows, missing milk markets and nutrition in rural ethiopiaessp2
 
Cows, missing milk markets and nutrition in rural ethiopia
Cows, missing milk markets and nutrition in rural ethiopiaCows, missing milk markets and nutrition in rural ethiopia
Cows, missing milk markets and nutrition in rural ethiopiaessp2
 
The dairy industry in viet nam a value chain approach
The dairy industry in viet nam a value chain approachThe dairy industry in viet nam a value chain approach
The dairy industry in viet nam a value chain approachijmvsc
 
PAPER ON THE IMPACT OF RICE PRICES ON FOOD INFLATION IN ZANZIBAR, 2007-2012,D...
PAPER ON THE IMPACT OF RICE PRICES ON FOOD INFLATION IN ZANZIBAR, 2007-2012,D...PAPER ON THE IMPACT OF RICE PRICES ON FOOD INFLATION IN ZANZIBAR, 2007-2012,D...
PAPER ON THE IMPACT OF RICE PRICES ON FOOD INFLATION IN ZANZIBAR, 2007-2012,D...Matthias Ngobi Miti
 
Did Rapid Smallholder-led Agricultural Growth fail to Reduce Rural Poverty? M...
Did Rapid Smallholder-led Agricultural Growth fail to Reduce Rural Poverty? M...Did Rapid Smallholder-led Agricultural Growth fail to Reduce Rural Poverty? M...
Did Rapid Smallholder-led Agricultural Growth fail to Reduce Rural Poverty? M...IFPRIMaSSP
 
Women's empowerment as an effective way to increase resilience to climate change
Women's empowerment as an effective way to increase resilience to climate changeWomen's empowerment as an effective way to increase resilience to climate change
Women's empowerment as an effective way to increase resilience to climate changeCGIAR
 

Similar to Measuring the variations in regional milk supply and the lack of response to the national income over feed cost margins specified by 2014 Farm Bill (20)

Regional impacts of federal milk market policy alternatives
Regional impacts of federal milk market policy alternativesRegional impacts of federal milk market policy alternatives
Regional impacts of federal milk market policy alternatives
 
Stability criterion of periodic oscillations in a (5)
Stability criterion of periodic oscillations in a (5)Stability criterion of periodic oscillations in a (5)
Stability criterion of periodic oscillations in a (5)
 
Article milk prices and production costs world wide
Article milk prices and production costs world wideArticle milk prices and production costs world wide
Article milk prices and production costs world wide
 
Ex-ante Simulation for Fuel Subsidy Reallocation and the Expansion of a Unive...
Ex-ante Simulation for Fuel Subsidy Reallocation and the Expansion of a Unive...Ex-ante Simulation for Fuel Subsidy Reallocation and the Expansion of a Unive...
Ex-ante Simulation for Fuel Subsidy Reallocation and the Expansion of a Unive...
 
An updated version of lifetime net merit incorporating additional fertility t...
An updated version of lifetime net merit incorporating additional fertility t...An updated version of lifetime net merit incorporating additional fertility t...
An updated version of lifetime net merit incorporating additional fertility t...
 
Feeding and Fueling the World to 2030 and Beyond: Land Use Change from a Food...
Feeding and Fueling the World to 2030 and Beyond: Land Use Change from a Food...Feeding and Fueling the World to 2030 and Beyond: Land Use Change from a Food...
Feeding and Fueling the World to 2030 and Beyond: Land Use Change from a Food...
 
IFPRI - Enhancing Profitability of Family Farms, Shenggen Fan
IFPRI - Enhancing Profitability of Family Farms, Shenggen FanIFPRI - Enhancing Profitability of Family Farms, Shenggen Fan
IFPRI - Enhancing Profitability of Family Farms, Shenggen Fan
 
Global Food Security Alarm
Global Food Security AlarmGlobal Food Security Alarm
Global Food Security Alarm
 
Channing Arndt at Egypt NPS Seminar
Channing Arndt at Egypt NPS SeminarChanning Arndt at Egypt NPS Seminar
Channing Arndt at Egypt NPS Seminar
 
Oral Presentation - Impact of Farmer Input Support Programme on Benefiting Fa...
Oral Presentation - Impact of Farmer Input Support Programme on Benefiting Fa...Oral Presentation - Impact of Farmer Input Support Programme on Benefiting Fa...
Oral Presentation - Impact of Farmer Input Support Programme on Benefiting Fa...
 
29797 66821-1-sm
29797 66821-1-sm29797 66821-1-sm
29797 66821-1-sm
 
Cows, missing milk markets and nutrition in rural ethiopia
Cows, missing milk markets and nutrition in rural ethiopiaCows, missing milk markets and nutrition in rural ethiopia
Cows, missing milk markets and nutrition in rural ethiopia
 
Cows, missing milk markets and nutrition in rural ethiopia
Cows, missing milk markets and nutrition in rural ethiopiaCows, missing milk markets and nutrition in rural ethiopia
Cows, missing milk markets and nutrition in rural ethiopia
 
Cows, missing milk markets and nutrition in rural ethiopia
Cows, missing milk markets and nutrition in rural ethiopiaCows, missing milk markets and nutrition in rural ethiopia
Cows, missing milk markets and nutrition in rural ethiopia
 
The dairy industry in viet nam a value chain approach
The dairy industry in viet nam a value chain approachThe dairy industry in viet nam a value chain approach
The dairy industry in viet nam a value chain approach
 
T4 intro kline_price volatility and food security intro
T4 intro kline_price volatility and food security introT4 intro kline_price volatility and food security intro
T4 intro kline_price volatility and food security intro
 
PAPER ON THE IMPACT OF RICE PRICES ON FOOD INFLATION IN ZANZIBAR, 2007-2012,D...
PAPER ON THE IMPACT OF RICE PRICES ON FOOD INFLATION IN ZANZIBAR, 2007-2012,D...PAPER ON THE IMPACT OF RICE PRICES ON FOOD INFLATION IN ZANZIBAR, 2007-2012,D...
PAPER ON THE IMPACT OF RICE PRICES ON FOOD INFLATION IN ZANZIBAR, 2007-2012,D...
 
World dairy
World dairyWorld dairy
World dairy
 
Did Rapid Smallholder-led Agricultural Growth fail to Reduce Rural Poverty? M...
Did Rapid Smallholder-led Agricultural Growth fail to Reduce Rural Poverty? M...Did Rapid Smallholder-led Agricultural Growth fail to Reduce Rural Poverty? M...
Did Rapid Smallholder-led Agricultural Growth fail to Reduce Rural Poverty? M...
 
Women's empowerment as an effective way to increase resilience to climate change
Women's empowerment as an effective way to increase resilience to climate changeWomen's empowerment as an effective way to increase resilience to climate change
Women's empowerment as an effective way to increase resilience to climate change
 

More from Premier Publishers

Evaluation of Agro-morphological Performances of Hybrid Varieties of Chili Pe...
Evaluation of Agro-morphological Performances of Hybrid Varieties of Chili Pe...Evaluation of Agro-morphological Performances of Hybrid Varieties of Chili Pe...
Evaluation of Agro-morphological Performances of Hybrid Varieties of Chili Pe...Premier Publishers
 
An Empirical Approach for the Variation in Capital Market Price Changes
An Empirical Approach for the Variation in Capital Market Price Changes An Empirical Approach for the Variation in Capital Market Price Changes
An Empirical Approach for the Variation in Capital Market Price Changes Premier Publishers
 
Influence of Nitrogen and Spacing on Growth and Yield of Chia (Salvia hispani...
Influence of Nitrogen and Spacing on Growth and Yield of Chia (Salvia hispani...Influence of Nitrogen and Spacing on Growth and Yield of Chia (Salvia hispani...
Influence of Nitrogen and Spacing on Growth and Yield of Chia (Salvia hispani...Premier Publishers
 
Enhancing Social Capital During the Pandemic: A Case of the Rural Women in Bu...
Enhancing Social Capital During the Pandemic: A Case of the Rural Women in Bu...Enhancing Social Capital During the Pandemic: A Case of the Rural Women in Bu...
Enhancing Social Capital During the Pandemic: A Case of the Rural Women in Bu...Premier Publishers
 
Impact of Provision of Litigation Supports through Forensic Investigations on...
Impact of Provision of Litigation Supports through Forensic Investigations on...Impact of Provision of Litigation Supports through Forensic Investigations on...
Impact of Provision of Litigation Supports through Forensic Investigations on...Premier Publishers
 
Improving the Efficiency of Ratio Estimators by Calibration Weightings
Improving the Efficiency of Ratio Estimators by Calibration WeightingsImproving the Efficiency of Ratio Estimators by Calibration Weightings
Improving the Efficiency of Ratio Estimators by Calibration WeightingsPremier Publishers
 
Urban Liveability in the Context of Sustainable Development: A Perspective fr...
Urban Liveability in the Context of Sustainable Development: A Perspective fr...Urban Liveability in the Context of Sustainable Development: A Perspective fr...
Urban Liveability in the Context of Sustainable Development: A Perspective fr...Premier Publishers
 
Transcript Level of Genes Involved in “Rebaudioside A” Biosynthesis Pathway u...
Transcript Level of Genes Involved in “Rebaudioside A” Biosynthesis Pathway u...Transcript Level of Genes Involved in “Rebaudioside A” Biosynthesis Pathway u...
Transcript Level of Genes Involved in “Rebaudioside A” Biosynthesis Pathway u...Premier Publishers
 
Multivariate Analysis of Tea (Camellia sinensis (L.) O. Kuntze) Clones on Mor...
Multivariate Analysis of Tea (Camellia sinensis (L.) O. Kuntze) Clones on Mor...Multivariate Analysis of Tea (Camellia sinensis (L.) O. Kuntze) Clones on Mor...
Multivariate Analysis of Tea (Camellia sinensis (L.) O. Kuntze) Clones on Mor...Premier Publishers
 
Causes, Consequences and Remedies of Juvenile Delinquency in the Context of S...
Causes, Consequences and Remedies of Juvenile Delinquency in the Context of S...Causes, Consequences and Remedies of Juvenile Delinquency in the Context of S...
Causes, Consequences and Remedies of Juvenile Delinquency in the Context of S...Premier Publishers
 
The Knowledge of and Attitude to and Beliefs about Causes and Treatments of M...
The Knowledge of and Attitude to and Beliefs about Causes and Treatments of M...The Knowledge of and Attitude to and Beliefs about Causes and Treatments of M...
The Knowledge of and Attitude to and Beliefs about Causes and Treatments of M...Premier Publishers
 
Effect of Phosphorus and Zinc on the Growth, Nodulation and Yield of Soybean ...
Effect of Phosphorus and Zinc on the Growth, Nodulation and Yield of Soybean ...Effect of Phosphorus and Zinc on the Growth, Nodulation and Yield of Soybean ...
Effect of Phosphorus and Zinc on the Growth, Nodulation and Yield of Soybean ...Premier Publishers
 
Influence of Harvest Stage on Yield and Yield Components of Orange Fleshed Sw...
Influence of Harvest Stage on Yield and Yield Components of Orange Fleshed Sw...Influence of Harvest Stage on Yield and Yield Components of Orange Fleshed Sw...
Influence of Harvest Stage on Yield and Yield Components of Orange Fleshed Sw...Premier Publishers
 
Performance evaluation of upland rice (Oryza sativa L.) and variability study...
Performance evaluation of upland rice (Oryza sativa L.) and variability study...Performance evaluation of upland rice (Oryza sativa L.) and variability study...
Performance evaluation of upland rice (Oryza sativa L.) and variability study...Premier Publishers
 
Response of Hot Pepper (Capsicum Annuum L.) to Deficit Irrigation in Bennatse...
Response of Hot Pepper (Capsicum Annuum L.) to Deficit Irrigation in Bennatse...Response of Hot Pepper (Capsicum Annuum L.) to Deficit Irrigation in Bennatse...
Response of Hot Pepper (Capsicum Annuum L.) to Deficit Irrigation in Bennatse...Premier Publishers
 
Harnessing the Power of Agricultural Waste: A Study of Sabo Market, Ikorodu, ...
Harnessing the Power of Agricultural Waste: A Study of Sabo Market, Ikorodu, ...Harnessing the Power of Agricultural Waste: A Study of Sabo Market, Ikorodu, ...
Harnessing the Power of Agricultural Waste: A Study of Sabo Market, Ikorodu, ...Premier Publishers
 
Influence of Conferences and Job Rotation on Job Productivity of Library Staf...
Influence of Conferences and Job Rotation on Job Productivity of Library Staf...Influence of Conferences and Job Rotation on Job Productivity of Library Staf...
Influence of Conferences and Job Rotation on Job Productivity of Library Staf...Premier Publishers
 
Scanning Electron Microscopic Structure and Composition of Urinary Calculi of...
Scanning Electron Microscopic Structure and Composition of Urinary Calculi of...Scanning Electron Microscopic Structure and Composition of Urinary Calculi of...
Scanning Electron Microscopic Structure and Composition of Urinary Calculi of...Premier Publishers
 
Gentrification and its Effects on Minority Communities – A Comparative Case S...
Gentrification and its Effects on Minority Communities – A Comparative Case S...Gentrification and its Effects on Minority Communities – A Comparative Case S...
Gentrification and its Effects on Minority Communities – A Comparative Case S...Premier Publishers
 
Oil and Fatty Acid Composition Analysis of Ethiopian Mustard (Brasicacarinata...
Oil and Fatty Acid Composition Analysis of Ethiopian Mustard (Brasicacarinata...Oil and Fatty Acid Composition Analysis of Ethiopian Mustard (Brasicacarinata...
Oil and Fatty Acid Composition Analysis of Ethiopian Mustard (Brasicacarinata...Premier Publishers
 

More from Premier Publishers (20)

Evaluation of Agro-morphological Performances of Hybrid Varieties of Chili Pe...
Evaluation of Agro-morphological Performances of Hybrid Varieties of Chili Pe...Evaluation of Agro-morphological Performances of Hybrid Varieties of Chili Pe...
Evaluation of Agro-morphological Performances of Hybrid Varieties of Chili Pe...
 
An Empirical Approach for the Variation in Capital Market Price Changes
An Empirical Approach for the Variation in Capital Market Price Changes An Empirical Approach for the Variation in Capital Market Price Changes
An Empirical Approach for the Variation in Capital Market Price Changes
 
Influence of Nitrogen and Spacing on Growth and Yield of Chia (Salvia hispani...
Influence of Nitrogen and Spacing on Growth and Yield of Chia (Salvia hispani...Influence of Nitrogen and Spacing on Growth and Yield of Chia (Salvia hispani...
Influence of Nitrogen and Spacing on Growth and Yield of Chia (Salvia hispani...
 
Enhancing Social Capital During the Pandemic: A Case of the Rural Women in Bu...
Enhancing Social Capital During the Pandemic: A Case of the Rural Women in Bu...Enhancing Social Capital During the Pandemic: A Case of the Rural Women in Bu...
Enhancing Social Capital During the Pandemic: A Case of the Rural Women in Bu...
 
Impact of Provision of Litigation Supports through Forensic Investigations on...
Impact of Provision of Litigation Supports through Forensic Investigations on...Impact of Provision of Litigation Supports through Forensic Investigations on...
Impact of Provision of Litigation Supports through Forensic Investigations on...
 
Improving the Efficiency of Ratio Estimators by Calibration Weightings
Improving the Efficiency of Ratio Estimators by Calibration WeightingsImproving the Efficiency of Ratio Estimators by Calibration Weightings
Improving the Efficiency of Ratio Estimators by Calibration Weightings
 
Urban Liveability in the Context of Sustainable Development: A Perspective fr...
Urban Liveability in the Context of Sustainable Development: A Perspective fr...Urban Liveability in the Context of Sustainable Development: A Perspective fr...
Urban Liveability in the Context of Sustainable Development: A Perspective fr...
 
Transcript Level of Genes Involved in “Rebaudioside A” Biosynthesis Pathway u...
Transcript Level of Genes Involved in “Rebaudioside A” Biosynthesis Pathway u...Transcript Level of Genes Involved in “Rebaudioside A” Biosynthesis Pathway u...
Transcript Level of Genes Involved in “Rebaudioside A” Biosynthesis Pathway u...
 
Multivariate Analysis of Tea (Camellia sinensis (L.) O. Kuntze) Clones on Mor...
Multivariate Analysis of Tea (Camellia sinensis (L.) O. Kuntze) Clones on Mor...Multivariate Analysis of Tea (Camellia sinensis (L.) O. Kuntze) Clones on Mor...
Multivariate Analysis of Tea (Camellia sinensis (L.) O. Kuntze) Clones on Mor...
 
Causes, Consequences and Remedies of Juvenile Delinquency in the Context of S...
Causes, Consequences and Remedies of Juvenile Delinquency in the Context of S...Causes, Consequences and Remedies of Juvenile Delinquency in the Context of S...
Causes, Consequences and Remedies of Juvenile Delinquency in the Context of S...
 
The Knowledge of and Attitude to and Beliefs about Causes and Treatments of M...
The Knowledge of and Attitude to and Beliefs about Causes and Treatments of M...The Knowledge of and Attitude to and Beliefs about Causes and Treatments of M...
The Knowledge of and Attitude to and Beliefs about Causes and Treatments of M...
 
Effect of Phosphorus and Zinc on the Growth, Nodulation and Yield of Soybean ...
Effect of Phosphorus and Zinc on the Growth, Nodulation and Yield of Soybean ...Effect of Phosphorus and Zinc on the Growth, Nodulation and Yield of Soybean ...
Effect of Phosphorus and Zinc on the Growth, Nodulation and Yield of Soybean ...
 
Influence of Harvest Stage on Yield and Yield Components of Orange Fleshed Sw...
Influence of Harvest Stage on Yield and Yield Components of Orange Fleshed Sw...Influence of Harvest Stage on Yield and Yield Components of Orange Fleshed Sw...
Influence of Harvest Stage on Yield and Yield Components of Orange Fleshed Sw...
 
Performance evaluation of upland rice (Oryza sativa L.) and variability study...
Performance evaluation of upland rice (Oryza sativa L.) and variability study...Performance evaluation of upland rice (Oryza sativa L.) and variability study...
Performance evaluation of upland rice (Oryza sativa L.) and variability study...
 
Response of Hot Pepper (Capsicum Annuum L.) to Deficit Irrigation in Bennatse...
Response of Hot Pepper (Capsicum Annuum L.) to Deficit Irrigation in Bennatse...Response of Hot Pepper (Capsicum Annuum L.) to Deficit Irrigation in Bennatse...
Response of Hot Pepper (Capsicum Annuum L.) to Deficit Irrigation in Bennatse...
 
Harnessing the Power of Agricultural Waste: A Study of Sabo Market, Ikorodu, ...
Harnessing the Power of Agricultural Waste: A Study of Sabo Market, Ikorodu, ...Harnessing the Power of Agricultural Waste: A Study of Sabo Market, Ikorodu, ...
Harnessing the Power of Agricultural Waste: A Study of Sabo Market, Ikorodu, ...
 
Influence of Conferences and Job Rotation on Job Productivity of Library Staf...
Influence of Conferences and Job Rotation on Job Productivity of Library Staf...Influence of Conferences and Job Rotation on Job Productivity of Library Staf...
Influence of Conferences and Job Rotation on Job Productivity of Library Staf...
 
Scanning Electron Microscopic Structure and Composition of Urinary Calculi of...
Scanning Electron Microscopic Structure and Composition of Urinary Calculi of...Scanning Electron Microscopic Structure and Composition of Urinary Calculi of...
Scanning Electron Microscopic Structure and Composition of Urinary Calculi of...
 
Gentrification and its Effects on Minority Communities – A Comparative Case S...
Gentrification and its Effects on Minority Communities – A Comparative Case S...Gentrification and its Effects on Minority Communities – A Comparative Case S...
Gentrification and its Effects on Minority Communities – A Comparative Case S...
 
Oil and Fatty Acid Composition Analysis of Ethiopian Mustard (Brasicacarinata...
Oil and Fatty Acid Composition Analysis of Ethiopian Mustard (Brasicacarinata...Oil and Fatty Acid Composition Analysis of Ethiopian Mustard (Brasicacarinata...
Oil and Fatty Acid Composition Analysis of Ethiopian Mustard (Brasicacarinata...
 

Recently uploaded

MICROBIOLOGY biochemical test detailed.pptx
MICROBIOLOGY biochemical test detailed.pptxMICROBIOLOGY biochemical test detailed.pptx
MICROBIOLOGY biochemical test detailed.pptxabhijeetpadhi001
 
Types of Journalistic Writing Grade 8.pptx
Types of Journalistic Writing Grade 8.pptxTypes of Journalistic Writing Grade 8.pptx
Types of Journalistic Writing Grade 8.pptxEyham Joco
 
Introduction to ArtificiaI Intelligence in Higher Education
Introduction to ArtificiaI Intelligence in Higher EducationIntroduction to ArtificiaI Intelligence in Higher Education
Introduction to ArtificiaI Intelligence in Higher Educationpboyjonauth
 
Framing an Appropriate Research Question 6b9b26d93da94caf993c038d9efcdedb.pdf
Framing an Appropriate Research Question 6b9b26d93da94caf993c038d9efcdedb.pdfFraming an Appropriate Research Question 6b9b26d93da94caf993c038d9efcdedb.pdf
Framing an Appropriate Research Question 6b9b26d93da94caf993c038d9efcdedb.pdfUjwalaBharambe
 
Roles & Responsibilities in Pharmacovigilance
Roles & Responsibilities in PharmacovigilanceRoles & Responsibilities in Pharmacovigilance
Roles & Responsibilities in PharmacovigilanceSamikshaHamane
 
Historical philosophical, theoretical, and legal foundations of special and i...
Historical philosophical, theoretical, and legal foundations of special and i...Historical philosophical, theoretical, and legal foundations of special and i...
Historical philosophical, theoretical, and legal foundations of special and i...jaredbarbolino94
 
MARGINALIZATION (Different learners in Marginalized Group
MARGINALIZATION (Different learners in Marginalized GroupMARGINALIZATION (Different learners in Marginalized Group
MARGINALIZATION (Different learners in Marginalized GroupJonathanParaisoCruz
 
ENGLISH 7_Q4_LESSON 2_ Employing a Variety of Strategies for Effective Interp...
ENGLISH 7_Q4_LESSON 2_ Employing a Variety of Strategies for Effective Interp...ENGLISH 7_Q4_LESSON 2_ Employing a Variety of Strategies for Effective Interp...
ENGLISH 7_Q4_LESSON 2_ Employing a Variety of Strategies for Effective Interp...JhezDiaz1
 
Crayon Activity Handout For the Crayon A
Crayon Activity Handout For the Crayon ACrayon Activity Handout For the Crayon A
Crayon Activity Handout For the Crayon AUnboundStockton
 
18-04-UA_REPORT_MEDIALITERAСY_INDEX-DM_23-1-final-eng.pdf
18-04-UA_REPORT_MEDIALITERAСY_INDEX-DM_23-1-final-eng.pdf18-04-UA_REPORT_MEDIALITERAСY_INDEX-DM_23-1-final-eng.pdf
18-04-UA_REPORT_MEDIALITERAСY_INDEX-DM_23-1-final-eng.pdfssuser54595a
 
Solving Puzzles Benefits Everyone (English).pptx
Solving Puzzles Benefits Everyone (English).pptxSolving Puzzles Benefits Everyone (English).pptx
Solving Puzzles Benefits Everyone (English).pptxOH TEIK BIN
 
Final demo Grade 9 for demo Plan dessert.pptx
Final demo Grade 9 for demo Plan dessert.pptxFinal demo Grade 9 for demo Plan dessert.pptx
Final demo Grade 9 for demo Plan dessert.pptxAvyJaneVismanos
 
What is Model Inheritance in Odoo 17 ERP
What is Model Inheritance in Odoo 17 ERPWhat is Model Inheritance in Odoo 17 ERP
What is Model Inheritance in Odoo 17 ERPCeline George
 
Painted Grey Ware.pptx, PGW Culture of India
Painted Grey Ware.pptx, PGW Culture of IndiaPainted Grey Ware.pptx, PGW Culture of India
Painted Grey Ware.pptx, PGW Culture of IndiaVirag Sontakke
 
EPANDING THE CONTENT OF AN OUTLINE using notes.pptx
EPANDING THE CONTENT OF AN OUTLINE using notes.pptxEPANDING THE CONTENT OF AN OUTLINE using notes.pptx
EPANDING THE CONTENT OF AN OUTLINE using notes.pptxRaymartEstabillo3
 
Organic Name Reactions for the students and aspirants of Chemistry12th.pptx
Organic Name Reactions  for the students and aspirants of Chemistry12th.pptxOrganic Name Reactions  for the students and aspirants of Chemistry12th.pptx
Organic Name Reactions for the students and aspirants of Chemistry12th.pptxVS Mahajan Coaching Centre
 
Gas measurement O2,Co2,& ph) 04/2024.pptx
Gas measurement O2,Co2,& ph) 04/2024.pptxGas measurement O2,Co2,& ph) 04/2024.pptx
Gas measurement O2,Co2,& ph) 04/2024.pptxDr.Ibrahim Hassaan
 
CELL CYCLE Division Science 8 quarter IV.pptx
CELL CYCLE Division Science 8 quarter IV.pptxCELL CYCLE Division Science 8 quarter IV.pptx
CELL CYCLE Division Science 8 quarter IV.pptxJiesonDelaCerna
 

Recently uploaded (20)

MICROBIOLOGY biochemical test detailed.pptx
MICROBIOLOGY biochemical test detailed.pptxMICROBIOLOGY biochemical test detailed.pptx
MICROBIOLOGY biochemical test detailed.pptx
 
Types of Journalistic Writing Grade 8.pptx
Types of Journalistic Writing Grade 8.pptxTypes of Journalistic Writing Grade 8.pptx
Types of Journalistic Writing Grade 8.pptx
 
Introduction to ArtificiaI Intelligence in Higher Education
Introduction to ArtificiaI Intelligence in Higher EducationIntroduction to ArtificiaI Intelligence in Higher Education
Introduction to ArtificiaI Intelligence in Higher Education
 
Framing an Appropriate Research Question 6b9b26d93da94caf993c038d9efcdedb.pdf
Framing an Appropriate Research Question 6b9b26d93da94caf993c038d9efcdedb.pdfFraming an Appropriate Research Question 6b9b26d93da94caf993c038d9efcdedb.pdf
Framing an Appropriate Research Question 6b9b26d93da94caf993c038d9efcdedb.pdf
 
Roles & Responsibilities in Pharmacovigilance
Roles & Responsibilities in PharmacovigilanceRoles & Responsibilities in Pharmacovigilance
Roles & Responsibilities in Pharmacovigilance
 
Historical philosophical, theoretical, and legal foundations of special and i...
Historical philosophical, theoretical, and legal foundations of special and i...Historical philosophical, theoretical, and legal foundations of special and i...
Historical philosophical, theoretical, and legal foundations of special and i...
 
MARGINALIZATION (Different learners in Marginalized Group
MARGINALIZATION (Different learners in Marginalized GroupMARGINALIZATION (Different learners in Marginalized Group
MARGINALIZATION (Different learners in Marginalized Group
 
ENGLISH 7_Q4_LESSON 2_ Employing a Variety of Strategies for Effective Interp...
ENGLISH 7_Q4_LESSON 2_ Employing a Variety of Strategies for Effective Interp...ENGLISH 7_Q4_LESSON 2_ Employing a Variety of Strategies for Effective Interp...
ENGLISH 7_Q4_LESSON 2_ Employing a Variety of Strategies for Effective Interp...
 
Crayon Activity Handout For the Crayon A
Crayon Activity Handout For the Crayon ACrayon Activity Handout For the Crayon A
Crayon Activity Handout For the Crayon A
 
18-04-UA_REPORT_MEDIALITERAСY_INDEX-DM_23-1-final-eng.pdf
18-04-UA_REPORT_MEDIALITERAСY_INDEX-DM_23-1-final-eng.pdf18-04-UA_REPORT_MEDIALITERAСY_INDEX-DM_23-1-final-eng.pdf
18-04-UA_REPORT_MEDIALITERAСY_INDEX-DM_23-1-final-eng.pdf
 
Solving Puzzles Benefits Everyone (English).pptx
Solving Puzzles Benefits Everyone (English).pptxSolving Puzzles Benefits Everyone (English).pptx
Solving Puzzles Benefits Everyone (English).pptx
 
Final demo Grade 9 for demo Plan dessert.pptx
Final demo Grade 9 for demo Plan dessert.pptxFinal demo Grade 9 for demo Plan dessert.pptx
Final demo Grade 9 for demo Plan dessert.pptx
 
What is Model Inheritance in Odoo 17 ERP
What is Model Inheritance in Odoo 17 ERPWhat is Model Inheritance in Odoo 17 ERP
What is Model Inheritance in Odoo 17 ERP
 
ESSENTIAL of (CS/IT/IS) class 06 (database)
ESSENTIAL of (CS/IT/IS) class 06 (database)ESSENTIAL of (CS/IT/IS) class 06 (database)
ESSENTIAL of (CS/IT/IS) class 06 (database)
 
Painted Grey Ware.pptx, PGW Culture of India
Painted Grey Ware.pptx, PGW Culture of IndiaPainted Grey Ware.pptx, PGW Culture of India
Painted Grey Ware.pptx, PGW Culture of India
 
EPANDING THE CONTENT OF AN OUTLINE using notes.pptx
EPANDING THE CONTENT OF AN OUTLINE using notes.pptxEPANDING THE CONTENT OF AN OUTLINE using notes.pptx
EPANDING THE CONTENT OF AN OUTLINE using notes.pptx
 
Organic Name Reactions for the students and aspirants of Chemistry12th.pptx
Organic Name Reactions  for the students and aspirants of Chemistry12th.pptxOrganic Name Reactions  for the students and aspirants of Chemistry12th.pptx
Organic Name Reactions for the students and aspirants of Chemistry12th.pptx
 
Gas measurement O2,Co2,& ph) 04/2024.pptx
Gas measurement O2,Co2,& ph) 04/2024.pptxGas measurement O2,Co2,& ph) 04/2024.pptx
Gas measurement O2,Co2,& ph) 04/2024.pptx
 
CELL CYCLE Division Science 8 quarter IV.pptx
CELL CYCLE Division Science 8 quarter IV.pptxCELL CYCLE Division Science 8 quarter IV.pptx
CELL CYCLE Division Science 8 quarter IV.pptx
 
9953330565 Low Rate Call Girls In Rohini Delhi NCR
9953330565 Low Rate Call Girls In Rohini  Delhi NCR9953330565 Low Rate Call Girls In Rohini  Delhi NCR
9953330565 Low Rate Call Girls In Rohini Delhi NCR
 

Measuring the variations in regional milk supply and the lack of response to the national income over feed cost margins specified by 2014 Farm Bill

  • 1. Measuring the variations in regional milk supply and the lack of response to the national income over feed cost margins specified by 2014 Farm Bill JAERD Measuring the variations in regional milk supply and the lack of response to the national income over feed cost margins specified by 2014 Farm Bill Maryfrances Miller Texas A&M University-Commerce, P.O. Box 3011, Commerce, Texas 75429, USA. Email: frannie.miller@tamuc.edu The 2014 Farm Bill changed dairy policy from a price floor and counter-cyclical payment plan to a federal insurance program for income over feed cost margins. Milk production response to low margin periods between 2000 and 2012 is evaluated by region of the country. No evidence was found of production response from eastern and mid-western dairies to low margin periods. Only slight response was evident in western regions. Although current federal expenditures under the program have been limited by low participation beyond the catastrophic-insurance level, the negligible production response during low margin periods may have significant policy ramifications in coming years. The lack of a short-term corrective mechanism in milk markets continues to be an issue. Keywords: Dairy, agricultural policy, Margin Protection Program-Dairy, 2014 Farm Bill, margins INTRODUCTION The 2014 U.S. Farm Bill dramatically changed dairy policy. It provides an insurance program, known as Margin Protection Program (MPP)-Dairy, for dairy farmers to insure an Income Over Feed Cost (IOFC) margin on a percentage of their milk production. The IOFC margins are defined as the difference between the price of a hundred pounds of milk and the price of a specified dairy feed ration. When this margin falls below the insured level, direct indemnity payments will be made to farmers to make up the difference on covered milk production (Bozic, 2013).The program has been described as a way to move away from the straight subsidies of the past and toward a concept that requires a more active risk management role by farmers. The motivation to change dairy policy was largely a result of the disastrous price environment for dairy farmers that occurred in 2009. Using the equation specified in the 2014 Farm Bill for calculating IOFC margins, they averaged $12 per hundredweight in 2007, hitting record high in August at $14.65 per hundredweight in August. A year later, in August 2008, margins had fallen to $7.69 per hundredweight of milk, a drop of almost 48 percent. In the next 10 months, they continued to slide another 71 percent, hitting a low of $2.25 per hundred weights in June 2009. Even as profitability decreased sharply, milk production increased. As margins plunged, milk production began its annual spring upswing, and prices were pushed lower. Consensus formed around the idea that policy could no longer be tied to only the revenue from milk, instead it needed to focus on the margin of milk over feed prices. In the past, the safety net for the United States dairy industry was provided through the Milk Income Loss Contract (MILC). This program created under the 2002 Farm Bill, formally known as the Farm Security and Rural Investment Act of 2002. Under the MILC program, benefits were limited by production caps. This meant dairy regions with higher percentages of small farms Journal of Agricultural Economics and Rural Development Vol. 3(2), pp. 130-138, January, 2017. © www.premierpublishers.org, ISSN: 2167- 0477 Research Article
  • 2. Measuring the variations in regional milk supply and the lack of response to the national income over feed cost margins specified by 2014 Farm Bill Miller M. 131 received disproportionally larger shares of MILC, and regions characterized by larger farms received less in federal benefits, proportional to actual milk production (Chang, 2011). Under the new MPP-Dairy program, benefits received will be a function of milk production and the individual farmer’s choices of participation in the program. Accordingly, benefits to larger farms are now expected to increase. The complications and difficulties associated with dairy policy are often blamed on the highly perishable nature of fluid milk. But, a significant portion of the difficulty of regulating milk markets is geographical in nature. This research focuses on regional imbalances that may occur as part of the new policy. Specifically, the focus here is to compare and contrast the response to low IOFC margin periods from region to region. The slow response of milk production to milk price has been investigated by Chavas and Klemme (1986), and recently by Bozic et al. (2011). Chavas and Klemme developed a model that incorporated cow biology into their model of supply elasticity. Bozic et al. modified this approach and used a mixed frequency model, which combined quarterly yield data with annual herd and heifer numbers. In the period from 1975 to 2005, they found a declining trend in long-run supply responsiveness. However, while milk was becoming less own-price elastic, it was becoming more responsive to feed costs (Bozic et al., 2011). Chavas et al. (1990), and Wee sink and Howard (1990), both investigated how own-price elasticity differed regionally. Chavas et al. (1990) was motivated by dramatic westward shifts in the geography of milk production. California had gone from producing 5.1 percent of the nation’s milk in 1950 to 12 percent in 1987. This trend has continued. In 2012, California production had grown to 20.9 percent of national milk production (National Agricultural Statistics Service, 2013).For own- price supply elasticity in the very short-run, they found milk supply Elasticities ranged from a low of 0.015 in the New England region to a high of 0.110 in the East South Central region. At twenty years, the variation was phenomenal; the Pacific region had an elasticity of 9.843, while the South Atlantic remained inelastic at 0.527 even in this time horizon. The Pacific region appeared to have more flexibility and responsiveness to feed cost, slaughter price, and slightly more than other regions for risk, as well (Chavas et al., 1990).Wee sink and Howard (1990) evaluated the regional response to a change in the US dairy policy that lowered milk support prices between 1950 and 1986 and found considerable regional variation in response to price changes. They found that realignment of dairy production from a drop in federal milk support prices would be largely born by the Midwest. Wee sink and Tauer (1990) focused on how technical changes would change regional production shares in response to changes in dairy policy. All of the work comparing regional elasticity to date focused on the dairy industry prior to 1990. In 1990, Dairy Product Price Support Program was reduced to $10.10 per hundredweight, effectively changing it to a non-binding price floor and allowing dairy prices to become increasingly volatile (Blayney, 2002). Bryant, Outlaw and Anderson (2007) investigated the supply response to the MILC program. They avoided the complexities of a dynamic programming approach in favor of a partial adjustment model of the long-run equilibrium. Using their model, they estimated the speed of adjustment to equilibrium levels in response to a sustained change in supply determinant as 10.5 years Bryant et al. (2007). The partial adjustment model used by Bryant, Outlaw and Anderson (2007) is modified and used to evaluate the response of regional milk production, not to the price of milk, but to the low margin periods as defined by the 2014 Farm Bill. A time series model is used to compare the response of milk production within each region to the low margin periods on which the new farm bill is focused. This is used to investigate the regional aggregate milk production response to the IOFC national margin, as it is specified in the farm bill. Milk prices fluctuate from region to region with local market conditions, so do feed costs. Alfalfa hay, which constitutes the forage portion of the ration, is not even grown or widely fed in a number of states. However, the program will be conducted using the national price for both feed and milk, so the response in output to these national prices will drive program expenditures and efficacy. The variation in regional prices means that a farm’s individual margin is not what is insured. The farm is insured only for deterioration of the national margin. This creates something analogous to a basis risk for traditional risk management approaches. Instead of measuring a region’s response to the actual prices received and paid within the region, which is not what the program covers, here the regional output response to national average prices is measured, which is what the program covers. Previous work on supply elasticity has either measured national response to national prices or regional response to regional prices. MATERIALS AND METHODS Historic price information for milk, corn, soybean meal, and alfalfa hay is used to calculate national IOFC margins as directed under the Dairy subtitle of the 2014 Farm Bill. Margins are calculated for the period from January 2000 through December 2012. Milk production response is measured at quarterly intervals so that data from each of the 48 contiguous states is included. The
  • 3. Measuring the variations in regional milk supply and the lack of response to the national income over feed cost margins specified by 2014 Farm Bill J Agric. Econ. Rural Devel. 132 Table 1. Application of margin calculations to historical price information from 2000 to 2013. Margin Level Two- month periods Quarterly periods Separate events $8.00 33 20 7 7.50 223 15 5 7.00 18 11 4 6.50 12 9 4 6.00 10 6 3 5.50 7 5 2 5.00 7 5 2 4.50 6 5 2 4.00 6 4 2 legislation allows for indemnity payments to be made when margins drop for two consecutive months, but monthly data is not available for states that are not major dairy production states, so quarterly data was used. It is important to note that this is a slight variation from the specifics of the enacted legislation. The number of periods when a margin payment would have been made is shown in table 1. A dummy variable was created to indicate quarters for which the average margin was below a $7.00 per hundredweight margin (LOW). The number of low margin periods for each trigger value is shown in Table 1. The four periods included for a $7.00 margin trigger, which was the focus of the analysis, are: a) the third quarter of 2002, lasting one year through the second quarter of 2003, with an average margin during the period of $6.24per hundredweight; b) the second quarter of 2006, lasting one quarter, with an average margin of $6.82per hundredweight; c) the second quarter of 2009, lasting three quarters through third quarter of 2009, with an average margin of $3.57per hundredweight; and d) the first quarter of 2012, lasting three quarters through third quarter of 2012, when the average margin was $4.53per hundredweight. Table 1 shows the number of periods for which indemnity payments would have occurred between 2000and 2013, using the margin calculation specified under the new program. Because quarterly data is used here, the number of quarterly average margin levels below each level is also presented. The number of events refers to the number of contiguous periods below a given margin level. A partial adjustment specification is used to evaluate how aggregate regional output grows or declines in relation to national IOFC margins (Bryant et al., 2007, 138). Paralleling the analysis in Bryant et al. (2007), the long-run equilibrium level of dairy production desired at time t is posited as: * it t itQ X    (1) The production by region is assumed to evolve according to the adjustment process shown in equation 2 using as the adjustment parameter. * , 1 , 1(1 )( )it i t t it i t tQ Q Q Q       (2) Equation 1 is substituted into equation 2 and solved for itQ . 𝛽is substituted for 𝛽 1 − 𝛾 and 𝜇 is substituted for 𝜇 1 − 𝛾 . Solving for itQ leaves: * , 1it t it i t tQ X Q Q      (3) It is assumed that 0 << 1, that quantity of milk does not adjust to equilibrium levels instantaneously. For each region t indicates the speed of adjustment. This incorporates the behavior of producers who adjust their output when they realize that * 1t tQ Q but weigh the benefits of producing at the optimum against the costs of adjusting feed, yield, and eventually herd size (Bryant et al., 2007). The model is specified using equation 4, with LOW used as a dummy variable to indicate low margin periods, M indicating the IOFC margin level, S as the slaughter price of cull cattle, Y as the yield per cow, and D denoting the three quarterly dummy variables. 0 1 2 3 4 5 6 , 1,2...,6 7 1 8 2 9 3 t t t t t it i t Q LOW M LOW M S Y Q D D D                      (4)
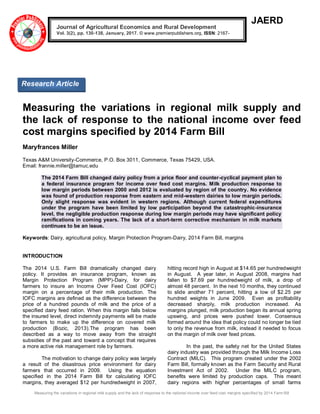
  • 4. Measuring the variations in regional milk supply and the lack of response to the national income over feed cost margins specified by 2014 Farm Bill Miller M. 133 According to economic theory, the coefficient for tM should be positive, as IOFC margins increase, production should respond accordingly. Likewise, the coefficient for the dummy variable indicating periods of low margins, tLOW , should be negative, as these periods should be characterized by lower quantities of milk supplied. The interaction term, t tLOW M is included to test whether or not the sensitivity of output to margins increases when those margins are low. This is expected to be positive, if margins decline while they are already low, output reductions are expected to accelerate. Ceteris paribus, an increase in the price of beef for culled cows should increase the culling rate and decrease output of milk. Yield is expected to be positive but small, an increase in yield would be expected to increase milk production. However, according to a Cornell Cooperative Extension publication on Dairy Replacement Program Costs and Analysis created by Jason Karszes in 1993, there was no statistically significant relationship, in the New York farms he studied, between culling rates and yield. The coefficient for lagged production is expected to be positive, higher output in the previous period is likely to increase production in this period. Essentially, the goal of dairy policy is to dampen this relationship between what a farmer does today and yesterday and instead increase the response to market conditions. Milk production is highly seasonal so three quarterly dummy variables are included. The fourth quarter is omitted and captured in the intercept. The first and second quarter coefficients should be positive as the “spring flush” increases production, and the third quarter should be negative as warm summers decrease feed consumption and days in milk increase from slightly seasonal breeding patterns. Output in each region, itQ is modeled as the dependent variable. Dummy variables for three quarters are included to adjust for highly seasonal variation in output. Time is t and i indicates the region of the country. tX and  represent vectors of supply determinants and their parameters. The random disturbance is captured by t . The supply determinants included the IOFC margin, t , are calculated from the price of corn, alfalfa, soybean meal, and milk price as specified by the legislation. The national price of beef from slaughtered cows, S, and yield per cow, Y, for the regions also included as explanatory variables. Milk price over feed cost margins from time t were used instead of time t-1 partially because of the structure of milk payments to farmers. Farms receive payment for milk shipped in June in July, so price data from June is not realized on the farm until July. Furthermore, a high number of farmers watch milk futures prices, even if they do not actively hedge their production. Data was obtained primarily from National Agricultural Statistics Service (NASS) through the Quick stats feature. State data for milk production was grouped into five regions, using the regions defined by the Cooperatives Working Together (CWT) program as shown in Figure 1. As the name implies, this organization was formed through the cooperation of thirty-five milk marketing cooperatives and individual producers and is managed by a non-profit organization, the National Milk Producers Federation (NMPF). Yield data for the region is estimated by averaging the three months in each quarter for each of the top 23 dairy states for which monthly data are available. The shading in Figure 1 denotes when data was available. The states with the darkest shading have monthly data available throughout the time period. Monthly data became available for Colorado, Kansas, and Oregon beginning in 2003.Monthly data collection ceased for Kentucky and began for Utah in 2008. The average quarterly yield for these states is then used as the estimate for the entire region. Because yield is largely a function of geographic variables, like weather/climate and related influences on feed, yield in neighboring dairy states seemed to be a decent proxy. This is a better approximation for region 3, which contains many of the top 23 dairy states, and more problematic for region 2, which only contains two states for which monthly data is collected. Monthly data was not collected for March through June of2013 due to the government shutdown, so the series ends in 2012. Milk prices, corn prices, and alfalfa prices were obtained from NASS, while soybean meal prices were obtained from the Agricultural Marketing Service (AMS). The calculations on milk over feed margins were made in accordance with the formula specified in the proposed legislation. The estimated feed cost is given in equation 5 with the dollar symbols denoting prices. $Feed=1.0728$Corn+0.00735$SoybeanMeal+0.0137 $Alfalfa Hay (5) Much of the previous literature, including Bryant et al., used cow numbers as the dependent variable. Here, milk production is used instead to enable a more timely estimation of the response to the type of low margin periods addressed in the farm bill. Cow numbers are not used for a combination of reasons. There have been major changes in dairy policy and geographic structure of the industry since 2000, so it was important to confine the time period to the recent past after those changes (Miller and Blayney, 2006). Herd size information is only available annually. Since the question being researched is focused on responses to low margin periods, which usually last less than a full year, this makes annual cow numbers of little use to the question
  • 5. Measuring the variations in regional milk supply and the lack of response to the national income over feed cost margins specified by 2014 Farm Bill J. Agric. Econ. Rural Devel. 134 Figure 1. Regions are based on the grouping of states created by the Cooperatives Working Together (CWT) program. Shaded states have monthly data available through USDA, which only collects monthly data for top dairy production states. Monthly data collection ceased for Kentucky and began for Utah in 2008. Monthly data became available for Colorado, Kansas, and Oregon beginning in 2003. posed. Chavas and Klemme found that the majority of long run output adjustment comes from changes in herd size, while changes in yield explain smaller changes in the short-term (Chavas and Klemme, 1986). The response being measured is only a measurement of the change in output and does not attempt to distinguish between which portion is obtained through changes in regional herd size and which portion is from changes in yield per cow. It is important to note that while changes in yield are not as important to output response as changes in cow numbers, year-over-year changes in the rate of production per cow have raised production per head by almost 20 percent just since 2000. Because of the limited data range, and to include in the discussion effects that are even weakly statistically significant, an acceptable probability level for a Type I error was set at 15 percent. In this case, a “finding of no significance” is politically significant and could contribute to greater federal outlays on this program than expected. If there is no significant response in production to low margin periods, the duration of the low margin periods will be longer than if there was a reliable and significant production response. Without a reliable drop in production, the market correction that pushes margins back up is delayed. Under the new program, the amount of federal expenditure will depend on the duration of low margin periods, as well as the actual margin deficiency. Natural logarithms are used for each variable except the dummy variables. Each variable was checked for presence of a unit root, using the Augmented Dickey Fuller test in E-views software. Production in region 1 was stationary and was modeled as the log of output. Production in the other four regions, yield in each region, and beef prices were modeled as a first difference to achieve stationary. A step-wise approach was used to determine the correct number of lags to include in each region. The specification used a linear model with six lags of the dependent variable. Breusch-Godfrey tests were conducted for each regional equation to check for serial correlation. RESULTS The results from model estimation are included in Table 2. The main variable of interest pursuant to the 2014 Farm Bill is the dummy variable for low margins. The response in the West, region 5, was the only region with a statistically significant response in milk production. It is apparent that both the predictability of the response to low margin periods, and the actual response in production, increases as we move westward across the country. In region 4, production during the periods when margins dipped below $7.00 dropped by 4.8 percent. In region5, production dropped by 5.9 percent during those periods. Using 2012 average production, a 4.8percent reduction in region 4 constitutes a drop of almost 4 million pounds/day. In region 5, a 5.9percent drop is equivalent to 10.8 million pounds of daily milk production.
  • 6. Measuring the variations in regional milk supply and the lack of response to the national income over feed cost margins specified by 2014 Farm Bill Miller M. 135 Table 2. Coefficients that are statistically significant at a 15 percent significance level are in bold. The adjusted R2 for each equation is given at the bottom of the table. P-values are included below each coefficient. Region 1 2 3 4 5 Intercept P-value 1.566 0.39 0.071 0.43 -0.007 0.81 -0.015 0.71 -0.046 0.10 LOW 0.024 0.56 -0.006 0.91 0.014 0.66 -0.048 0.28 -0.059 0.05 Margin 0.011 0.42 -0.007 0.70 0.000 0.97 0.011 0.49 0.009 0.44 Margin -0.004 0.54 0.013 0.88 -0.010 0.56 0.028 0.23 0.031 0.05 Beef price -0.018 0.51 0.003 0.93 0.001 0.98 -0.070 0.05 0.000 0.97 Yieldi 0.039 0.42 0.058 0.67 0.145 0.08 0.234 0.04 -0.137 0.13 First Quarter 0.029 0.17 -0.024 0.78 0.011 0.57 0.039 0.24 0.062 0.00 Second Quarter 0.023 0.44 -0.001 0.99 0.038 0.08 0.046 0.16 0.078 0.00 Third Quarter -0.044 0.06 0.204 0.04 -0.005 0.76 -0.055 0.07 0.016 0.32 1.292 0.00 0.083 0.66 0.010 0.53 0.055 0.71 -0.041 0.79 -0.697 0.02 -0.238 0.23 -0.441 0.10 -0.132 0.43 -0.186 0.22 0.551 0.09 0.265 0.16 0.301 0.04 0.061 0.71 0.151 0.34 -0.354 0.27 -0.156 0.48 -0.038 0.83 -0.150 0.33 -0.112 0.48 0.052 0.86 0.078 0.69 -0.126 0.46 -0.154 0.26 -0.210 0.19 0.047 0.81 -0.121 0.55 0.002 0.99 -0.116 0.41 -0.029 0.86 R 2 0.89 0.98 0.98 0.94 0.88 The lack of a statistically significant effect in the eastern regions for the low-margin dummy variable demonstrates that there has been no reliable effect on output resulting from periods when the national margin is below $7.00. Technically, we fail to reject the null hypothesis that this coefficient is equal to zero. This is reinforced by a consistent result for the variable Margin. In each region, there is no evidence that the coefficient for the production response to the specified national margin is different from zero. The p-value is greater than 0.40 for each region, and the coefficients are also quite small. The dummy variable for low margin periods was interacted with the margin series to evaluate the response in milk production to the IOFC margin specifically during low margin periods. This was only statistically significant in region 5. In region 4, the coefficient for Margin is 0.011, but the coefficient for Margin  LOW is 0.028. In region 5, the coefficient for Margin is 0.009, but the coefficient for MarginLOW is 0.031. In the western regions, production increases are much quicker to respond to drops or improvements in low margins than in the rest of the United States. The coefficient for beef prices was much greater than expected, particularly in region 4. In region 4, the price of beef for cull cows was significant, and the absolute size of the coefficient was greater in absolute terms (-0.07) than for any other variable across all regions except yield. 1tQ  2tQ  3tQ  4tQ  5tQ  6tQ 
  • 7. Measuring the variations in regional milk supply and the lack of response to the national income over feed cost margins specified by 2014 Farm Bill J. Agric. Econ. Rural Devel. 136 Table 2. Output response to different levels of low margins. This table presents the coefficient and p-value for regressions run in each region for the dummy variable for low margins. LOW8 had a value of 1 if the observed average margin for a quarter fell below $8.00 and so on for $7.00, $6.00, and $4.00 margins. P-values are included below the coefficient. Region 1 2 3 4 5 LOW$8. 00 0.031 0.41 -0.043 0.48 0.025 0.50 -0.009 0.85 -0.043 0.21 LOW$7. 00 0.024 0.56 -0.006 0.91 0.014 0.66 -0.048 0.28 -0.059 0.05 LOW$6. 00 0.049 0.26 0.500 0.43 0.039 0.45 -0.039 0.45 -0.029 0.40 LOW$4. 00 0.039 0.56 0.032 0.88 0.076 0.24 -0.030 0.73 -0.043 0.24 This seemed unlikely, since most other research has found a quite limited reaction to changes in beef prices. Furthermore, it seems implausible that output decisions related to milk price over feed income would be best explained by beef prices for cull cows. However, a possible explanation for this result is the interaction of the CWT program, which is used here to categorize the regions, and beef prices. The CWT program was a farmer-run, private organization that charged an assessment on milk production of participating farmers. Periodically, “herd retirement” programs were conducted to reduce the supply of milk in the U.S. Farmers submitted competitive bids and the program would purchase the milk production history of farmers whose bids were selected. If selected, a herd had to be sold immediately for slaughter. The realized price to the farmer for their herd was the combination of the milk production history and the slaughter price for the cows. Higher beef prices would allow a farmer to submit a lower CWT herd retirement bid, increasing the odds of being included in the program. This might amplify the connection between beef prices and production response. Furthermore, the largest two herd retirement programs (of ten) were conducted during 2009 during periods of low margins. The high level of participation in herd retirements by region 4 and the higher level of response of milk production to beef price supports this notion. Changes in yield were significant in regions 3, 4, and 5. The ideal climate and the advances in dairy infrastructure in region 5 is noticeable, the average production per cow over the entire period is 17 pounds/day higher than in region 2. As region 4 has grown insignificance to the dairy industry, yield per cow has surpassed region 5 beginning around 2009. During the low prices of2002-03, output per cow dropped and eventually recovered. In 2009 and 2012, the response was instead a slight increase in output per cow, although it did begin to drop during the second quarter of 2012. Since yield is calculated as total output in a state divided by milking cows, this change in output per cow is, again, likely a function of the CWT program on which the regions are delineated. Participation in the CWT program lowers the number of cows. The drop in production is captured first in the monthly milk production survey, but the cow numbers are only surveyed annually. It still means there is a significant response captured through this variable, but it is likely at least partially due to a change in cow numbers and not entirely reflective of changes in output per head. Another issue investigated was how the output response varied with different levels of low margin periods. The results are inconclusive, but are shown in Table 3. The move from $8.00 margins to $7.00 margins fits economic theory, as margins are eroded, the output becomes more negative (or at least less positive.) One possible explanation of the movement in opposite direction in regions 1and 2 are that these areas often sell heifers to other regions. During low margin periods, the market for replacement heifers may dry up, and farms in these regions possibly freshen a larger percentage of heifers into their own herds. While this is a possible explanation for the economic meaning of the coefficients, the null hypothesis that these coefficients are equal to zero cannot be rejected. While the results for low margins are quite inconclusive, under the new program actual margins for participating farmers will be increased through indemnity payments during low margin periods. The coefficients for the move from $8.00 to $7.00 margins in table 5, supports the likely economic result that this would reduce the output response. However, the results from the LOW$6.00 and LOW$4.00 coefficients contradict this. Possibly, these periods are simply too short to allow a full response in dairy production to be discerned or even implemented at the farm. For instance, there are only four quarters between 2000 and 20012 for which the average margin is below $4.00. These periods occurred during the first two quarters of 2009 and the second and third quarters of 2012. DISCUSSION The regional variation in the response to low margin periods has important political and industry significance, but the results are hardly surprising.
  • 8. Measuring the variations in regional milk supply and the lack of response to the national income over feed cost margins specified by 2014 Farm Bill Miller M. 137 Previous research has supported the finding that regions 4 and 5 are much more elastic, both in response to milk and to feed prices. The margin insurance program will shift benefits towards the larger dairies more characteristic of western states, allowing large dairies in those regions more protection from low margins than what was available under MILC. This aligns the farm program more closely with the volume of milk production. During the years investigated, the market response to low margins has come from regions 4and 5 and no evidence could be found that dairies in the eastern part of the country slow production in response to low margins. Depending on participation choices, the two western regions could potentially receive larger amounts of federal assistance than what would have been possible under previous policy, given the production caps required by the MILC program. The results here show that the only statistically significant response in milk production to these extremely low margin periods occurs in region 5. During the study period, this region was, proportionate to milk production volume, less protected from market fluctuations through MILC than other regions. If the federal safety net provides a more even level of protection from short-term disequilibrium, this could easily dampen the supply reduction that normally occurs from this region. If this occurs, the low margin periods could become more protracted. The speed of response to low margins is important because, in addition to the farm-level losses, it will affect the cost of the program for the federal government. Admittedly, participation in the program has been almost entirely limited to the catastrophic-level coverage at $4.00. From calculations made from program participation results provided by the USDA Farm Service factsheet on the program, the percent of covered milk production at this minimum level for each region for the 2016 year was:89.7percent of region 1 covered milk production; 81.1 percent of region 2covered milk production; 79.4 percent for region 3covered milk production; 83.0 percent for region 4covered milk production; and 95.8 percent for region 5. It appears that only farms that purchased IOFC margin insurance for $6.00 and higher will receive indemnity payments for 2016. Nationally, this is limited to only 10.3 percent of all milk production covered in the program and to approximately 9 percent of total US milk production (using 2015 US annual milk production). However, the margins of 2016 may have many farmers reconsidering their choices of which margin level to insure. If farmer participation in the program shifts to purchasing higher IOFC margin insurance and markets continue to soften, the federal outlays for this program could further decrease milk supply elasticity. The lack of a short-term correction mechanism that was sought by the industry when the original legislation for the 2014 Farm Bill Dairy subtitle was proposed is still a problem for the dairy industry. The MPP-Dairy program could potentially exacerbate this problem by dulling the production response that has historically occurred in the western states of region 5. At current participation levels, this is not likely to be a problem, unless IOFC margin drops occur similar to levels in 2009 or 2012. ACKNOWLEDGEMENT The author owned a dairy farm from April 2010 through March 2016, and participated in the MPP-Dairy program. While this experience provided intimate experience with the frustration of farming during periods of low IOFC margins, the sale of the cattle removed any potential conflict of interest that could be imagined to arise from research in aggregate production responses to dairy policy. REFERENCES Adelaja A (1991). Price changes, supply elasticities, industry organization, and dairy output distribution. American Journal of Agricultural Economics73: 89-102. ARMS Survey Data (2014).Milk production costs and returns per hundredweight. USDA Online database. Accessed July 2014. Blaney DP (2002). The changing landscape of US milk production. USDA Economic Research Service Statistical Bulletin. Number 978. Washington D.C. Bozic M, Cameron S, Thraen CS, Newton, J (2013). Farm Bill dairy margin formula explained. World Dairy Situation – supplemental resource. Accessed September 30, 2014. Bozic M, Kanter CA, Gould BW (2012). Tracing the evolution of the aggregate U.S. milk supply elasticity using a herd dynamics model. Agricultural Economics.43: 515-530. Bryant HL, Outlaw JL, Anderson, D (2007). Aggregate milk supply response to the Milk Income Loss Contract program. Journal of Agribusiness. 25: 133–146. Chang HH, Mishra AK (2011). Does the Milk Income Loss Contract program improve the technical efficiency of US dairy farms? Journal of Dairy Science.94: 2945- 2951. Chavas J, Klemme R (1986). Aggregate milk supply response and investment behavior on U.S. dairy farms. American Journal of Agricultural Economics 68: 55–66. Chavas J, Kraus A, Jesse E (1990). A regional analysis of milk supply response in the United States. North Central Journal of Agricultural Economics.12: 149. Edwards, Browne and Torah Montessori School v. National Milk Producers Federation; Dairy Farmers of America; Dairylea Cooperative; Land O’Lakes; Agri- Mark, Inc. United States District Court – Northern
  • 9. Measuring the variations in regional milk supply and the lack of response to the national income over feed cost margins specified by 2014 Farm Bill J. Agric. Econ. Rural Devel. 138 District of California. Class Action Lawsuit. September 26, 2011. Erba EM, Novakovic, AM (2005). The evolution of milk pricing and government intervention in dairy markets.Cornell Program on Dairy Markets and Policy. Greene WH (1993). Econometric Analysis.2 nd ed. Macmillan Publishing Company. New York, NY. Manchester A, Blayney DP (2001). Milk pricing in the United States. USDA Economic Research Service Agriculture Information Bulletin No. 761. Washington D.C. Miller JJ, Blayney DP (2006). Dairy backgrounder. Online. Accessed November 28, 2013. National Agricultural Statistics Service (2013). USDA/National Agricultural Statistics Service Quick Stats Database. Online database. Accessed July 2014. Shields DA (2009). Dairy Pricing Issues. Congressional Research Service. R40903.Washington D.C. Shields DA (2010). Consolidation and concentration in the US dairy industry. Congressional Research Service. R41224.Washington D.C. USDA Farm Service Agency 2014 Farm Bill – Fact Sheet (2016).Margin Protection Program for Dairy. Website: https://www.fsa.usda.gov/programs-and-services/Dairy- MPP/index Accessed August 2016. Weersink A, Howard W (1990) Regional adjustment response in the US dairy sector to changes in milk support price. Western Journal of Agricultural Economics. 13-21. Weersink A, Tauer LW (1990). Regional and temporal impacts of technical change in the U.S. dairy sector. American Journal of Agricultural Economics.72: 923– 934.