Educating Farmers About The 2008 Farm Bill
•
0 likes•135 views

Brunyis*, C.L.1, Barker, J.2, Dugan, D.3, Gastier, M.4, Johnson, J.5, Lopshire, J.6, Woodruff, J.7, Farley, L.8 1 Extension Educator, OSU Extension, Wyandot County, Upper Sandusky, Ohio 43351 2 Extension Educator, OSU Extension, Knox County, 3 Extension Educator, OSU Extension, Brown County, Georgetown, Ohio 4 Extension Educator, OSU Extension, Huron County, 5 Extension Educator, OSU Extension, Clark County, 6 Extension Educator, OSU Extension, Paulding County, Paulding, Ohio 7 Extension Educator, OSU Extension, Erie County, Sandusky, Ohio 8 Extension Program Assistant, OSU Extension, Clermont County, Owensville, Ohio
Recommended

Recommended
More Related Content
Similar to Educating Farmers About The 2008 Farm Bill
Similar to Educating Farmers About The 2008 Farm Bill (20)
More from nacaa
More from nacaa (20)
Recently uploaded
Recently uploaded (20)
Educating Farmers About The 2008 Farm Bill
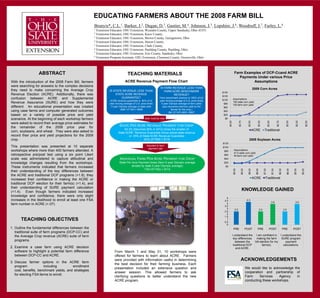
- 1. EDUCATING FARMERS ABOUT THE 2008 FARM BILL Brunyis*, C.L.1, Barker, J.2, Dugan, D.3, Gastier, M.4, Johnson, J.5, Lopshire, J.6, Woodruff, J.7, Farley, L.8 1 Extension Educator, OSU Extension, Wyandot County, Upper Sandusky, Ohio 43351 2 Extension Educator, OSU Extension, Knox County, 3 Extension Educator, OSU Extension, Brown County, Georgetown, Ohio 4 Extension Educator, OSU Extension, Huron County, 5 Extension Educator, OSU Extension, Clark County, 6 Extension Educator, OSU Extension, Paulding County, Paulding, Ohio 7 Extension Educator, OSU Extension, Erie County, Sandusky, Ohio 8 Extension Program Assistant, OSU Extension, Clermont County, Owensville, Ohio  Farm Examples of DCP-Ccand ACRE Payments Under various Price Assumptions ABSTRACT With the introduction of the 2008 Farm Bill, farmers were searching for answers to the complex decisions they need to make concerning the Average Crop Revenue Election (ACRE). Additionally, there was confusion between ACRE and Supplemental Revenue Assurance (SURE) and how they were different. An educational presentation was created using case farms and computer generated outcomes based on a variety of possible price and yield scenarios. At the beginning of each workshop farmers were asked to record their average price estimates for the remainder of the 2008 price year for corn, soybeans, and wheat. They were also asked to record their price and yield projections for the 2009 crop. This presentation was presented at 10 separate workshops where more than 400 farmers attended. A retrospective pre/post test using a six point Likert scale was administered to capture attitudinal and knowledge changes resulting from the workshops. These instruments indicated that farmers increased their understanding of the key differences between the ACRE and traditional DCP programs (+1.8), they increased their confidence in making the ACRE or traditional DCP election for their farm(s) (+1.4), and their understanding of SURE payment calculation (+1.4). Even though farmers indicated increased knowledge and confidence, there were only slight increases in the likelihood to enroll at least one FSA farm number in ACRE (+.07). TEACHING MATERIALS ACRE Revenue Payment Flow Chart IS STATE REVENUE LESS THAN STATE ACRE REVENUE GUARANTEE? ACRE revenue guarantee is 90% of (2 year moving average of U.S. price times 5 year Olympic average of state yield .9($4.13*150) = $558 IS FARM REVENUE LESS THAN FARM ACRE BENCHMARK REVENUE? Farm benchmark revenue is 100% of ((2 year moving average of U.S. price times 5 year Olympic average of farm yield) plus insurance premium paid by the farmer for the crop.) ($4.13*147)+$20 = $627 Both must be met! State Per Acre Revenue Payment for Crop 83.3% (becomes 85% in 2012) times the smaller of State ACRE Revenue Guarantee minus actual state revenue or 25% of State ACRE Revenue Guarantee .833(.25*558) = $116 Adjusted to farm payment rate Assumptions 47.5 state corn yield 45 farm corn yield Individual Farm Per Acre Payment for Crop State Per Acre Payment times (farm 5 year Olympic average divided by state 5 year Olympic average) 116(147/150) = $114 KNOWLEDGE GAINED TEACHING OBJECTIVES Outline the fundamental differences between the traditional suite of farm programs (DCP-CC) and the Average Crop revenue (ACRE) suite of farm programs. Examine a case farm using ACRE decision software to highlight a potential farm difference between DCP-CC and ACRE. Discuss farmer options in the ACRE farm program including enrollment cost, benefits, benchmark yields, and strategies for electing FSA farms to enroll. From March 1 and May 31, 10 workshops were offered for farmers to learn about ACRE. Farmers were provided with information useful in determining the best decision for their farming business. Each presentation included an extensive question and answer session. This allowed farmers to ask clarifying questions to better understand the new ACRE program. ACKNOWLEDGEMENTS We would like to acknowledge the cooperation and partnership of Farm Services Agency in conducting these workshops.