SlideShare a Scribd company logo
1 of 7
Download to read offline
Milk prices and production costs world wide
By Torsten Hemme and all dairy researchers participating in the IFCN 2015, info@ifcndairy.org
Introduction
In 2014, milk production of 778 million ton ECM (energy corrected milk with 4% fat and 3.3%
proteins) was produced by around 121.5 million dairy farms (IFCN estimate) keeping 363
million milking cows and buffaloes. This means that the world’s average farmer keeps 2.9
milk animals with an average annual milk yield of approximately 2.145 ton ECM/animal/year.
Of course, building averages is an oversimplification. There is a wide range of dairy farms in
the world keeping mostly less than 3 cows per farm on the one hand and on the other hand
in some countries, dairy farms are much bigger and keep over 1000 cows per farm. The
simple example shows that milk production is performed distinctively in different countries
and their dairy regions. The dairy farming systems differ significantly in terms of farm size,
housing, milking and feeding systems.
This article follows the approach of the IFCN Dairy Research Network (IFCN). It is a global
network of dairy researchers from 100 countries. The network focuses on dairy economic
analysis to create a better understanding of the dairy world. The main focus is in analysing
global milk production trends, milk prices and production costs. The IFCN work is
coordinated by the IFCN Dairy Research Centre located in Kiel, Germany
(www.ifcndairy.org).
Milk and feed prices development 1996 – 2015
The graphs in chart 1 below describe the development of the world market prices for milk
and feed. The world milk prices are based on the weighted average of three IFCN world price
indicators: skim milk powder & butter (35%); cheese & whey (45%) and whole milk powder
(20%). The IFCN world feed price indicator represents the world market price level for feed.
The calculated feed price indicator is based on the price for a diet comprising 70% corn
(energy feed) and 30% soybean meal (protein feed). The milk: feed price ratio indicates how
much feed a dairy farmer receiving global milk prices and paying global feed prices can buy,
after selling one kg of milk. The ratio is defined as favourable, when it is >=1.5 and in general
one can conclude that the higher the ratio, the more favourable intensive feeding is
considered.
Besides, this commonly used milk: feed price ratio, IFCN has developed a new farm
economic indicator. This is the margin over compound feed costs. This indicator assumes an
average feed intensity of 300 g compound feed per 1 kg milk. This feed intensity could
represent a farm with a milk yield of 8000 kg milk / cow / year using 2.4 ton of compound
feed per year. The key improvement is that the milk : feed price ratio weighs milk and feed
price changes one to one, whereas the margin indicator weighs the feed price based on the
amount of compound feed fed per kg milk and weather related uncertainties. This enables us
to give a better assessment of existing farm economics situation in real time.
Since 2007, the milk price indicator showed a rollercoaster behaviour, swinging between less
than 20 US-$ per 100 kg ECM (energy corrected milk with 4% fat, 3.3% protein) to peaks of
56 US-$. Low milk prices of less than 25 US-$/100 kg ECM throughout 2006 were followed
by a steep increase to more than 50 US-$ at the end of 2007, just to be followed by a sharp
decrease to 20 US-$ in early 2009. Between January 2010 and January 2013, fluctuations
were less extreme. During this period, the milk price varied around 40 US-$, with a range
between 48 US-$ in March 2011 and 34 US-$ in July 2012. This low point was followed by a
strong increase to a level above 50 US-$ for nearly a year, peaking at 56 US-$ in February
2014. The ensuing decline was not finished in August 2015. By that time, the milk price had
dropped by approximately 35 US-$ to 21.4 US-$ within 18 months.
The feed price indicator also showed fluctuations, though to a lesser extent than the milk
price indicator. Besides, their behaviour was not synchronised, i.e. peaks in the milk price did
not necessarily mean peaks in the feed price. Until 2010, the feed price hovered around 20
US-$ with the exemption of June 2008, where it reached 32.2 US-$. Between January 2011
and June 2014, the feed price was generally higher than 20 US-$. In August 2011, the
threshold of 40 US-$ was surpassed for one month. Since June 2014, the feed price has
declined by more than 10 US-$ to 22 US-$. The highest difference between milk and feed
price was noticed in August 2007 at 33.8 US-$. This led to a milk : feed price ratio of 2.9 The
very low milk prices in the first half of 2009, summer 2012 and summer 2015 were
accompanied by feed prices that were actually higher per 100 kg, causing a milk : feed price
ratio below one during these three time periods.
Chart 1. World milk prices for milk and feed 2006 – September 2015
The very high milk : feed price ratio in August 2007 followed by low milk and high feed prices
quickly led from a very profitable situation in the end of 2007 to a negative margin over
compound feed cost by the end of 2008. It was the beginning of the first global dairy crisis
which lasted until early 2010 with the lowest milk prices on the level of 20 US$/100kg ECM.
The next phase was a period of relative stability of the milk price on average of 40
US$/100kg ECM. Later in 2011 milk price begin to decrease while feed price continued to
rise pushing dairy farmers to produce milk with a milk : feed ratio below the long-term
average. In this period margin over compound feed cost was lowering since March 2011,
dipping below the long term average of 32.4 US$/100kg at the end of the year. That was the
beginning of the second global dairy crisis which has it epicentre in middle 2012 when milk
prices dropped and feed prices rose towards new highs until the middle of the year.
From the IFCN perspective, the margin over compound feed indicator better describes dairy
farm economics, since it considers the feed intensity and weather condition anomalies. It
also enables us to assess the intensity and depth of farm economics situations. The margin
over compound feed cost demonstrates farm economics after having taken into account the
milk and compound feed prices given. For farming systems which operate at a lower milk
yield and lower use of compound feed per kg milk, the fluctuation of the margin over
compound feed is generally only influenced by milk price developments. On the other hand,
dairy farming systems with much higher milk yields and higher compound feed use are
strongly driven by a combination of milk and compound feed price, especially when exposed
to world market prices.
farm economics:
very good good poor very poor
The year 2015 shows the milk prices dipping to the lowest levels since 2009 in July touching
the 23.2 US-$ mark – the climax point of third global dairy crisis. Observing the world milk
price development and the drop of 59% vs February 2014, IFCN assumes that the world milk
price is currently in the middle phase of the roller-coaster price scenario – similar to the one
from the first world crises in 2009. August world milk price shows an increase of 4%. Despite
the world milk price increase of 10% and the world feed price decrease of 6% in September
vs August, the farm economics didn’t improve significantly. September margin over
compound feed cost is at the level of 20 US-$/100kg. This is the 6th month in a row of very
poor farm economics. Country-wise the farm economics situation is deteriorating. From 60
countries analysed 46 are in the group of poor and very poor farm economics.
Cost of milk production 2014 by world region
The annual IFCN work of comparing typical farms around the world has been an on-going
process since the year 2000. Since then, the number of countries participating has increased
from 8 to 55. Moreover, the number of dairy farm types analysed has increased from 21 to
around 170.
The IFCN methodology applied for data collection, economic analysis and results validation
uses the three elements:
 a network approach of research continuously co-operating,
 the concept of typical farms described below and
 a standard model TIPI-CAL (Technology Impact Policy Impact Calculation model) to
ensure technical comparability of indicators.
A typical farm represents the most common production system which produces a significant
proportion of milk in a country or a region. Usually, two farm types are used per dairy region
– the first represents an average farm and the second a larger farm type. The typical farms
were built and validated by a combination of accounting statistics and a panel of dairy
experts. The data collection and validation were done by researchers in the represented
countries, researchers in the IFCN Dairy Research Network and also during the IFCN Dairy
Conference held in Germany in June 2015.
ECM correction: As the dairy farms operate with milk of very different fat/protein content,
the IFCN uses the energy correct milk (ECM) approach to standardise milk volumes to 4%
fat and 3.3% protein. The following formula was used: ECM milk = (milk production * (0.383 *
% fat + 0.242 * % protein + 0.7832) / 3.1138).
Cost indicator: The IFCN uses the indicator cost of milk production only which can be
directly related to a milk price. This cost includes all costs from the profit & loss account of
the farm. From this cost level, the non-milk returns from sales of cull cows, heifers, calves,
manure, etc. and also returns from coupled direct payments have been deducted.
Furthermore, the opportunity costs for own labour, land and capital are also included. For
creation of the world map, the average size farm from each country was used.
In chart 2 below, a simplified global overview on costs of milk production is shown. The
illustration is based on the results of the typical average sized farm analysed per country in
2014. The results can be summarised as follows:
Chart 2: 2014 Cost of milk production on average sized farms
Cost range: Cost of milk production ranges from 4.5 US-$ per 100 kg milk in extensive
farming systems in Cameroon (where beef is the major output and milk is a side product) to
118 US-$ for an average sized farm in Switzerland. The average cost over all countries
analysed was 46 US-$/100 kg milk.
Low cost regions: Based on the average sized farms, three low cost regions have been
identified: a) Argentina, Peru, Chile and Uruguay b) Central and Eastern Africa c) Some
farms in the CEEC. Some selected countries in Asia (except Japan and large farms from
China) also have low costs.
Western Europe: The leading farms in Western Europe had costs ranging from 45 – 55 US-
$.
The US: The smaller farm types in the Eastern Region of USA i.e. Wisconsin and New York
had a cost of 46 and 59 US-$, respectively. In the western region, the large farm in Idaho
had the lowest cost of about 35 US-$.
Oceania: The cost level in Oceania was about 36.6 US-$. Cost of milk production in
Australia is in the range of 30-35 US-$ while in New Zealand it is about 41-42 US-$ per 100
kg ECM. The difference is mainly on account of higher feed prices, land costs and exchange
rates to US-$. It is important to note that New Zealand cost estimates refer to the seasonal
year i.e. July 2013- June 2014.
In the year 2014, the cost of milk production (in national currency terms) stayed constant in
most dairy farms in the world compared to 2013. Major changes in feed costs could not be
seen in most countries. The milk price experienced a rollercoaster ride in 2014, from
reaching the highest level ever in February 2014 to a steep decrease in December 2014
which continued in 2015. On average for the whole year 2014 though, the farm gate milk
price reached the same level as in the year before or even experienced an increase, e.g. in
the USA. Therefore, farm profitability proved to be better in 2014 than in 2013, but the
downwards trend at the end of 2014 gave already an indication that a difficult situation might
follow in 2015.
Hence, on an average, the milk prices for the year 2014 were at similar levels as in
2013. This along with good feed prices made farm economics a very profitable year for
many dairy farmers in the world.
Costs range in US$/100 kg
ECM (4%fat; 3.3% protein)
Cost of milk production developments 2000 – 2014
It is very important to understand the average cost trends of typical farms over a period of
time to understand the factors behind the competitiveness of milk production. It also enables
us to take a view on the levels of milk production costs to sustain milk supply levels or the
milk prices level in the short and medium term. Hence, in this part of the analysis, we tend to
compare the cost trends of average typical farm types from the six major milk producing
nations representing the major regions of the world.
Chart 3: Cost of milk production 2000 – 2014 of typical dairy farm
types in 6 countries
Legend on farm types: US-500WI: 500 Cow family farm in Wisconsin; DE-126N: 126 cow family farm
in Germany-North; PL-65: 65 cow family farm in Poland; AR-170: 170 cow family farm in Argentina;
NZ-390: 390 family farm in New Zealand; CN-340BE: 340 corporate farm I North China, Beijing.
Cost developments for the typical farms 2000 – 2014
Germany (DE-126N): This farm type stands for an average farm in Northern Germany
representing an estimated 13% of the farms and 46% of cows in the country. The farm has
grown from 68 cows in 2000 to 126 cows in 2014 at an average annual growth rate of
4.5%.In the year 2000, the costs were 28 US-$/100 kg milk and increased towards 42 US$
per 100 kg milk in 2006. The key driver was the appreciation of the Euro (+36%) and
moderate increase of costs in Euro terms. From 2008 – 2012, the costs showed a declining
trend towards 42 US-$ per 100 kg milk. The key drivers were a devaluation of the Euro by
14%. Costs have increased again to 50 US-$ since then. This is mainly due to higher feed
and energy prices and labour costs in Euro terms.
Poland (PL-65): This farm type represents a larger family farm type in Poland in the range of
20-100 cows. It represents about 10% of the farms and 41% of the cows in the country. This
farm has been monitored since 2003 when it had 60 cows. This Polish farm had very low
costs in 2003 and 2004 and was almost as cost competitive as dairy farms in New Zealand.
After joining the EU, costs increased from 17 US-$ to 53 US-$ per 100 kg milk in 2008. This
was driven by an increase of wages, land prices and an appreciated currency against the
Euro. This increase could not been compensated by an increasing farm productivity. After
2008, the farm type followed a similar cost trend as the German dairy farm. The 20%
reduction in costs in 2012 was a result of the devaluation of the Zloty (-7%) and
improvements in farm efficiency. Costs stayed under the 40 US-$ mark for the last three
years.
USA (US-500WI): This farm type is a larger family farm in the range of 200-1000 cows and
represents 10% of the farms and about 18% of the cows in the USA. This farm has been in
our data base since 2000.In the US, costs were relatively stable from 2000 to 2006 as
inflation driven change of input prices could be compensated by increasing milk yields. Once
feed prices started rising, this had a direct impact on these farms and costs, which increased
by 50% to a level of 38.5 US-$ per 100 kg milk. The sharp drop in costs in 2009 can be
interpreted as a result of very bad milk prices, when farmers tried to cut costs wherever
possible. Until the year 2012, cost had increased – mainly driven by feed prices - towards 44
US-$ per 100 kg milk. US dairy farms had a significant cost advantage over larger family
farms in Germany for over 10 years. In the year 2012, the costs were on a similar level. They
have stayed between 40 and 45 US-$ per 100 kg milk for the last four years.
China (CN 340BE): This typical farm represents 30 to 405 of the farms and is a larger farm
type in China in the range of 200-500 cows. It has been monitored since 2006 with 300 cows.
It enables us to understand the dynamics of cost trends in China. Since 2006, a strong
increase in cost due to the appreciation of the Yuan could be seen. In 2012, the Yuan had
gained value by + 25% to the US-$ compared to 2000. The costs on Chinese farms did not
drop sharply in 2009 as was observed in most other countries, because the drop in prices in
national currency was almost fully compensated by the appreciation of the Yuan. From 2010
until 2014, the rising feed prices were a strong driver for increasing cost of production.
Argentina (AR-170): This farm represents an average sized farm in Argentina in the range
of 100-500 cows which represents about 65% of the farms and 68% of the cows in the
country. The costs of a 170-cow farm in Argentina have nearly tripled since 2002.
Nevertheless, the positive trend has slowed in the last 7 years and costs have become more
volatile. This farm is a grazing farm and economics are highly dependent on weather
conditions and fodder availability. Parts of the costs decreases and increases in the recent
years can be attributed to favourable and unfavourable weather conditions.
New Zealand (NZ-390): The typical farm representing an average sized farm covers about
60% of the farms and milk production in New Zealand. This dairy farming system was a
world leader in cost competitive milk production in the year 2000. IFCN identified costs of 12
US-$ per 100 kg milk, which was the lowest cost level in those days. Driven by an increase in
input prices and an appreciating currency, costs increased to a level of 40 US-$ per 100 kg
milk in 2014. Like in Argentina, weather conditions and pasture growth had an impact on milk
yield and thus production costs per 100 kg ECM. Based on the typical farms chosen for this
analysis, the costs in New Zealand were approximately 25% higher than in Argentina and ca.
25% below the costs level in Germany in 2014.
Outlook milk production costs in 2015
The devaluation of the Euro against the US-$ has been about 20% in 2015. In Oceania the
New Zealand dollar has also depreciated by about 11%. In Brazil, the currency devaluated
by 28% while in Poland by 17%. This will probably make the costs competitive in this part of
the world.
Milk prices began to decline from the all-time peaks in February 2014 to its lowest levels
since 2008 in July 2015 at 23.2 US-$. By July 2015, milk prices had dropped by 30-40 %.
The ensuing crisis has led farmers to respond in a way to reduce their intensity of dairy farm
operations in many countries in EU and Oceania. Though costs in USA have remained more
or less stable, costs in EU are expected to decline by currency devaluation and farmers
reactions. It is expected that the average costs of milk production will reduce in EU by a
range of 8-9 US-$ per 100 kg ECM primarily driven by euro devaluation against US-$ while in
Oceania by 5-6 US-$ due to farmers response and NZ-$ devaluation.
Details to be delivered during IFCN analysis and dairy conference in 2016 .
Summary
This article summarises the research work of the IFCN – which has been analysing dairy
farm economics since the year 2000. In the year 2015, 55 countries participated in the
annual comparison of costs of production and 100 countries participated in the country profile
analysis. The results of this article are summarised as follows:
121.5 million dairy farms on this planet keeping on average 2.9 cows per farm
Based on IFCN data collection and estimations, in 2014 there were 121.5 million dairy farms
and farming households on this planet producing 778 million ton of ECM milk (cows and
buffaloes with 4% fat and 3.3% proteins). The average dairy farm size has 2.9 milk animals
with an average milk yield of 2145 kg milk ECM / milk / animal.
2014 Costs to produce milk ranges from 4 to 128 US-$ per 100 kg milk
Based on the IFCN cost comparison, 170 typical farms in 55 countries were analysed. Cost
of milk production ranged from 4.5 US-$ per 100 kg milk in extensive farming systems in
Cameroon to 118 US-$ for an average sized farm type in Switzerland. The simple average
cost over all countries analysed was 46 US-$/100 kg milk.
From 2000 – 2014, cost of milk production increased in all countries analysed
As the IFCN has analysed typical dairy farms since the year 2000, a time series analysis was
possible. The results show that costs in a specific country can increase significantly within 3-
6 years. This is especially the case for countries like Poland, China, and New Zealand where
the value of the currency has significantly strengthened against the US-$ and farm input
price like land, feed, and labour costs have increased significantly.
Costs in EU and US reach a level of 40 – 50 $
Cost of milk production in China still significantly higher than EU and Germany
An extreme case was observed in China where dairy farming highly depends on purchased
feed. In addition, China had the strongest increase in salaries and an appreciation of the
currency of 24%. The combined effect of these factors drove the costs in China from a level
of 40 US-$ / 100 kg milk in 2008 to a level of 60 US-$/100 kg in 2014.
Very volatile milk and feed prices – we are now in the 3rd
dairy crisis since 2008
Via standardised world milk and feed prices, IFCN tracks the overall farm economic situation
for dairy farming. The IFCN developed an indicator “margin over compound feed costs”
which is a significant improvement compared to the often used milk:feed price ratio. By using
this margin, it becomes visible how much of a threat dairy farmers face in a situation when
milk prices fall and feed prices increase to such an extent that 100 kg feed are more
expensive than 100 kg ECM. This situation occurred three times within the last eight years, in
2009, in 2012 and most recently in the beginning of 2015.
2015 perspectives of production costs to decrease in US-$ terms
1. The cost analysis results shown are based on 2014 data– but changes to be expected
for 2015 will be mainly driven by 2 factors: a) changes in exchange rate and b) lower
milk price which drives changes in dairy farming systems.
2. First estimation by IFCN for costs in 2015 show stable costs for USA and significant
costs reduction of 5-9 US- $ in the EU, NZ, BR, PL.
Annual benchmarking a part of strategic dairy development and milk sourcing
In times of significant change in dairy related output prices, farm input prices, and exchange
rates, it is extremely important to benchmark the competitiveness of the current dairy farming
system annually. Competitiveness means in this sense costs competitive on the market for
dairy products and also competitive on the local market for production factors especially land
and labour. Such benchmarking exercises enable all dairy stakeholders to see and react
faster to threats, but even more to anticipate opportunities which will arise.

More Related Content

What's hot

Supply chain risk process of a supermarket - Milk - Tesco
Supply chain risk process of a supermarket - Milk - TescoSupply chain risk process of a supermarket - Milk - Tesco
Supply chain risk process of a supermarket - Milk - TescoYordan Dimitrov
 
Factors affecting liquid milk consumption (2)
Factors affecting liquid milk consumption (2)Factors affecting liquid milk consumption (2)
Factors affecting liquid milk consumption (2)lahirudanu
 
Synopsis & toc potential of indian dairy industry - 2017
Synopsis & toc   potential of indian dairy industry - 2017Synopsis & toc   potential of indian dairy industry - 2017
Synopsis & toc potential of indian dairy industry - 2017Gyan Research And Analytics
 
Organic Soybean Market Report – U.S. Trade, Growth, Trends and Insights
Organic Soybean Market Report – U.S. Trade, Growth, Trends and InsightsOrganic Soybean Market Report – U.S. Trade, Growth, Trends and Insights
Organic Soybean Market Report – U.S. Trade, Growth, Trends and InsightsIndexBox Marketing
 
The internationalisation of China's market for dairy produce
The internationalisation of China's market for dairy produceThe internationalisation of China's market for dairy produce
The internationalisation of China's market for dairy produceNederlandse Ambassade te Peking
 

What's hot (6)

Supply chain risk process of a supermarket - Milk - Tesco
Supply chain risk process of a supermarket - Milk - TescoSupply chain risk process of a supermarket - Milk - Tesco
Supply chain risk process of a supermarket - Milk - Tesco
 
Food Security in 2030: Availability, Access and Nutrition
Food Security in 2030: Availability, Access and NutritionFood Security in 2030: Availability, Access and Nutrition
Food Security in 2030: Availability, Access and Nutrition
 
Factors affecting liquid milk consumption (2)
Factors affecting liquid milk consumption (2)Factors affecting liquid milk consumption (2)
Factors affecting liquid milk consumption (2)
 
Synopsis & toc potential of indian dairy industry - 2017
Synopsis & toc   potential of indian dairy industry - 2017Synopsis & toc   potential of indian dairy industry - 2017
Synopsis & toc potential of indian dairy industry - 2017
 
Organic Soybean Market Report – U.S. Trade, Growth, Trends and Insights
Organic Soybean Market Report – U.S. Trade, Growth, Trends and InsightsOrganic Soybean Market Report – U.S. Trade, Growth, Trends and Insights
Organic Soybean Market Report – U.S. Trade, Growth, Trends and Insights
 
The internationalisation of China's market for dairy produce
The internationalisation of China's market for dairy produceThe internationalisation of China's market for dairy produce
The internationalisation of China's market for dairy produce
 

Similar to Article milk prices and production costs world wide

The dairy industry in viet nam a value chain approach
The dairy industry in viet nam a value chain approachThe dairy industry in viet nam a value chain approach
The dairy industry in viet nam a value chain approachijmvsc
 
FAO - agribusiness handbook: milk
FAO - agribusiness handbook: milkFAO - agribusiness handbook: milk
FAO - agribusiness handbook: milkHernani Larrea
 
2019 08-global-fleckviehcatalogue
2019 08-global-fleckviehcatalogue2019 08-global-fleckviehcatalogue
2019 08-global-fleckviehcatalogueElvisJano
 
Leach Bulletin112 milk from forage
Leach Bulletin112 milk from forageLeach Bulletin112 milk from forage
Leach Bulletin112 milk from forageGaëlle Feur
 
Latin America Milk and Dairy Products Market Outlook to 2015 – Compelling Opp...
Latin America Milk and Dairy Products Market Outlook to 2015 – Compelling Opp...Latin America Milk and Dairy Products Market Outlook to 2015 – Compelling Opp...
Latin America Milk and Dairy Products Market Outlook to 2015 – Compelling Opp...AMMindpower
 
Milk-cost ratio
Milk-cost ratioMilk-cost ratio
Milk-cost ratioguldko
 
International Journal of Business and Management Invention (IJBMI)
International Journal of Business and Management Invention (IJBMI)International Journal of Business and Management Invention (IJBMI)
International Journal of Business and Management Invention (IJBMI)inventionjournals
 
Effect of milk price on dairy consumption in low income households in Nairobi
Effect of milk price on dairy consumption in low income households in NairobiEffect of milk price on dairy consumption in low income households in Nairobi
Effect of milk price on dairy consumption in low income households in NairobiILRI
 
Samridhi agri products private limited
Samridhi agri products private limitedSamridhi agri products private limited
Samridhi agri products private limitedprabhat_rbl
 
Global Food Security Alarm
Global Food Security AlarmGlobal Food Security Alarm
Global Food Security AlarmANM Farukh
 
The Dairy Industry In The World Economy
The Dairy Industry In The World Economy The Dairy Industry In The World Economy
The Dairy Industry In The World Economy NegesseGashu
 
FMCG- DAIRY PRODUCTS
FMCG- DAIRY PRODUCTSFMCG- DAIRY PRODUCTS
FMCG- DAIRY PRODUCTSRiya Aseef
 
Indian Dairying
Indian DairyingIndian Dairying
Indian DairyingILRI
 
Dairy cooperatives and milk marketing in india constraints and opportunities
Dairy cooperatives and milk marketing in india constraints and opportunitiesDairy cooperatives and milk marketing in india constraints and opportunities
Dairy cooperatives and milk marketing in india constraints and opportunitiesDr Vijay Pithadia Director
 
29797 66821-1-sm
29797 66821-1-sm29797 66821-1-sm
29797 66821-1-smSumit Gupta
 
Dairy economics and policy: Focus on Asia—A scoping paper under the auspices ...
Dairy economics and policy: Focus on Asia—A scoping paper under the auspices ...Dairy economics and policy: Focus on Asia—A scoping paper under the auspices ...
Dairy economics and policy: Focus on Asia—A scoping paper under the auspices ...ILRI
 
A milk marketing system for pastoralists of Kilosa district in Tanzania: mark...
A milk marketing system for pastoralists of Kilosa district in Tanzania: mark...A milk marketing system for pastoralists of Kilosa district in Tanzania: mark...
A milk marketing system for pastoralists of Kilosa district in Tanzania: mark...Premier Publishers
 

Similar to Article milk prices and production costs world wide (20)

The dairy industry in viet nam a value chain approach
The dairy industry in viet nam a value chain approachThe dairy industry in viet nam a value chain approach
The dairy industry in viet nam a value chain approach
 
FAO - agribusiness handbook: milk
FAO - agribusiness handbook: milkFAO - agribusiness handbook: milk
FAO - agribusiness handbook: milk
 
2019 08-global-fleckviehcatalogue
2019 08-global-fleckviehcatalogue2019 08-global-fleckviehcatalogue
2019 08-global-fleckviehcatalogue
 
Leach Bulletin112 milk from forage
Leach Bulletin112 milk from forageLeach Bulletin112 milk from forage
Leach Bulletin112 milk from forage
 
Latin America Milk and Dairy Products Market Outlook to 2015 – Compelling Opp...
Latin America Milk and Dairy Products Market Outlook to 2015 – Compelling Opp...Latin America Milk and Dairy Products Market Outlook to 2015 – Compelling Opp...
Latin America Milk and Dairy Products Market Outlook to 2015 – Compelling Opp...
 
Milk-cost ratio
Milk-cost ratioMilk-cost ratio
Milk-cost ratio
 
International Journal of Business and Management Invention (IJBMI)
International Journal of Business and Management Invention (IJBMI)International Journal of Business and Management Invention (IJBMI)
International Journal of Business and Management Invention (IJBMI)
 
Effect of milk price on dairy consumption in low income households in Nairobi
Effect of milk price on dairy consumption in low income households in NairobiEffect of milk price on dairy consumption in low income households in Nairobi
Effect of milk price on dairy consumption in low income households in Nairobi
 
Samridhi agri products private limited
Samridhi agri products private limitedSamridhi agri products private limited
Samridhi agri products private limited
 
Milk-sector-outcome-report_December-2014_CLP
Milk-sector-outcome-report_December-2014_CLPMilk-sector-outcome-report_December-2014_CLP
Milk-sector-outcome-report_December-2014_CLP
 
Global Food Security Alarm
Global Food Security AlarmGlobal Food Security Alarm
Global Food Security Alarm
 
The Dairy Industry In The World Economy
The Dairy Industry In The World Economy The Dairy Industry In The World Economy
The Dairy Industry In The World Economy
 
FMCG- DAIRY PRODUCTS
FMCG- DAIRY PRODUCTSFMCG- DAIRY PRODUCTS
FMCG- DAIRY PRODUCTS
 
Indian Dairying
Indian DairyingIndian Dairying
Indian Dairying
 
Dairy cooperatives and milk marketing in india constraints and opportunities
Dairy cooperatives and milk marketing in india constraints and opportunitiesDairy cooperatives and milk marketing in india constraints and opportunities
Dairy cooperatives and milk marketing in india constraints and opportunities
 
29797 66821-1-sm
29797 66821-1-sm29797 66821-1-sm
29797 66821-1-sm
 
74860 sim cians
74860 sim cians74860 sim cians
74860 sim cians
 
Dairy economics and policy: Focus on Asia—A scoping paper under the auspices ...
Dairy economics and policy: Focus on Asia—A scoping paper under the auspices ...Dairy economics and policy: Focus on Asia—A scoping paper under the auspices ...
Dairy economics and policy: Focus on Asia—A scoping paper under the auspices ...
 
A milk marketing system for pastoralists of Kilosa district in Tanzania: mark...
A milk marketing system for pastoralists of Kilosa district in Tanzania: mark...A milk marketing system for pastoralists of Kilosa district in Tanzania: mark...
A milk marketing system for pastoralists of Kilosa district in Tanzania: mark...
 
Presentation
PresentationPresentation
Presentation
 

Recently uploaded

Russian Call Girls In Gurgaon ❤️8448577510 ⊹Best Escorts Service In 24/7 Delh...
Russian Call Girls In Gurgaon ❤️8448577510 ⊹Best Escorts Service In 24/7 Delh...Russian Call Girls In Gurgaon ❤️8448577510 ⊹Best Escorts Service In 24/7 Delh...
Russian Call Girls In Gurgaon ❤️8448577510 ⊹Best Escorts Service In 24/7 Delh...lizamodels9
 
Falcon's Invoice Discounting: Your Path to Prosperity
Falcon's Invoice Discounting: Your Path to ProsperityFalcon's Invoice Discounting: Your Path to Prosperity
Falcon's Invoice Discounting: Your Path to Prosperityhemanthkumar470700
 
Call Girls In Noida 959961⊹3876 Independent Escort Service Noida
Call Girls In Noida 959961⊹3876 Independent Escort Service NoidaCall Girls In Noida 959961⊹3876 Independent Escort Service Noida
Call Girls In Noida 959961⊹3876 Independent Escort Service Noidadlhescort
 
Mondelez State of Snacking and Future Trends 2023
Mondelez State of Snacking and Future Trends 2023Mondelez State of Snacking and Future Trends 2023
Mondelez State of Snacking and Future Trends 2023Neil Kimberley
 
Organizational Transformation Lead with Culture
Organizational Transformation Lead with CultureOrganizational Transformation Lead with Culture
Organizational Transformation Lead with CultureSeta Wicaksana
 
It will be International Nurses' Day on 12 May
It will be International Nurses' Day on 12 MayIt will be International Nurses' Day on 12 May
It will be International Nurses' Day on 12 MayNZSG
 
Chandigarh Escorts Service 📞8868886958📞 Just📲 Call Nihal Chandigarh Call Girl...
Chandigarh Escorts Service 📞8868886958📞 Just📲 Call Nihal Chandigarh Call Girl...Chandigarh Escorts Service 📞8868886958📞 Just📲 Call Nihal Chandigarh Call Girl...
Chandigarh Escorts Service 📞8868886958📞 Just📲 Call Nihal Chandigarh Call Girl...Sheetaleventcompany
 
Call Girls From Pari Chowk Greater Noida ❤️8448577510 ⊹Best Escorts Service I...
Call Girls From Pari Chowk Greater Noida ❤️8448577510 ⊹Best Escorts Service I...Call Girls From Pari Chowk Greater Noida ❤️8448577510 ⊹Best Escorts Service I...
Call Girls From Pari Chowk Greater Noida ❤️8448577510 ⊹Best Escorts Service I...lizamodels9
 
Uneak White's Personal Brand Exploration Presentation
Uneak White's Personal Brand Exploration PresentationUneak White's Personal Brand Exploration Presentation
Uneak White's Personal Brand Exploration Presentationuneakwhite
 
Call Girls Jp Nagar Just Call 👗 7737669865 👗 Top Class Call Girl Service Bang...
Call Girls Jp Nagar Just Call 👗 7737669865 👗 Top Class Call Girl Service Bang...Call Girls Jp Nagar Just Call 👗 7737669865 👗 Top Class Call Girl Service Bang...
Call Girls Jp Nagar Just Call 👗 7737669865 👗 Top Class Call Girl Service Bang...amitlee9823
 
A DAY IN THE LIFE OF A SALESMAN / WOMAN
A DAY IN THE LIFE OF A  SALESMAN / WOMANA DAY IN THE LIFE OF A  SALESMAN / WOMAN
A DAY IN THE LIFE OF A SALESMAN / WOMANIlamathiKannappan
 
John Halpern sued for sexual assault.pdf
John Halpern sued for sexual assault.pdfJohn Halpern sued for sexual assault.pdf
John Halpern sued for sexual assault.pdfAmzadHosen3
 
The Path to Product Excellence: Avoiding Common Pitfalls and Enhancing Commun...
The Path to Product Excellence: Avoiding Common Pitfalls and Enhancing Commun...The Path to Product Excellence: Avoiding Common Pitfalls and Enhancing Commun...
The Path to Product Excellence: Avoiding Common Pitfalls and Enhancing Commun...Aggregage
 
Business Model Canvas (BMC)- A new venture concept
Business Model Canvas (BMC)-  A new venture conceptBusiness Model Canvas (BMC)-  A new venture concept
Business Model Canvas (BMC)- A new venture conceptP&CO
 
Value Proposition canvas- Customer needs and pains
Value Proposition canvas- Customer needs and painsValue Proposition canvas- Customer needs and pains
Value Proposition canvas- Customer needs and painsP&CO
 
Dr. Admir Softic_ presentation_Green Club_ENG.pdf
Dr. Admir Softic_ presentation_Green Club_ENG.pdfDr. Admir Softic_ presentation_Green Club_ENG.pdf
Dr. Admir Softic_ presentation_Green Club_ENG.pdfAdmir Softic
 
B.COM Unit – 4 ( CORPORATE SOCIAL RESPONSIBILITY ( CSR ).pptx
B.COM Unit – 4 ( CORPORATE SOCIAL RESPONSIBILITY ( CSR ).pptxB.COM Unit – 4 ( CORPORATE SOCIAL RESPONSIBILITY ( CSR ).pptx
B.COM Unit – 4 ( CORPORATE SOCIAL RESPONSIBILITY ( CSR ).pptxpriyanshujha201
 
FULL ENJOY Call Girls In Mahipalpur Delhi Contact Us 8377877756
FULL ENJOY Call Girls In Mahipalpur Delhi Contact Us 8377877756FULL ENJOY Call Girls In Mahipalpur Delhi Contact Us 8377877756
FULL ENJOY Call Girls In Mahipalpur Delhi Contact Us 8377877756dollysharma2066
 
Monthly Social Media Update April 2024 pptx.pptx
Monthly Social Media Update April 2024 pptx.pptxMonthly Social Media Update April 2024 pptx.pptx
Monthly Social Media Update April 2024 pptx.pptxAndy Lambert
 

Recently uploaded (20)

Russian Call Girls In Gurgaon ❤️8448577510 ⊹Best Escorts Service In 24/7 Delh...
Russian Call Girls In Gurgaon ❤️8448577510 ⊹Best Escorts Service In 24/7 Delh...Russian Call Girls In Gurgaon ❤️8448577510 ⊹Best Escorts Service In 24/7 Delh...
Russian Call Girls In Gurgaon ❤️8448577510 ⊹Best Escorts Service In 24/7 Delh...
 
Falcon's Invoice Discounting: Your Path to Prosperity
Falcon's Invoice Discounting: Your Path to ProsperityFalcon's Invoice Discounting: Your Path to Prosperity
Falcon's Invoice Discounting: Your Path to Prosperity
 
Call Girls In Noida 959961⊹3876 Independent Escort Service Noida
Call Girls In Noida 959961⊹3876 Independent Escort Service NoidaCall Girls In Noida 959961⊹3876 Independent Escort Service Noida
Call Girls In Noida 959961⊹3876 Independent Escort Service Noida
 
Mondelez State of Snacking and Future Trends 2023
Mondelez State of Snacking and Future Trends 2023Mondelez State of Snacking and Future Trends 2023
Mondelez State of Snacking and Future Trends 2023
 
Falcon Invoice Discounting platform in india
Falcon Invoice Discounting platform in indiaFalcon Invoice Discounting platform in india
Falcon Invoice Discounting platform in india
 
Organizational Transformation Lead with Culture
Organizational Transformation Lead with CultureOrganizational Transformation Lead with Culture
Organizational Transformation Lead with Culture
 
It will be International Nurses' Day on 12 May
It will be International Nurses' Day on 12 MayIt will be International Nurses' Day on 12 May
It will be International Nurses' Day on 12 May
 
Chandigarh Escorts Service 📞8868886958📞 Just📲 Call Nihal Chandigarh Call Girl...
Chandigarh Escorts Service 📞8868886958📞 Just📲 Call Nihal Chandigarh Call Girl...Chandigarh Escorts Service 📞8868886958📞 Just📲 Call Nihal Chandigarh Call Girl...
Chandigarh Escorts Service 📞8868886958📞 Just📲 Call Nihal Chandigarh Call Girl...
 
Call Girls From Pari Chowk Greater Noida ❤️8448577510 ⊹Best Escorts Service I...
Call Girls From Pari Chowk Greater Noida ❤️8448577510 ⊹Best Escorts Service I...Call Girls From Pari Chowk Greater Noida ❤️8448577510 ⊹Best Escorts Service I...
Call Girls From Pari Chowk Greater Noida ❤️8448577510 ⊹Best Escorts Service I...
 
Uneak White's Personal Brand Exploration Presentation
Uneak White's Personal Brand Exploration PresentationUneak White's Personal Brand Exploration Presentation
Uneak White's Personal Brand Exploration Presentation
 
Call Girls Jp Nagar Just Call 👗 7737669865 👗 Top Class Call Girl Service Bang...
Call Girls Jp Nagar Just Call 👗 7737669865 👗 Top Class Call Girl Service Bang...Call Girls Jp Nagar Just Call 👗 7737669865 👗 Top Class Call Girl Service Bang...
Call Girls Jp Nagar Just Call 👗 7737669865 👗 Top Class Call Girl Service Bang...
 
A DAY IN THE LIFE OF A SALESMAN / WOMAN
A DAY IN THE LIFE OF A  SALESMAN / WOMANA DAY IN THE LIFE OF A  SALESMAN / WOMAN
A DAY IN THE LIFE OF A SALESMAN / WOMAN
 
John Halpern sued for sexual assault.pdf
John Halpern sued for sexual assault.pdfJohn Halpern sued for sexual assault.pdf
John Halpern sued for sexual assault.pdf
 
The Path to Product Excellence: Avoiding Common Pitfalls and Enhancing Commun...
The Path to Product Excellence: Avoiding Common Pitfalls and Enhancing Commun...The Path to Product Excellence: Avoiding Common Pitfalls and Enhancing Commun...
The Path to Product Excellence: Avoiding Common Pitfalls and Enhancing Commun...
 
Business Model Canvas (BMC)- A new venture concept
Business Model Canvas (BMC)-  A new venture conceptBusiness Model Canvas (BMC)-  A new venture concept
Business Model Canvas (BMC)- A new venture concept
 
Value Proposition canvas- Customer needs and pains
Value Proposition canvas- Customer needs and painsValue Proposition canvas- Customer needs and pains
Value Proposition canvas- Customer needs and pains
 
Dr. Admir Softic_ presentation_Green Club_ENG.pdf
Dr. Admir Softic_ presentation_Green Club_ENG.pdfDr. Admir Softic_ presentation_Green Club_ENG.pdf
Dr. Admir Softic_ presentation_Green Club_ENG.pdf
 
B.COM Unit – 4 ( CORPORATE SOCIAL RESPONSIBILITY ( CSR ).pptx
B.COM Unit – 4 ( CORPORATE SOCIAL RESPONSIBILITY ( CSR ).pptxB.COM Unit – 4 ( CORPORATE SOCIAL RESPONSIBILITY ( CSR ).pptx
B.COM Unit – 4 ( CORPORATE SOCIAL RESPONSIBILITY ( CSR ).pptx
 
FULL ENJOY Call Girls In Mahipalpur Delhi Contact Us 8377877756
FULL ENJOY Call Girls In Mahipalpur Delhi Contact Us 8377877756FULL ENJOY Call Girls In Mahipalpur Delhi Contact Us 8377877756
FULL ENJOY Call Girls In Mahipalpur Delhi Contact Us 8377877756
 
Monthly Social Media Update April 2024 pptx.pptx
Monthly Social Media Update April 2024 pptx.pptxMonthly Social Media Update April 2024 pptx.pptx
Monthly Social Media Update April 2024 pptx.pptx
 

Article milk prices and production costs world wide

  • 1. Milk prices and production costs world wide By Torsten Hemme and all dairy researchers participating in the IFCN 2015, info@ifcndairy.org Introduction In 2014, milk production of 778 million ton ECM (energy corrected milk with 4% fat and 3.3% proteins) was produced by around 121.5 million dairy farms (IFCN estimate) keeping 363 million milking cows and buffaloes. This means that the world’s average farmer keeps 2.9 milk animals with an average annual milk yield of approximately 2.145 ton ECM/animal/year. Of course, building averages is an oversimplification. There is a wide range of dairy farms in the world keeping mostly less than 3 cows per farm on the one hand and on the other hand in some countries, dairy farms are much bigger and keep over 1000 cows per farm. The simple example shows that milk production is performed distinctively in different countries and their dairy regions. The dairy farming systems differ significantly in terms of farm size, housing, milking and feeding systems. This article follows the approach of the IFCN Dairy Research Network (IFCN). It is a global network of dairy researchers from 100 countries. The network focuses on dairy economic analysis to create a better understanding of the dairy world. The main focus is in analysing global milk production trends, milk prices and production costs. The IFCN work is coordinated by the IFCN Dairy Research Centre located in Kiel, Germany (www.ifcndairy.org). Milk and feed prices development 1996 – 2015 The graphs in chart 1 below describe the development of the world market prices for milk and feed. The world milk prices are based on the weighted average of three IFCN world price indicators: skim milk powder & butter (35%); cheese & whey (45%) and whole milk powder (20%). The IFCN world feed price indicator represents the world market price level for feed. The calculated feed price indicator is based on the price for a diet comprising 70% corn (energy feed) and 30% soybean meal (protein feed). The milk: feed price ratio indicates how much feed a dairy farmer receiving global milk prices and paying global feed prices can buy, after selling one kg of milk. The ratio is defined as favourable, when it is >=1.5 and in general one can conclude that the higher the ratio, the more favourable intensive feeding is considered. Besides, this commonly used milk: feed price ratio, IFCN has developed a new farm economic indicator. This is the margin over compound feed costs. This indicator assumes an average feed intensity of 300 g compound feed per 1 kg milk. This feed intensity could represent a farm with a milk yield of 8000 kg milk / cow / year using 2.4 ton of compound feed per year. The key improvement is that the milk : feed price ratio weighs milk and feed price changes one to one, whereas the margin indicator weighs the feed price based on the amount of compound feed fed per kg milk and weather related uncertainties. This enables us to give a better assessment of existing farm economics situation in real time. Since 2007, the milk price indicator showed a rollercoaster behaviour, swinging between less than 20 US-$ per 100 kg ECM (energy corrected milk with 4% fat, 3.3% protein) to peaks of 56 US-$. Low milk prices of less than 25 US-$/100 kg ECM throughout 2006 were followed by a steep increase to more than 50 US-$ at the end of 2007, just to be followed by a sharp decrease to 20 US-$ in early 2009. Between January 2010 and January 2013, fluctuations were less extreme. During this period, the milk price varied around 40 US-$, with a range between 48 US-$ in March 2011 and 34 US-$ in July 2012. This low point was followed by a strong increase to a level above 50 US-$ for nearly a year, peaking at 56 US-$ in February 2014. The ensuing decline was not finished in August 2015. By that time, the milk price had dropped by approximately 35 US-$ to 21.4 US-$ within 18 months.
  • 2. The feed price indicator also showed fluctuations, though to a lesser extent than the milk price indicator. Besides, their behaviour was not synchronised, i.e. peaks in the milk price did not necessarily mean peaks in the feed price. Until 2010, the feed price hovered around 20 US-$ with the exemption of June 2008, where it reached 32.2 US-$. Between January 2011 and June 2014, the feed price was generally higher than 20 US-$. In August 2011, the threshold of 40 US-$ was surpassed for one month. Since June 2014, the feed price has declined by more than 10 US-$ to 22 US-$. The highest difference between milk and feed price was noticed in August 2007 at 33.8 US-$. This led to a milk : feed price ratio of 2.9 The very low milk prices in the first half of 2009, summer 2012 and summer 2015 were accompanied by feed prices that were actually higher per 100 kg, causing a milk : feed price ratio below one during these three time periods. Chart 1. World milk prices for milk and feed 2006 – September 2015 The very high milk : feed price ratio in August 2007 followed by low milk and high feed prices quickly led from a very profitable situation in the end of 2007 to a negative margin over compound feed cost by the end of 2008. It was the beginning of the first global dairy crisis which lasted until early 2010 with the lowest milk prices on the level of 20 US$/100kg ECM. The next phase was a period of relative stability of the milk price on average of 40 US$/100kg ECM. Later in 2011 milk price begin to decrease while feed price continued to rise pushing dairy farmers to produce milk with a milk : feed ratio below the long-term average. In this period margin over compound feed cost was lowering since March 2011, dipping below the long term average of 32.4 US$/100kg at the end of the year. That was the beginning of the second global dairy crisis which has it epicentre in middle 2012 when milk prices dropped and feed prices rose towards new highs until the middle of the year. From the IFCN perspective, the margin over compound feed indicator better describes dairy farm economics, since it considers the feed intensity and weather condition anomalies. It also enables us to assess the intensity and depth of farm economics situations. The margin over compound feed cost demonstrates farm economics after having taken into account the milk and compound feed prices given. For farming systems which operate at a lower milk yield and lower use of compound feed per kg milk, the fluctuation of the margin over compound feed is generally only influenced by milk price developments. On the other hand, dairy farming systems with much higher milk yields and higher compound feed use are strongly driven by a combination of milk and compound feed price, especially when exposed to world market prices. farm economics: very good good poor very poor
  • 3. The year 2015 shows the milk prices dipping to the lowest levels since 2009 in July touching the 23.2 US-$ mark – the climax point of third global dairy crisis. Observing the world milk price development and the drop of 59% vs February 2014, IFCN assumes that the world milk price is currently in the middle phase of the roller-coaster price scenario – similar to the one from the first world crises in 2009. August world milk price shows an increase of 4%. Despite the world milk price increase of 10% and the world feed price decrease of 6% in September vs August, the farm economics didn’t improve significantly. September margin over compound feed cost is at the level of 20 US-$/100kg. This is the 6th month in a row of very poor farm economics. Country-wise the farm economics situation is deteriorating. From 60 countries analysed 46 are in the group of poor and very poor farm economics. Cost of milk production 2014 by world region The annual IFCN work of comparing typical farms around the world has been an on-going process since the year 2000. Since then, the number of countries participating has increased from 8 to 55. Moreover, the number of dairy farm types analysed has increased from 21 to around 170. The IFCN methodology applied for data collection, economic analysis and results validation uses the three elements:  a network approach of research continuously co-operating,  the concept of typical farms described below and  a standard model TIPI-CAL (Technology Impact Policy Impact Calculation model) to ensure technical comparability of indicators. A typical farm represents the most common production system which produces a significant proportion of milk in a country or a region. Usually, two farm types are used per dairy region – the first represents an average farm and the second a larger farm type. The typical farms were built and validated by a combination of accounting statistics and a panel of dairy experts. The data collection and validation were done by researchers in the represented countries, researchers in the IFCN Dairy Research Network and also during the IFCN Dairy Conference held in Germany in June 2015. ECM correction: As the dairy farms operate with milk of very different fat/protein content, the IFCN uses the energy correct milk (ECM) approach to standardise milk volumes to 4% fat and 3.3% protein. The following formula was used: ECM milk = (milk production * (0.383 * % fat + 0.242 * % protein + 0.7832) / 3.1138). Cost indicator: The IFCN uses the indicator cost of milk production only which can be directly related to a milk price. This cost includes all costs from the profit & loss account of the farm. From this cost level, the non-milk returns from sales of cull cows, heifers, calves, manure, etc. and also returns from coupled direct payments have been deducted. Furthermore, the opportunity costs for own labour, land and capital are also included. For creation of the world map, the average size farm from each country was used. In chart 2 below, a simplified global overview on costs of milk production is shown. The illustration is based on the results of the typical average sized farm analysed per country in 2014. The results can be summarised as follows:
  • 4. Chart 2: 2014 Cost of milk production on average sized farms Cost range: Cost of milk production ranges from 4.5 US-$ per 100 kg milk in extensive farming systems in Cameroon (where beef is the major output and milk is a side product) to 118 US-$ for an average sized farm in Switzerland. The average cost over all countries analysed was 46 US-$/100 kg milk. Low cost regions: Based on the average sized farms, three low cost regions have been identified: a) Argentina, Peru, Chile and Uruguay b) Central and Eastern Africa c) Some farms in the CEEC. Some selected countries in Asia (except Japan and large farms from China) also have low costs. Western Europe: The leading farms in Western Europe had costs ranging from 45 – 55 US- $. The US: The smaller farm types in the Eastern Region of USA i.e. Wisconsin and New York had a cost of 46 and 59 US-$, respectively. In the western region, the large farm in Idaho had the lowest cost of about 35 US-$. Oceania: The cost level in Oceania was about 36.6 US-$. Cost of milk production in Australia is in the range of 30-35 US-$ while in New Zealand it is about 41-42 US-$ per 100 kg ECM. The difference is mainly on account of higher feed prices, land costs and exchange rates to US-$. It is important to note that New Zealand cost estimates refer to the seasonal year i.e. July 2013- June 2014. In the year 2014, the cost of milk production (in national currency terms) stayed constant in most dairy farms in the world compared to 2013. Major changes in feed costs could not be seen in most countries. The milk price experienced a rollercoaster ride in 2014, from reaching the highest level ever in February 2014 to a steep decrease in December 2014 which continued in 2015. On average for the whole year 2014 though, the farm gate milk price reached the same level as in the year before or even experienced an increase, e.g. in the USA. Therefore, farm profitability proved to be better in 2014 than in 2013, but the downwards trend at the end of 2014 gave already an indication that a difficult situation might follow in 2015. Hence, on an average, the milk prices for the year 2014 were at similar levels as in 2013. This along with good feed prices made farm economics a very profitable year for many dairy farmers in the world. Costs range in US$/100 kg ECM (4%fat; 3.3% protein)
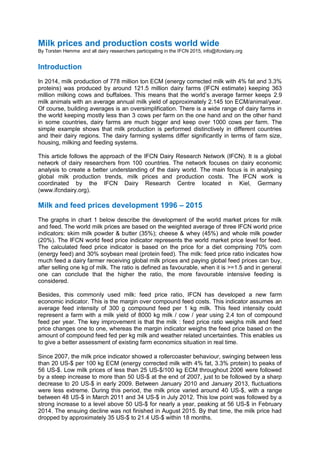
  • 5. Cost of milk production developments 2000 – 2014 It is very important to understand the average cost trends of typical farms over a period of time to understand the factors behind the competitiveness of milk production. It also enables us to take a view on the levels of milk production costs to sustain milk supply levels or the milk prices level in the short and medium term. Hence, in this part of the analysis, we tend to compare the cost trends of average typical farm types from the six major milk producing nations representing the major regions of the world. Chart 3: Cost of milk production 2000 – 2014 of typical dairy farm types in 6 countries Legend on farm types: US-500WI: 500 Cow family farm in Wisconsin; DE-126N: 126 cow family farm in Germany-North; PL-65: 65 cow family farm in Poland; AR-170: 170 cow family farm in Argentina; NZ-390: 390 family farm in New Zealand; CN-340BE: 340 corporate farm I North China, Beijing. Cost developments for the typical farms 2000 – 2014 Germany (DE-126N): This farm type stands for an average farm in Northern Germany representing an estimated 13% of the farms and 46% of cows in the country. The farm has grown from 68 cows in 2000 to 126 cows in 2014 at an average annual growth rate of 4.5%.In the year 2000, the costs were 28 US-$/100 kg milk and increased towards 42 US$ per 100 kg milk in 2006. The key driver was the appreciation of the Euro (+36%) and moderate increase of costs in Euro terms. From 2008 – 2012, the costs showed a declining trend towards 42 US-$ per 100 kg milk. The key drivers were a devaluation of the Euro by 14%. Costs have increased again to 50 US-$ since then. This is mainly due to higher feed and energy prices and labour costs in Euro terms. Poland (PL-65): This farm type represents a larger family farm type in Poland in the range of 20-100 cows. It represents about 10% of the farms and 41% of the cows in the country. This farm has been monitored since 2003 when it had 60 cows. This Polish farm had very low costs in 2003 and 2004 and was almost as cost competitive as dairy farms in New Zealand. After joining the EU, costs increased from 17 US-$ to 53 US-$ per 100 kg milk in 2008. This was driven by an increase of wages, land prices and an appreciated currency against the Euro. This increase could not been compensated by an increasing farm productivity. After 2008, the farm type followed a similar cost trend as the German dairy farm. The 20%
  • 6. reduction in costs in 2012 was a result of the devaluation of the Zloty (-7%) and improvements in farm efficiency. Costs stayed under the 40 US-$ mark for the last three years. USA (US-500WI): This farm type is a larger family farm in the range of 200-1000 cows and represents 10% of the farms and about 18% of the cows in the USA. This farm has been in our data base since 2000.In the US, costs were relatively stable from 2000 to 2006 as inflation driven change of input prices could be compensated by increasing milk yields. Once feed prices started rising, this had a direct impact on these farms and costs, which increased by 50% to a level of 38.5 US-$ per 100 kg milk. The sharp drop in costs in 2009 can be interpreted as a result of very bad milk prices, when farmers tried to cut costs wherever possible. Until the year 2012, cost had increased – mainly driven by feed prices - towards 44 US-$ per 100 kg milk. US dairy farms had a significant cost advantage over larger family farms in Germany for over 10 years. In the year 2012, the costs were on a similar level. They have stayed between 40 and 45 US-$ per 100 kg milk for the last four years. China (CN 340BE): This typical farm represents 30 to 405 of the farms and is a larger farm type in China in the range of 200-500 cows. It has been monitored since 2006 with 300 cows. It enables us to understand the dynamics of cost trends in China. Since 2006, a strong increase in cost due to the appreciation of the Yuan could be seen. In 2012, the Yuan had gained value by + 25% to the US-$ compared to 2000. The costs on Chinese farms did not drop sharply in 2009 as was observed in most other countries, because the drop in prices in national currency was almost fully compensated by the appreciation of the Yuan. From 2010 until 2014, the rising feed prices were a strong driver for increasing cost of production. Argentina (AR-170): This farm represents an average sized farm in Argentina in the range of 100-500 cows which represents about 65% of the farms and 68% of the cows in the country. The costs of a 170-cow farm in Argentina have nearly tripled since 2002. Nevertheless, the positive trend has slowed in the last 7 years and costs have become more volatile. This farm is a grazing farm and economics are highly dependent on weather conditions and fodder availability. Parts of the costs decreases and increases in the recent years can be attributed to favourable and unfavourable weather conditions. New Zealand (NZ-390): The typical farm representing an average sized farm covers about 60% of the farms and milk production in New Zealand. This dairy farming system was a world leader in cost competitive milk production in the year 2000. IFCN identified costs of 12 US-$ per 100 kg milk, which was the lowest cost level in those days. Driven by an increase in input prices and an appreciating currency, costs increased to a level of 40 US-$ per 100 kg milk in 2014. Like in Argentina, weather conditions and pasture growth had an impact on milk yield and thus production costs per 100 kg ECM. Based on the typical farms chosen for this analysis, the costs in New Zealand were approximately 25% higher than in Argentina and ca. 25% below the costs level in Germany in 2014. Outlook milk production costs in 2015 The devaluation of the Euro against the US-$ has been about 20% in 2015. In Oceania the New Zealand dollar has also depreciated by about 11%. In Brazil, the currency devaluated by 28% while in Poland by 17%. This will probably make the costs competitive in this part of the world. Milk prices began to decline from the all-time peaks in February 2014 to its lowest levels since 2008 in July 2015 at 23.2 US-$. By July 2015, milk prices had dropped by 30-40 %. The ensuing crisis has led farmers to respond in a way to reduce their intensity of dairy farm operations in many countries in EU and Oceania. Though costs in USA have remained more or less stable, costs in EU are expected to decline by currency devaluation and farmers reactions. It is expected that the average costs of milk production will reduce in EU by a range of 8-9 US-$ per 100 kg ECM primarily driven by euro devaluation against US-$ while in Oceania by 5-6 US-$ due to farmers response and NZ-$ devaluation. Details to be delivered during IFCN analysis and dairy conference in 2016 .
  • 7. Summary This article summarises the research work of the IFCN – which has been analysing dairy farm economics since the year 2000. In the year 2015, 55 countries participated in the annual comparison of costs of production and 100 countries participated in the country profile analysis. The results of this article are summarised as follows: 121.5 million dairy farms on this planet keeping on average 2.9 cows per farm Based on IFCN data collection and estimations, in 2014 there were 121.5 million dairy farms and farming households on this planet producing 778 million ton of ECM milk (cows and buffaloes with 4% fat and 3.3% proteins). The average dairy farm size has 2.9 milk animals with an average milk yield of 2145 kg milk ECM / milk / animal. 2014 Costs to produce milk ranges from 4 to 128 US-$ per 100 kg milk Based on the IFCN cost comparison, 170 typical farms in 55 countries were analysed. Cost of milk production ranged from 4.5 US-$ per 100 kg milk in extensive farming systems in Cameroon to 118 US-$ for an average sized farm type in Switzerland. The simple average cost over all countries analysed was 46 US-$/100 kg milk. From 2000 – 2014, cost of milk production increased in all countries analysed As the IFCN has analysed typical dairy farms since the year 2000, a time series analysis was possible. The results show that costs in a specific country can increase significantly within 3- 6 years. This is especially the case for countries like Poland, China, and New Zealand where the value of the currency has significantly strengthened against the US-$ and farm input price like land, feed, and labour costs have increased significantly. Costs in EU and US reach a level of 40 – 50 $ Cost of milk production in China still significantly higher than EU and Germany An extreme case was observed in China where dairy farming highly depends on purchased feed. In addition, China had the strongest increase in salaries and an appreciation of the currency of 24%. The combined effect of these factors drove the costs in China from a level of 40 US-$ / 100 kg milk in 2008 to a level of 60 US-$/100 kg in 2014. Very volatile milk and feed prices – we are now in the 3rd dairy crisis since 2008 Via standardised world milk and feed prices, IFCN tracks the overall farm economic situation for dairy farming. The IFCN developed an indicator “margin over compound feed costs” which is a significant improvement compared to the often used milk:feed price ratio. By using this margin, it becomes visible how much of a threat dairy farmers face in a situation when milk prices fall and feed prices increase to such an extent that 100 kg feed are more expensive than 100 kg ECM. This situation occurred three times within the last eight years, in 2009, in 2012 and most recently in the beginning of 2015. 2015 perspectives of production costs to decrease in US-$ terms 1. The cost analysis results shown are based on 2014 data– but changes to be expected for 2015 will be mainly driven by 2 factors: a) changes in exchange rate and b) lower milk price which drives changes in dairy farming systems. 2. First estimation by IFCN for costs in 2015 show stable costs for USA and significant costs reduction of 5-9 US- $ in the EU, NZ, BR, PL. Annual benchmarking a part of strategic dairy development and milk sourcing In times of significant change in dairy related output prices, farm input prices, and exchange rates, it is extremely important to benchmark the competitiveness of the current dairy farming system annually. Competitiveness means in this sense costs competitive on the market for dairy products and also competitive on the local market for production factors especially land and labour. Such benchmarking exercises enable all dairy stakeholders to see and react faster to threats, but even more to anticipate opportunities which will arise.