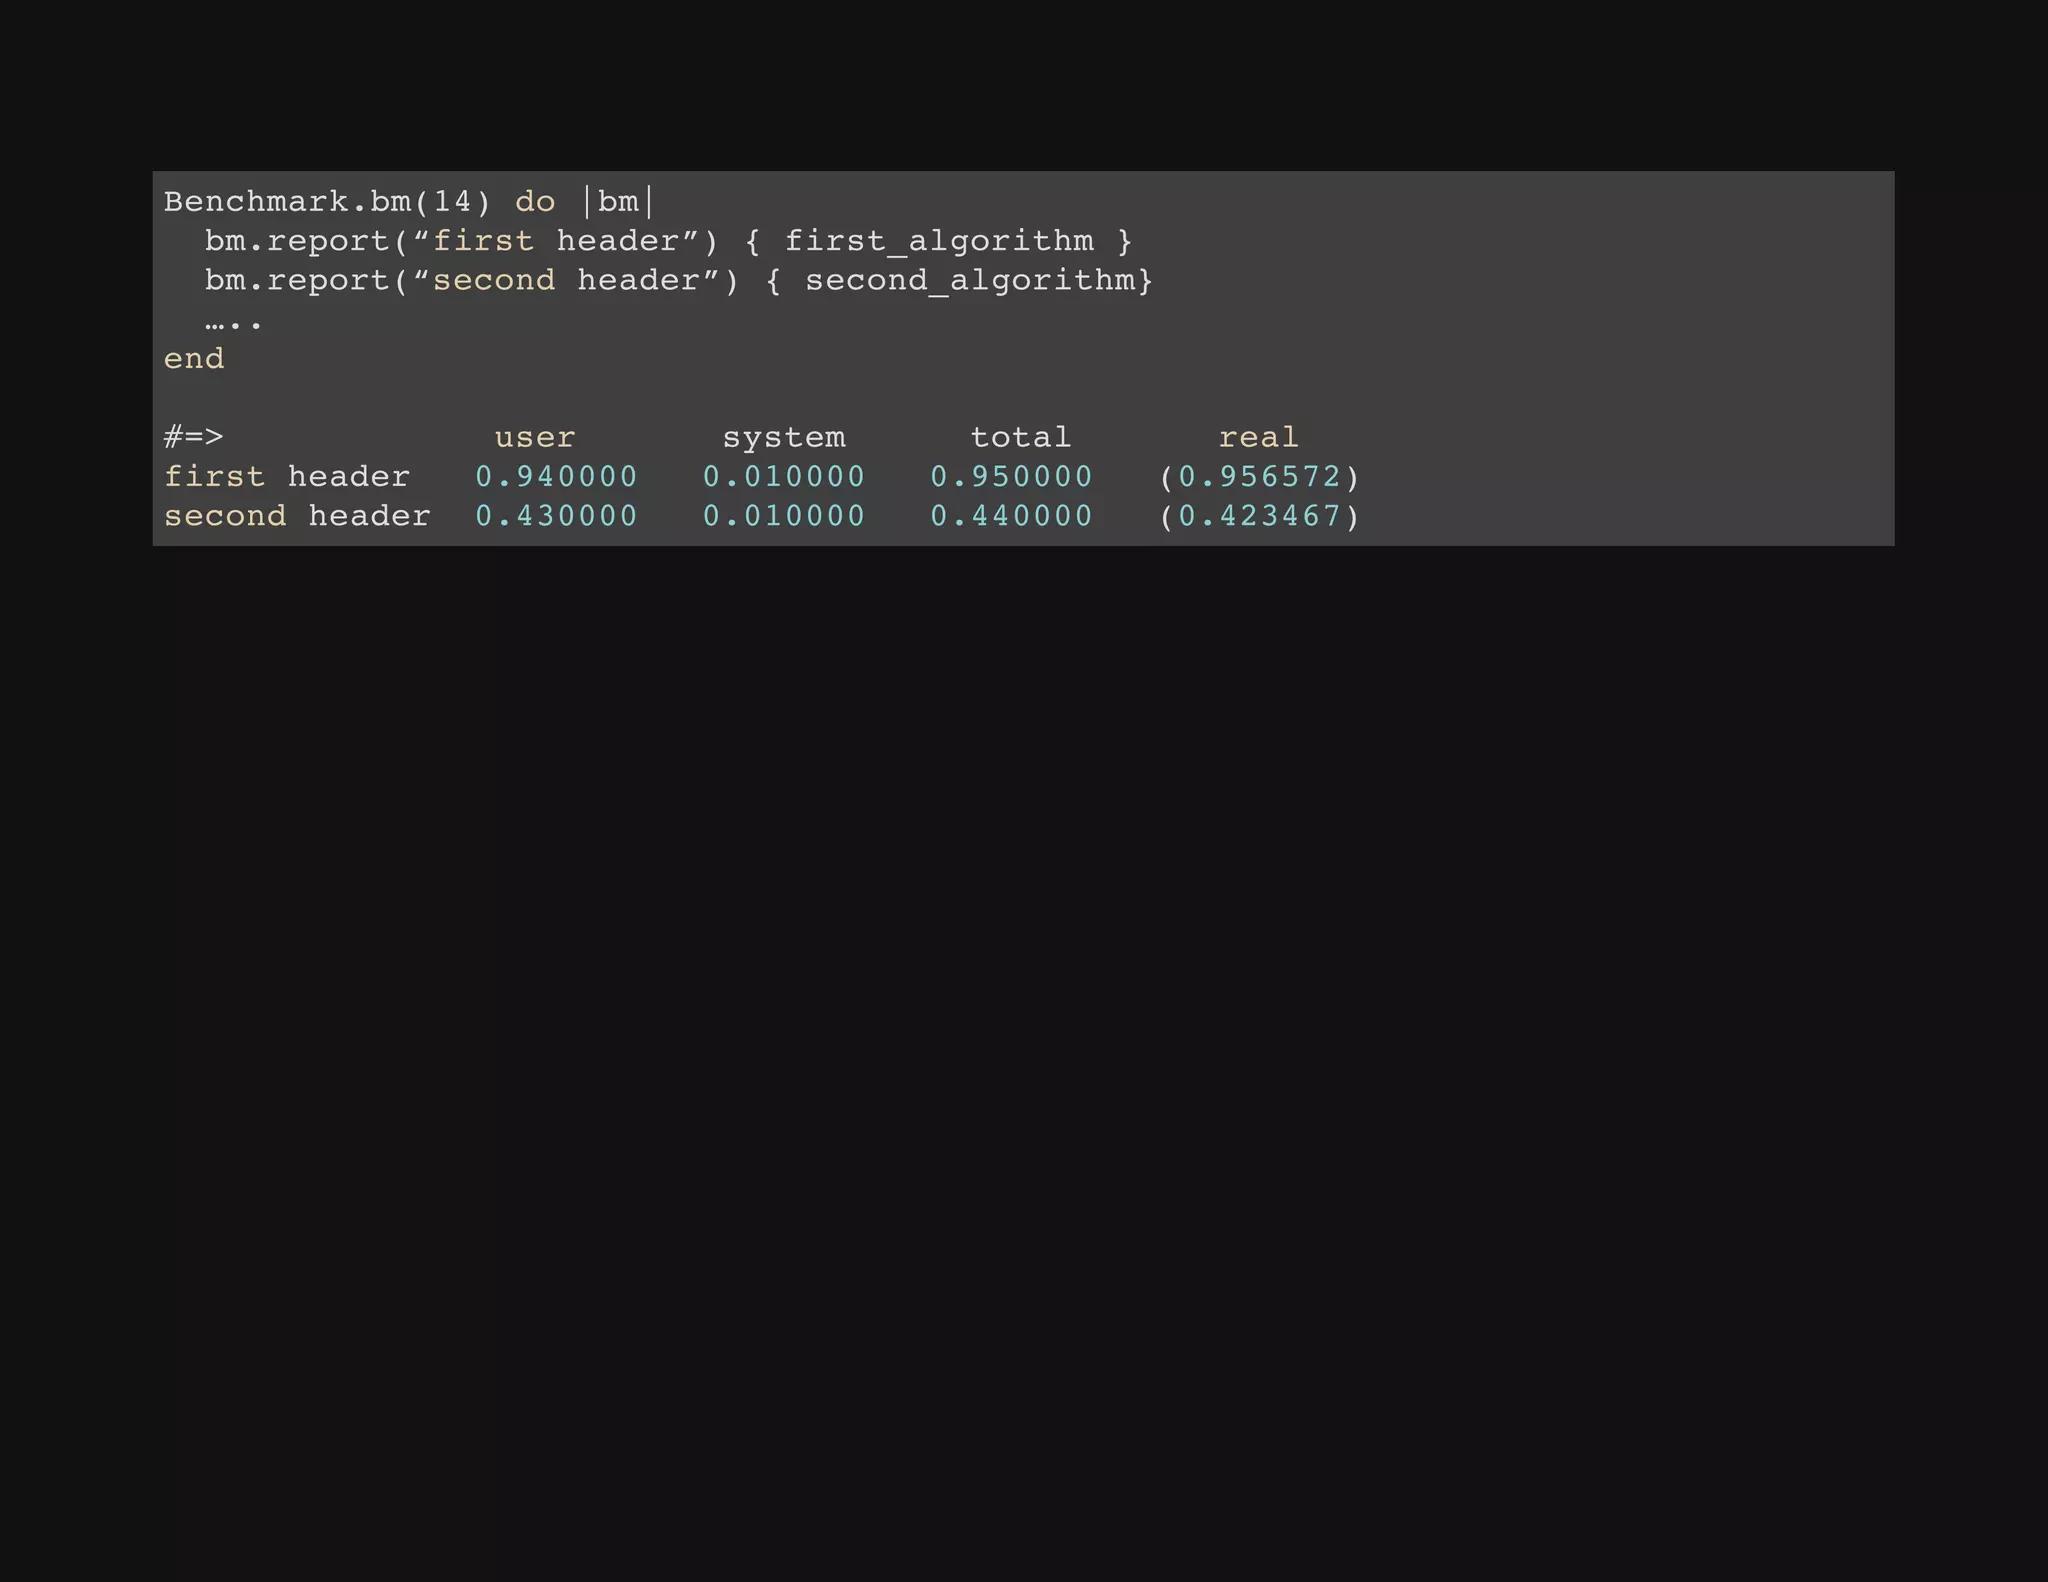
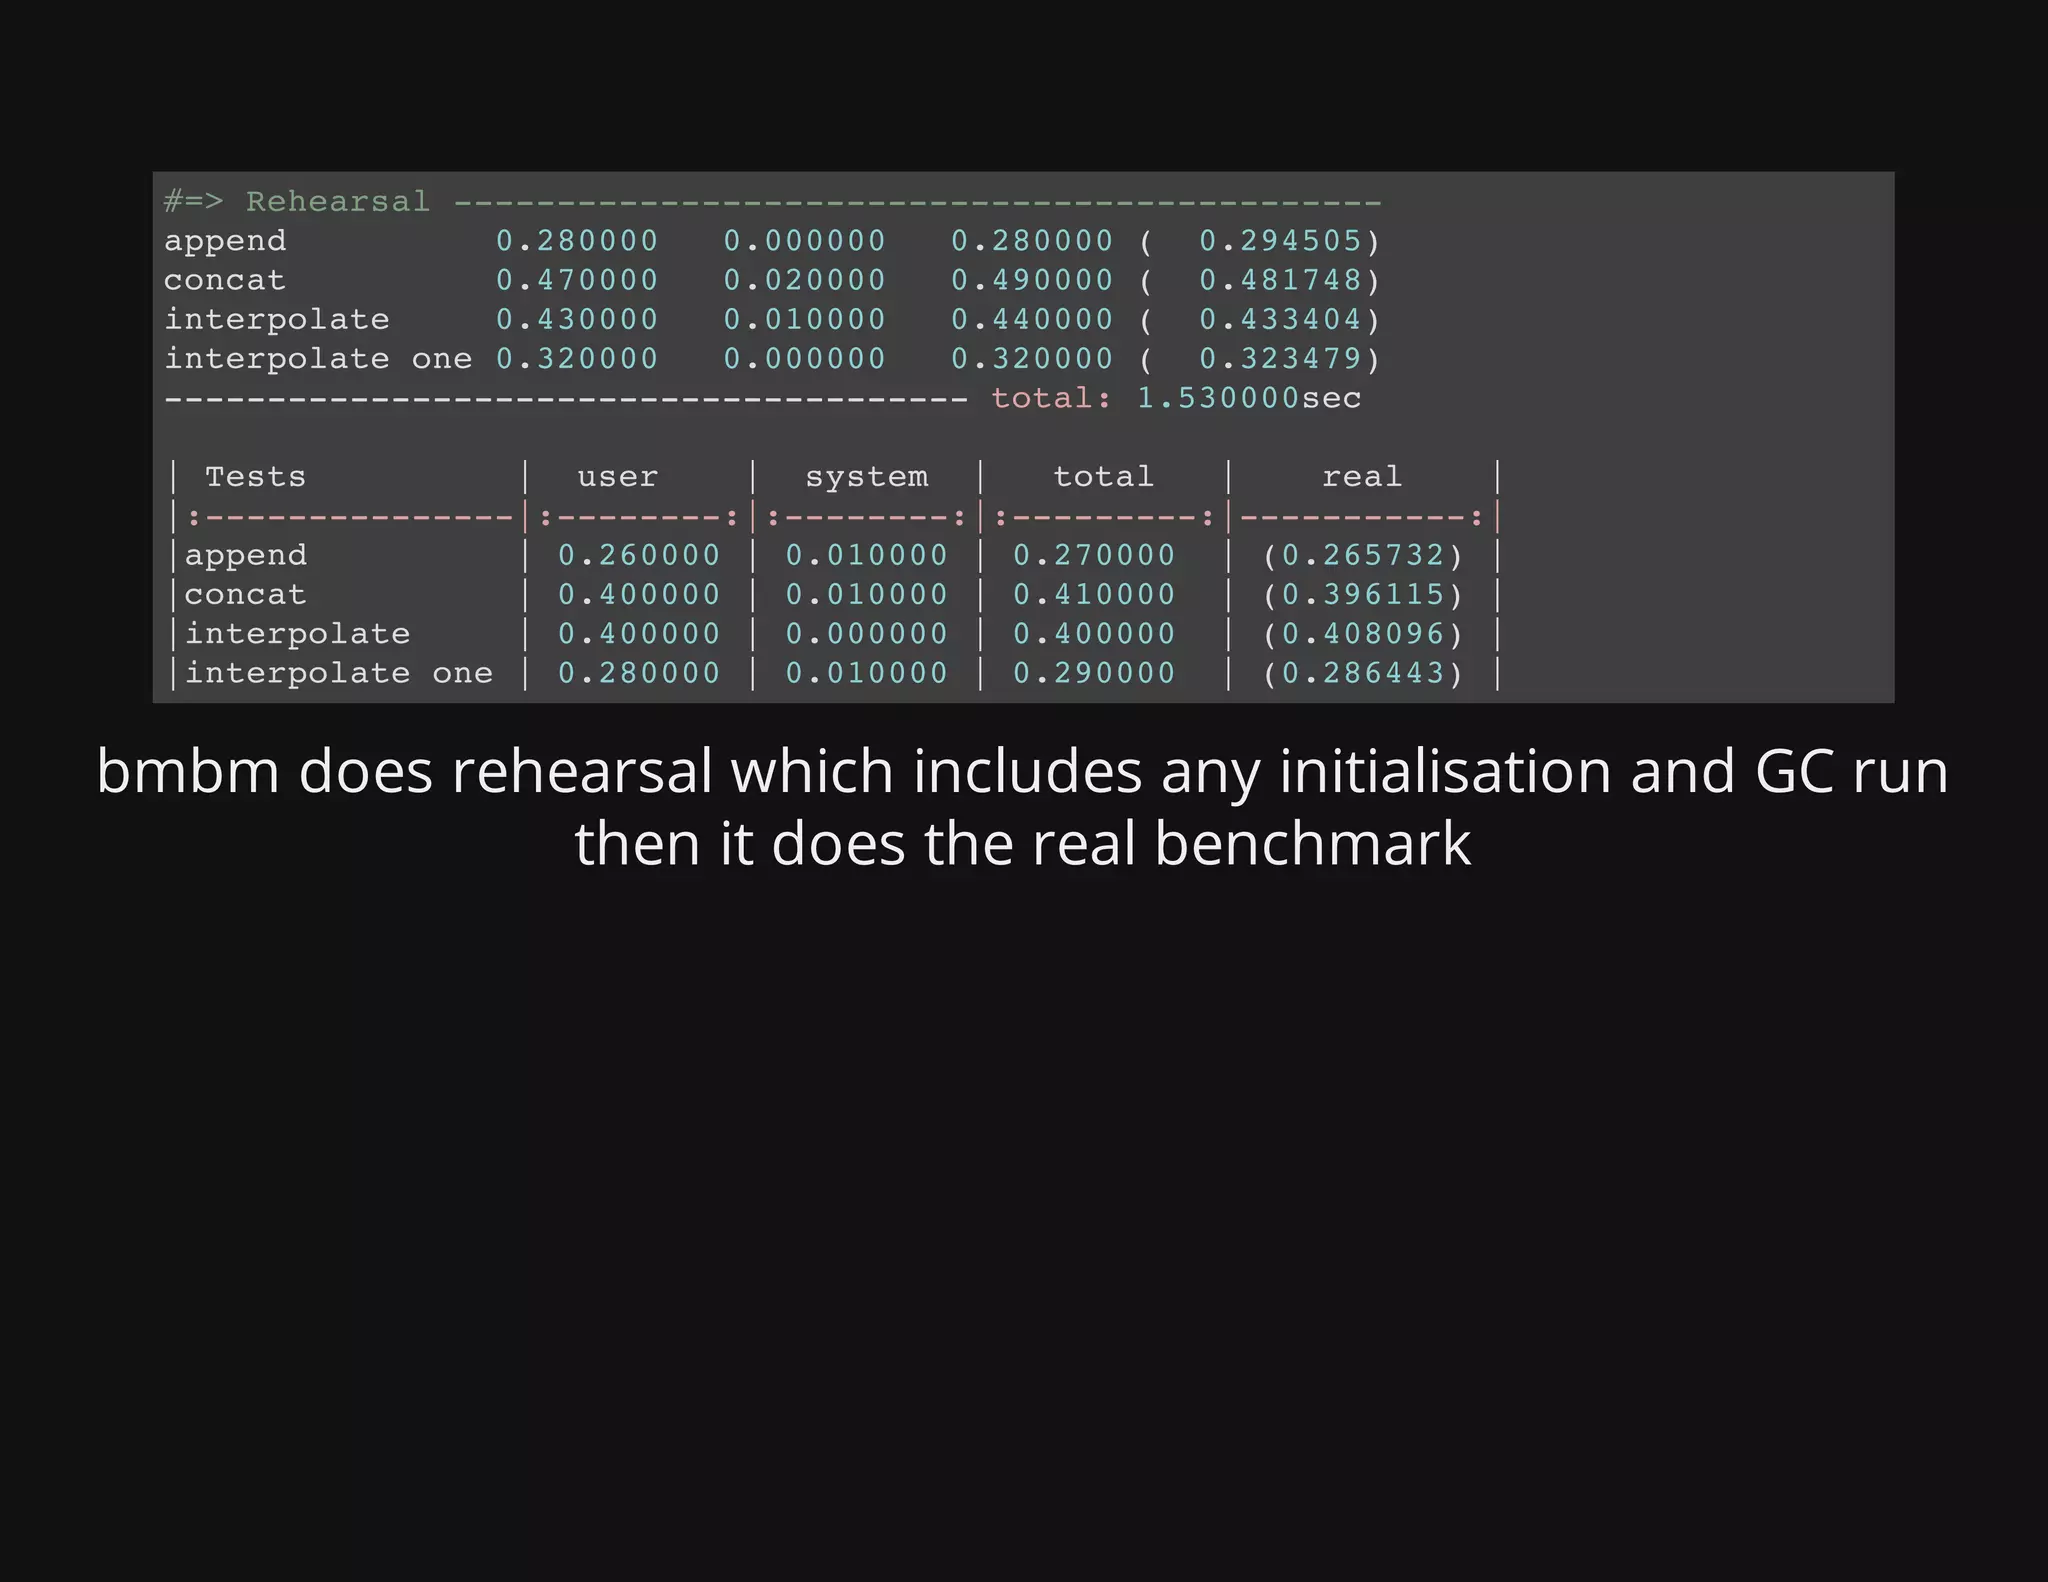
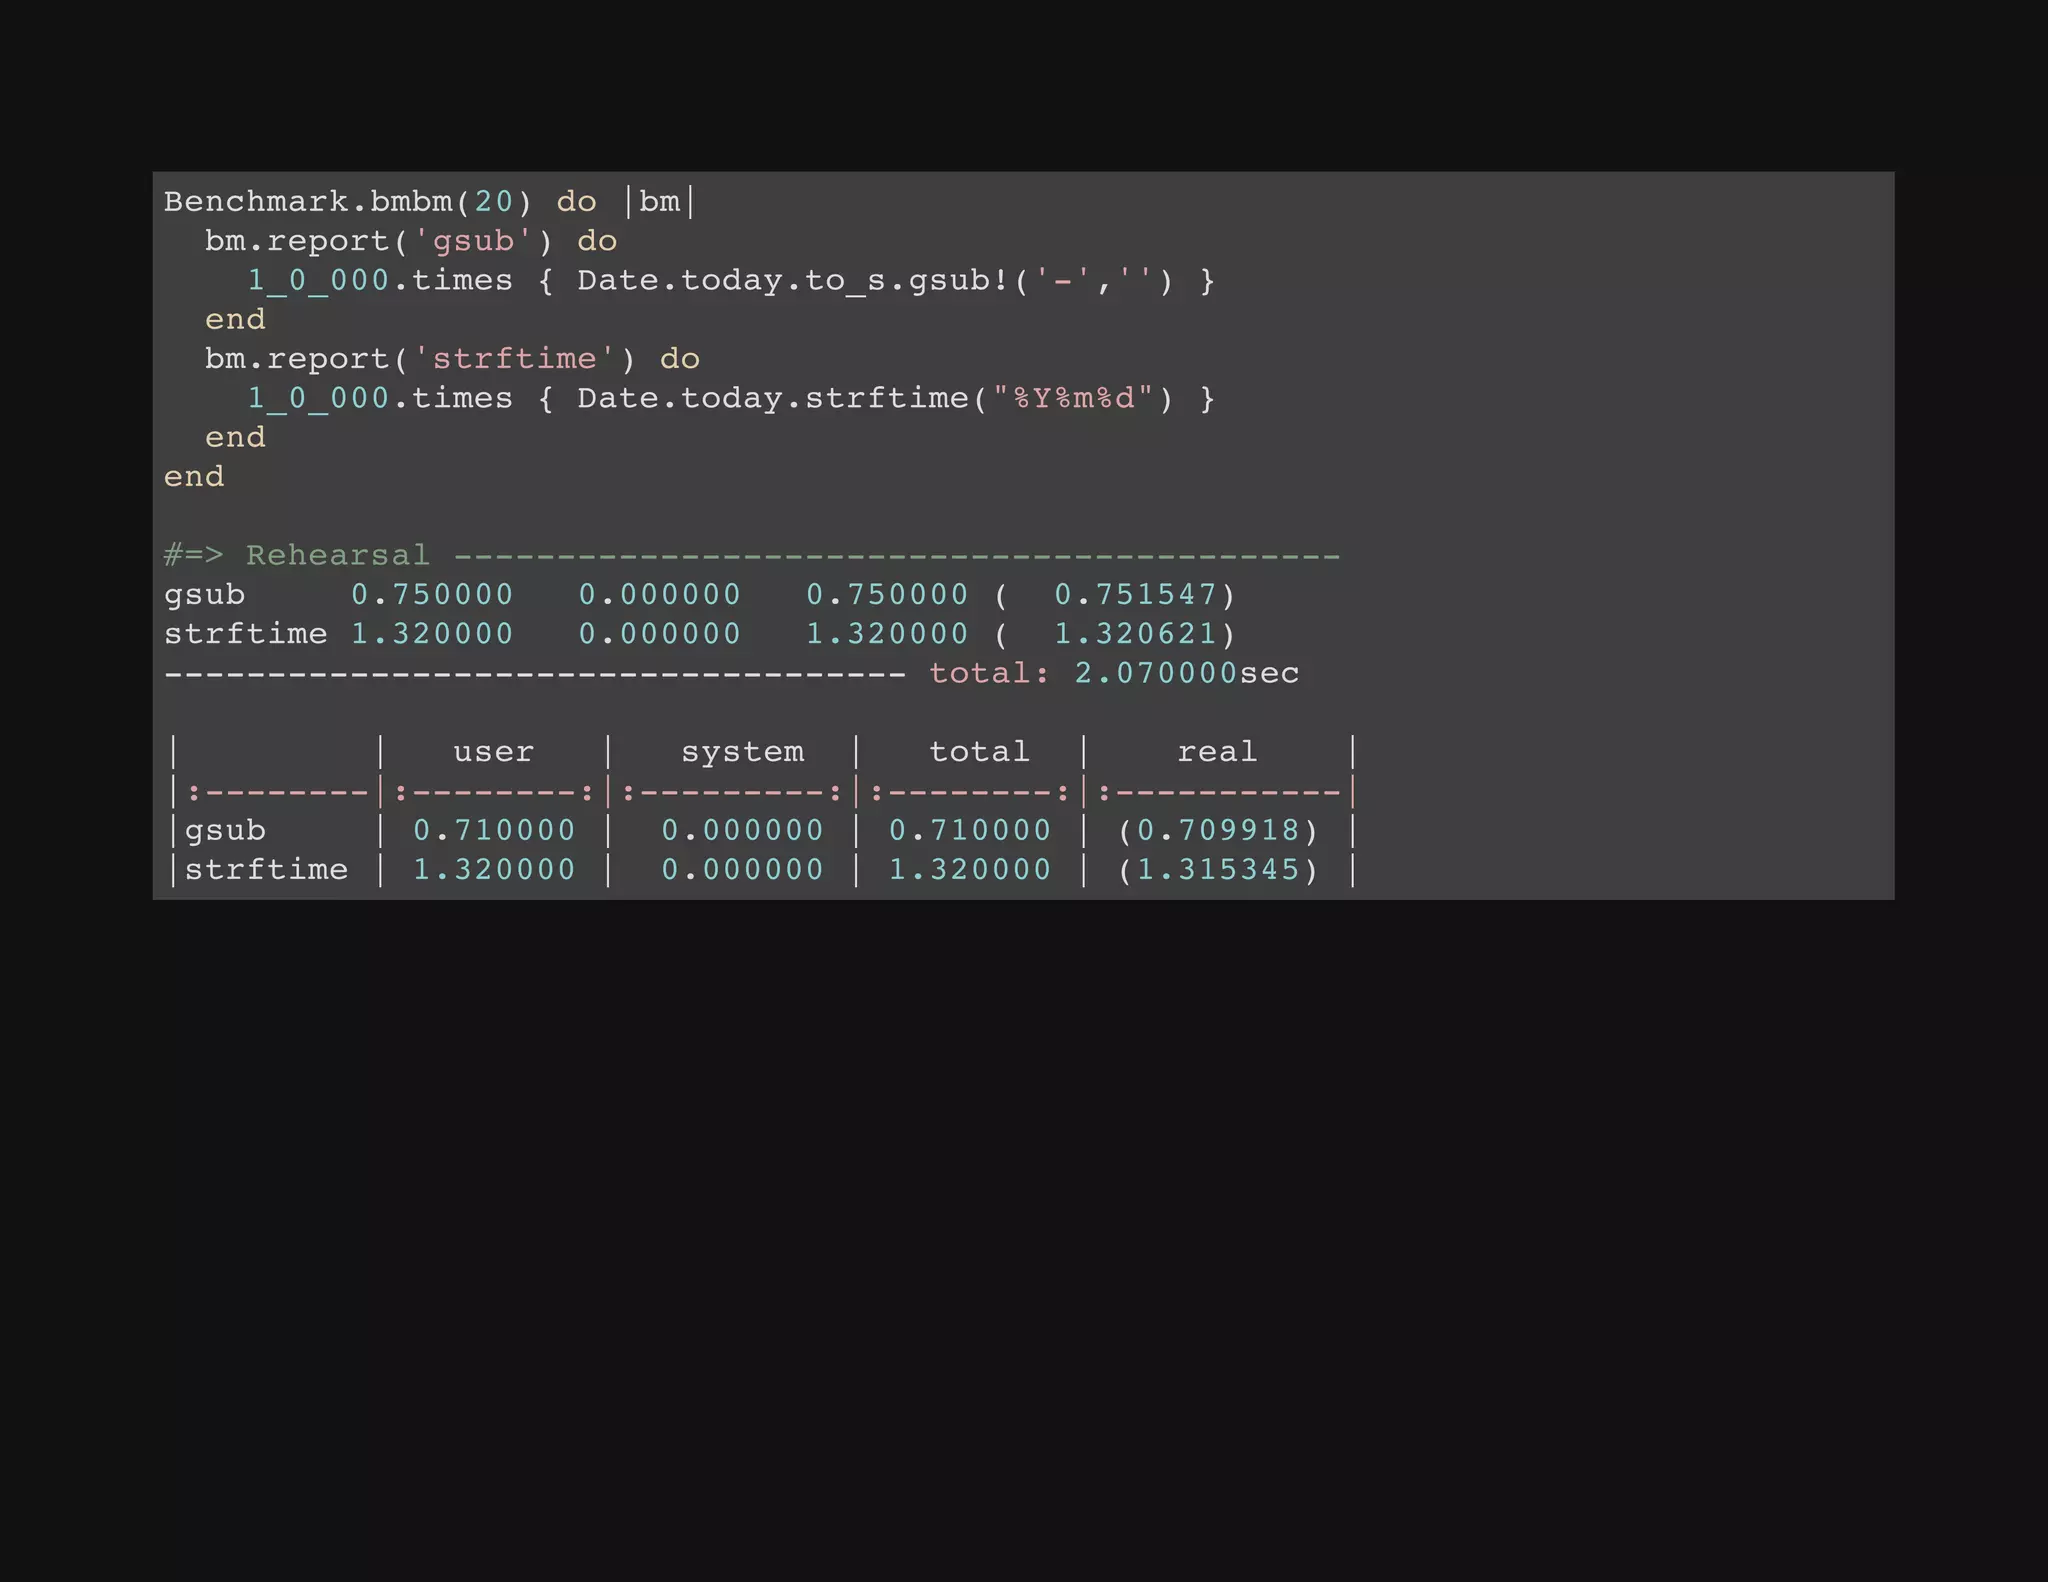
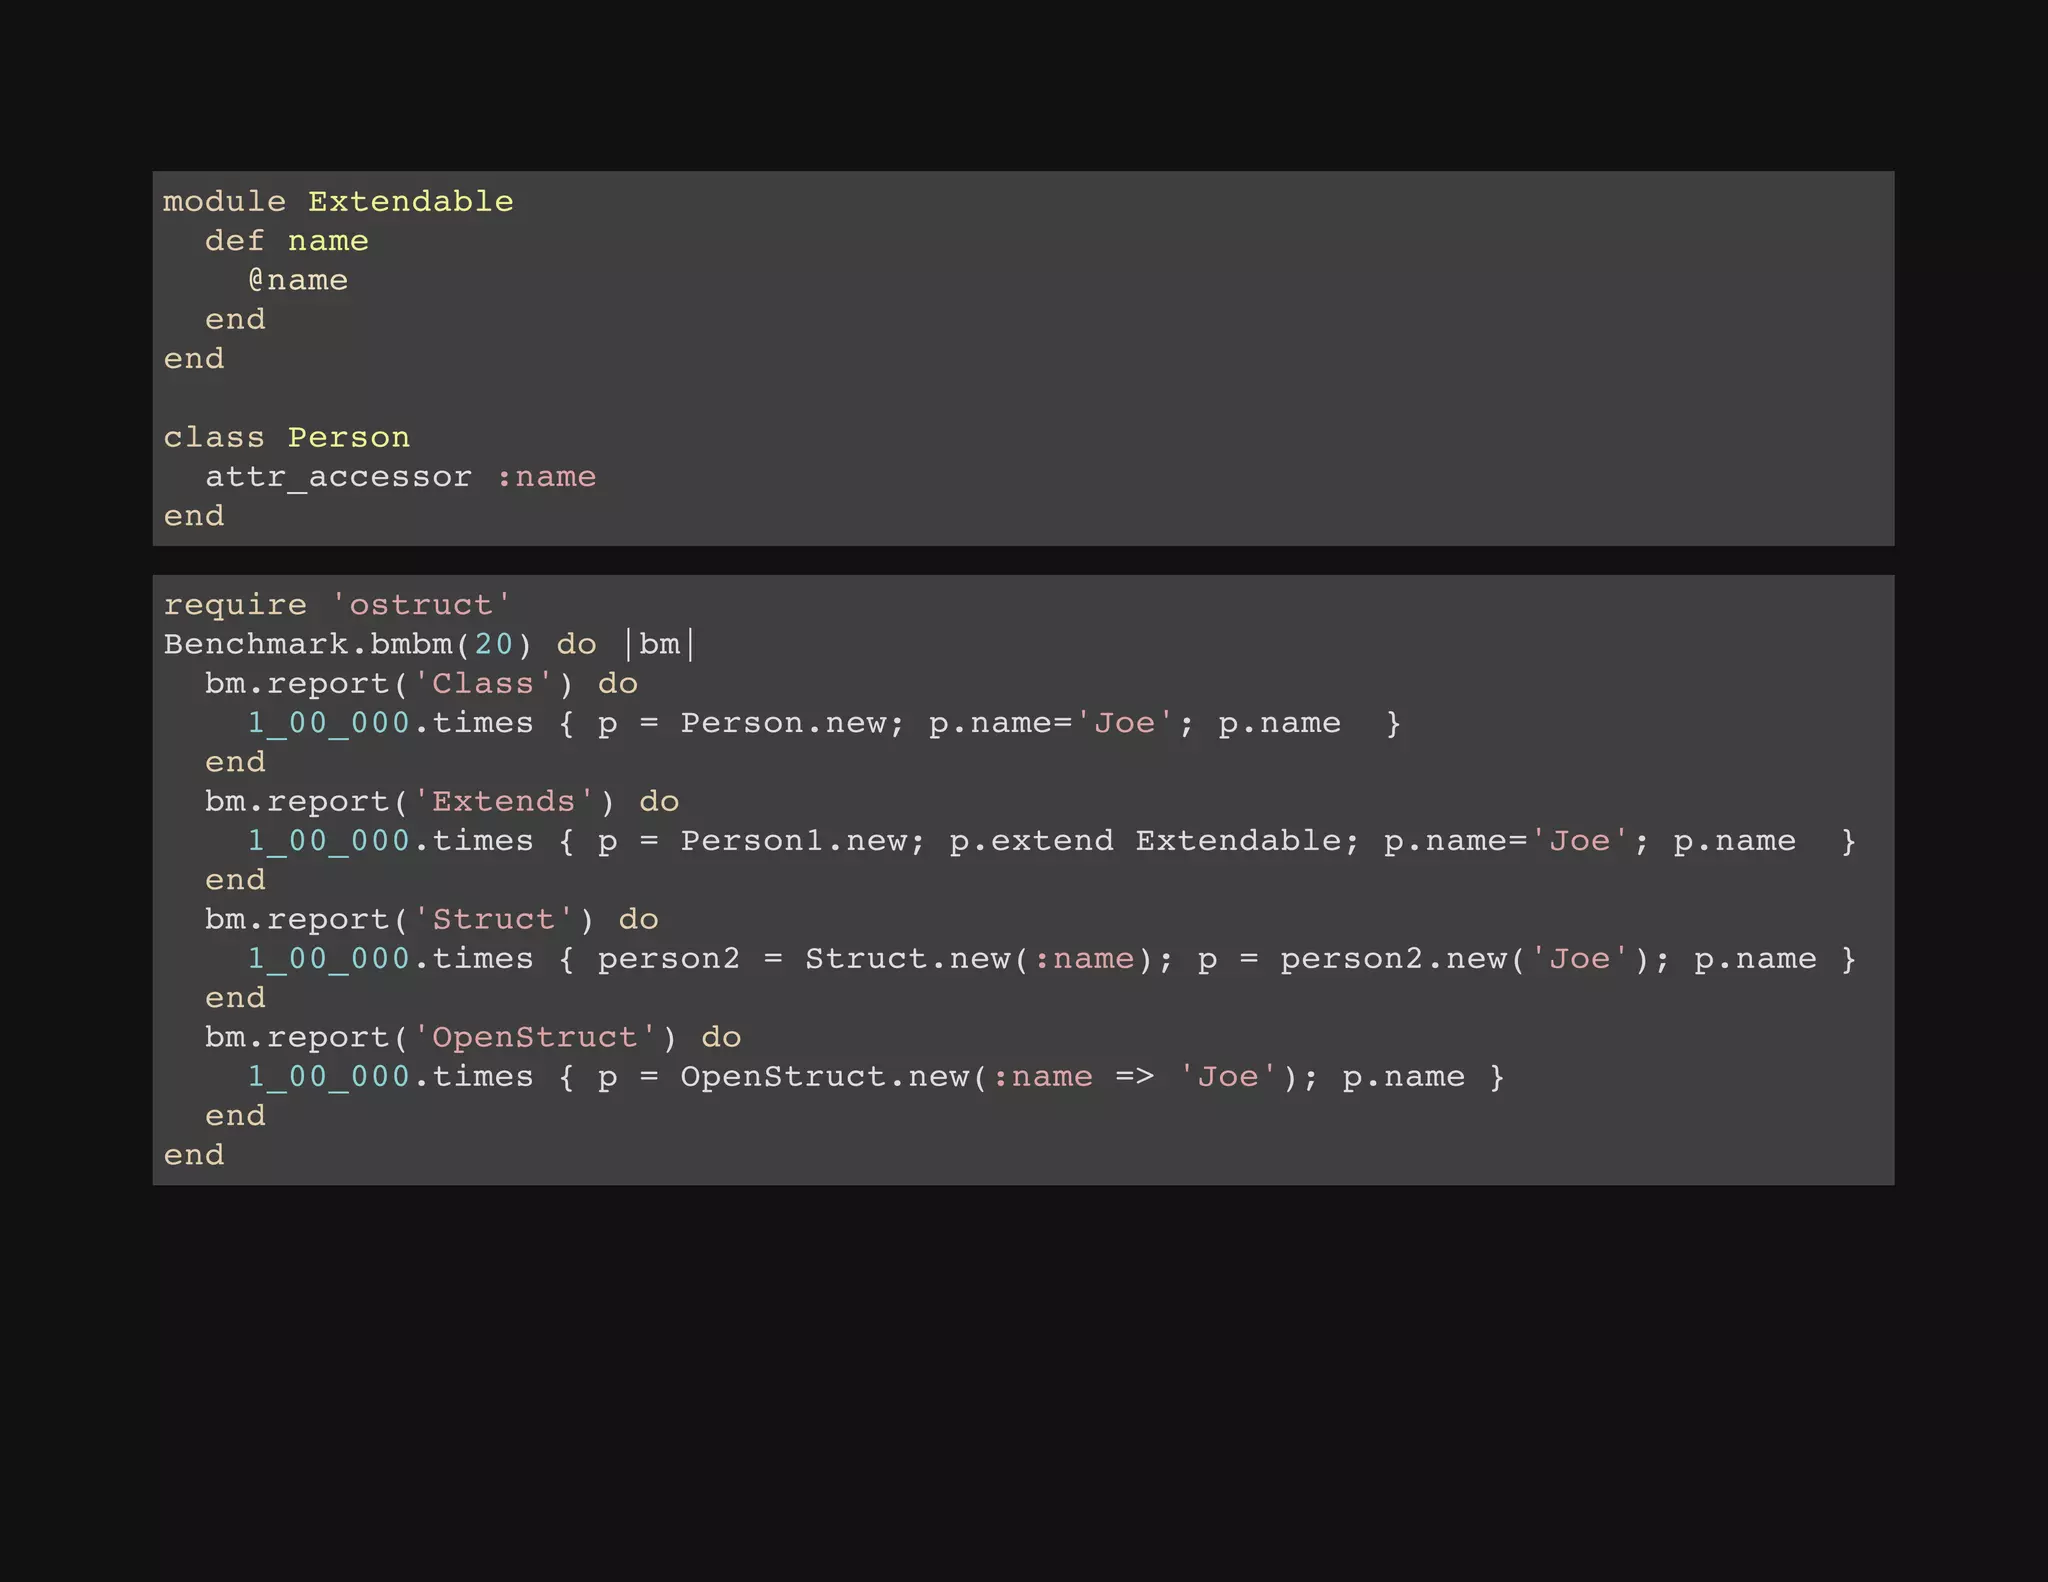
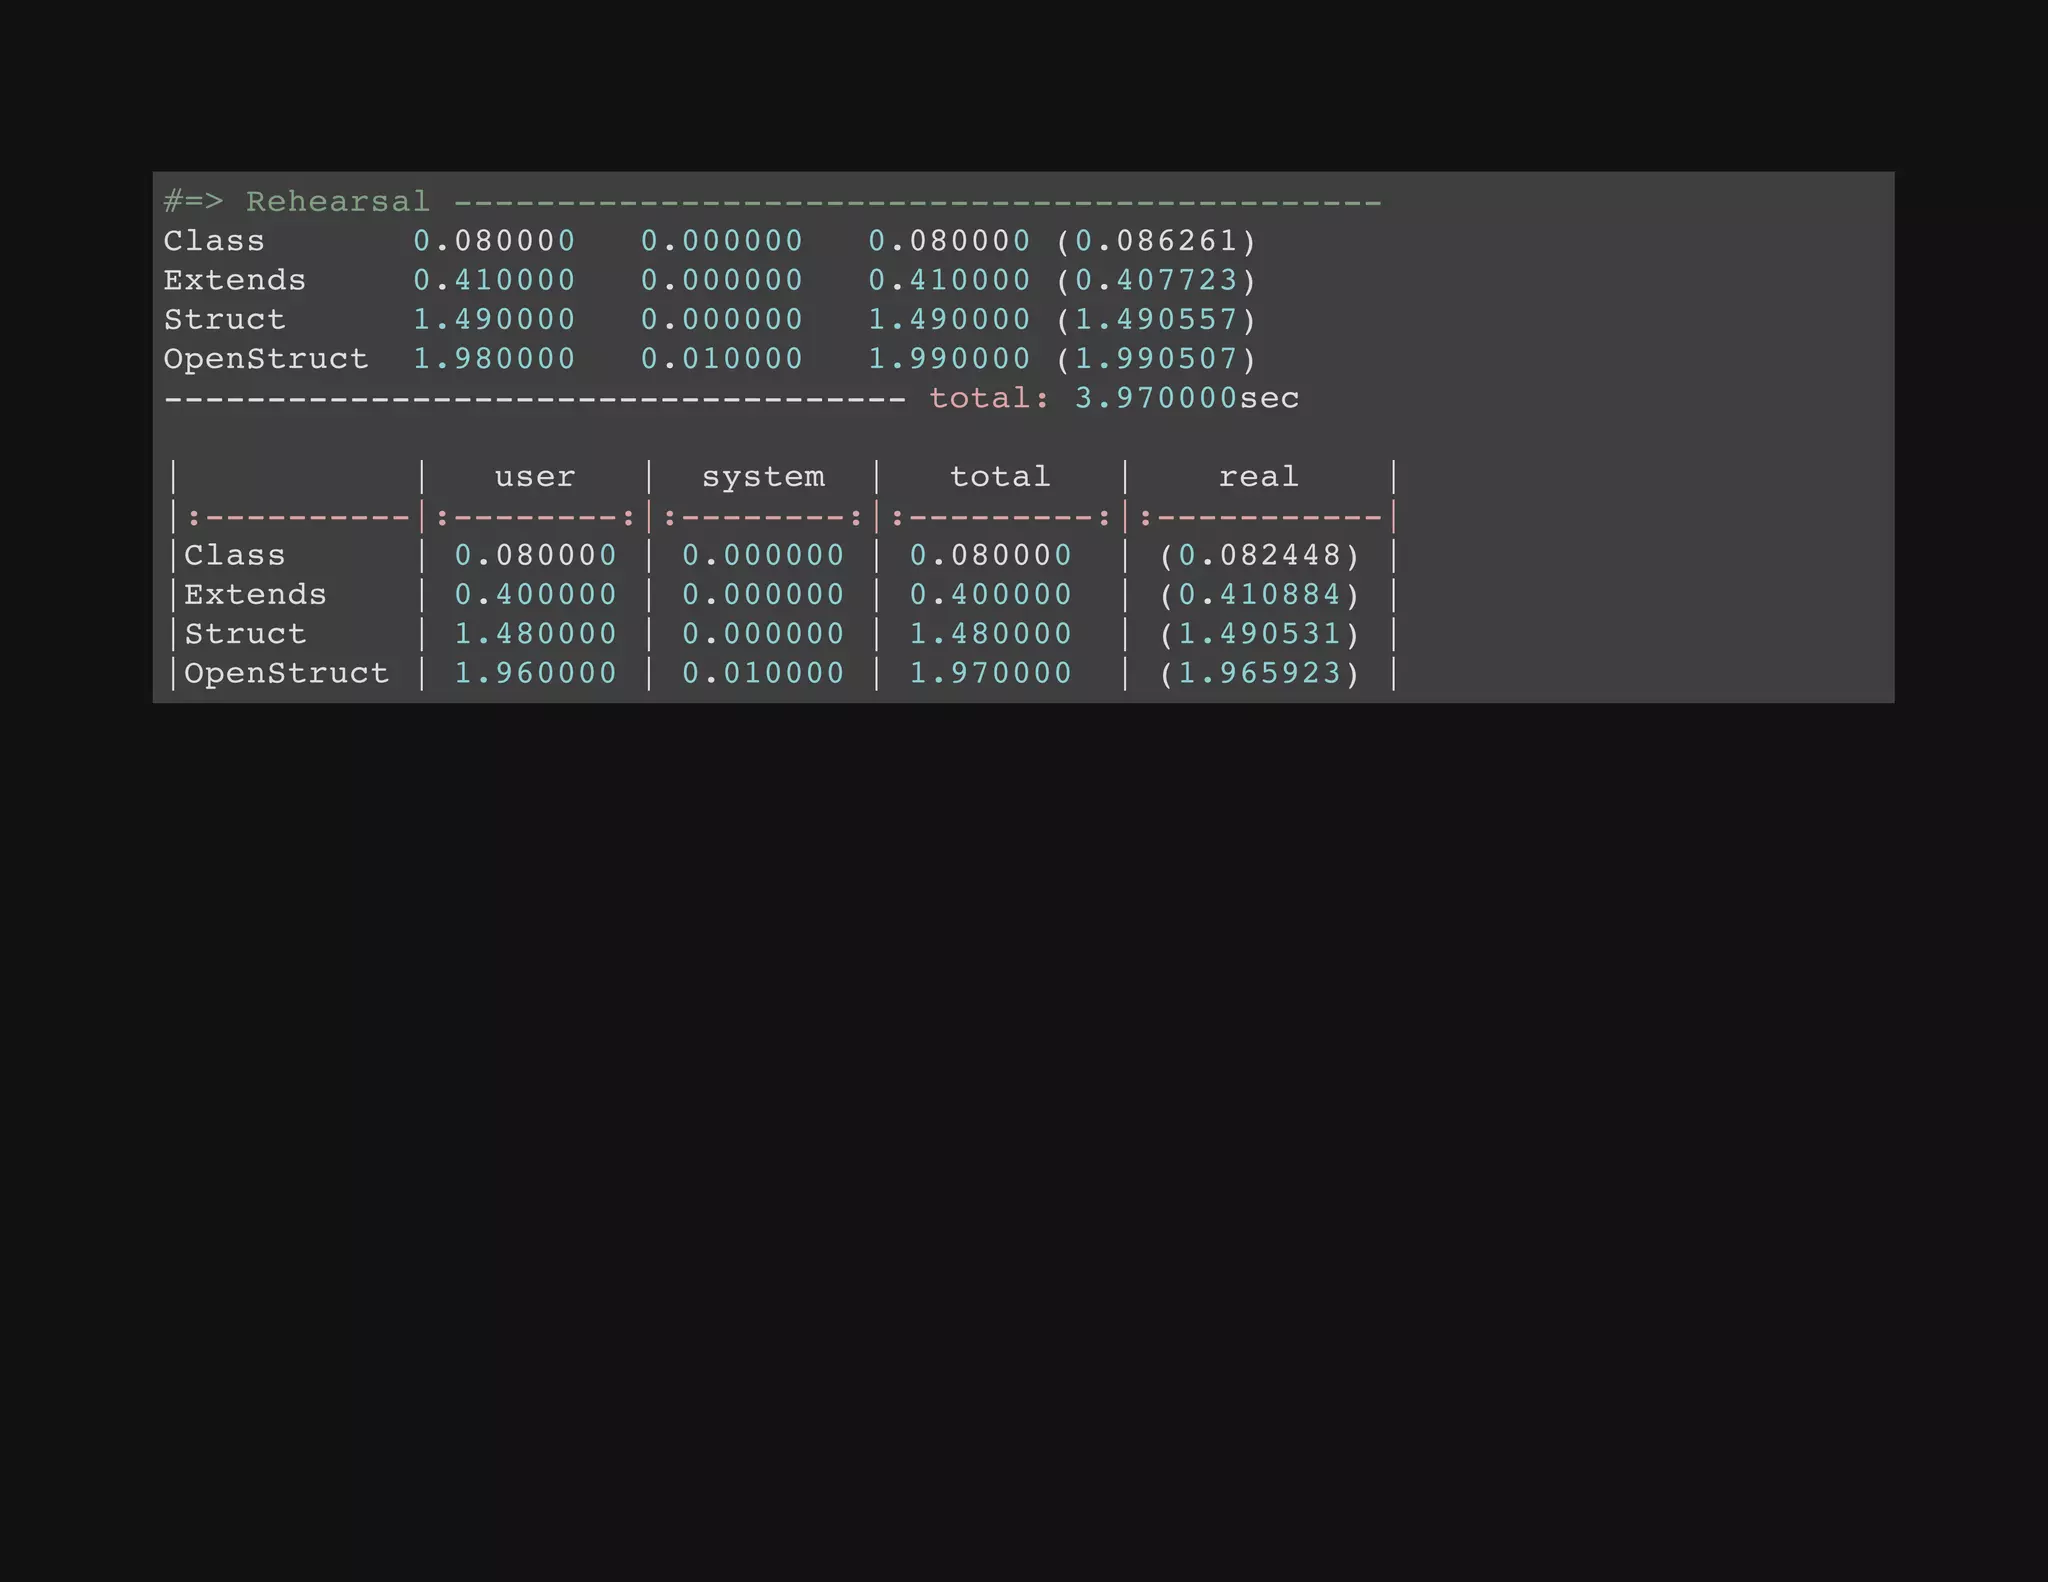
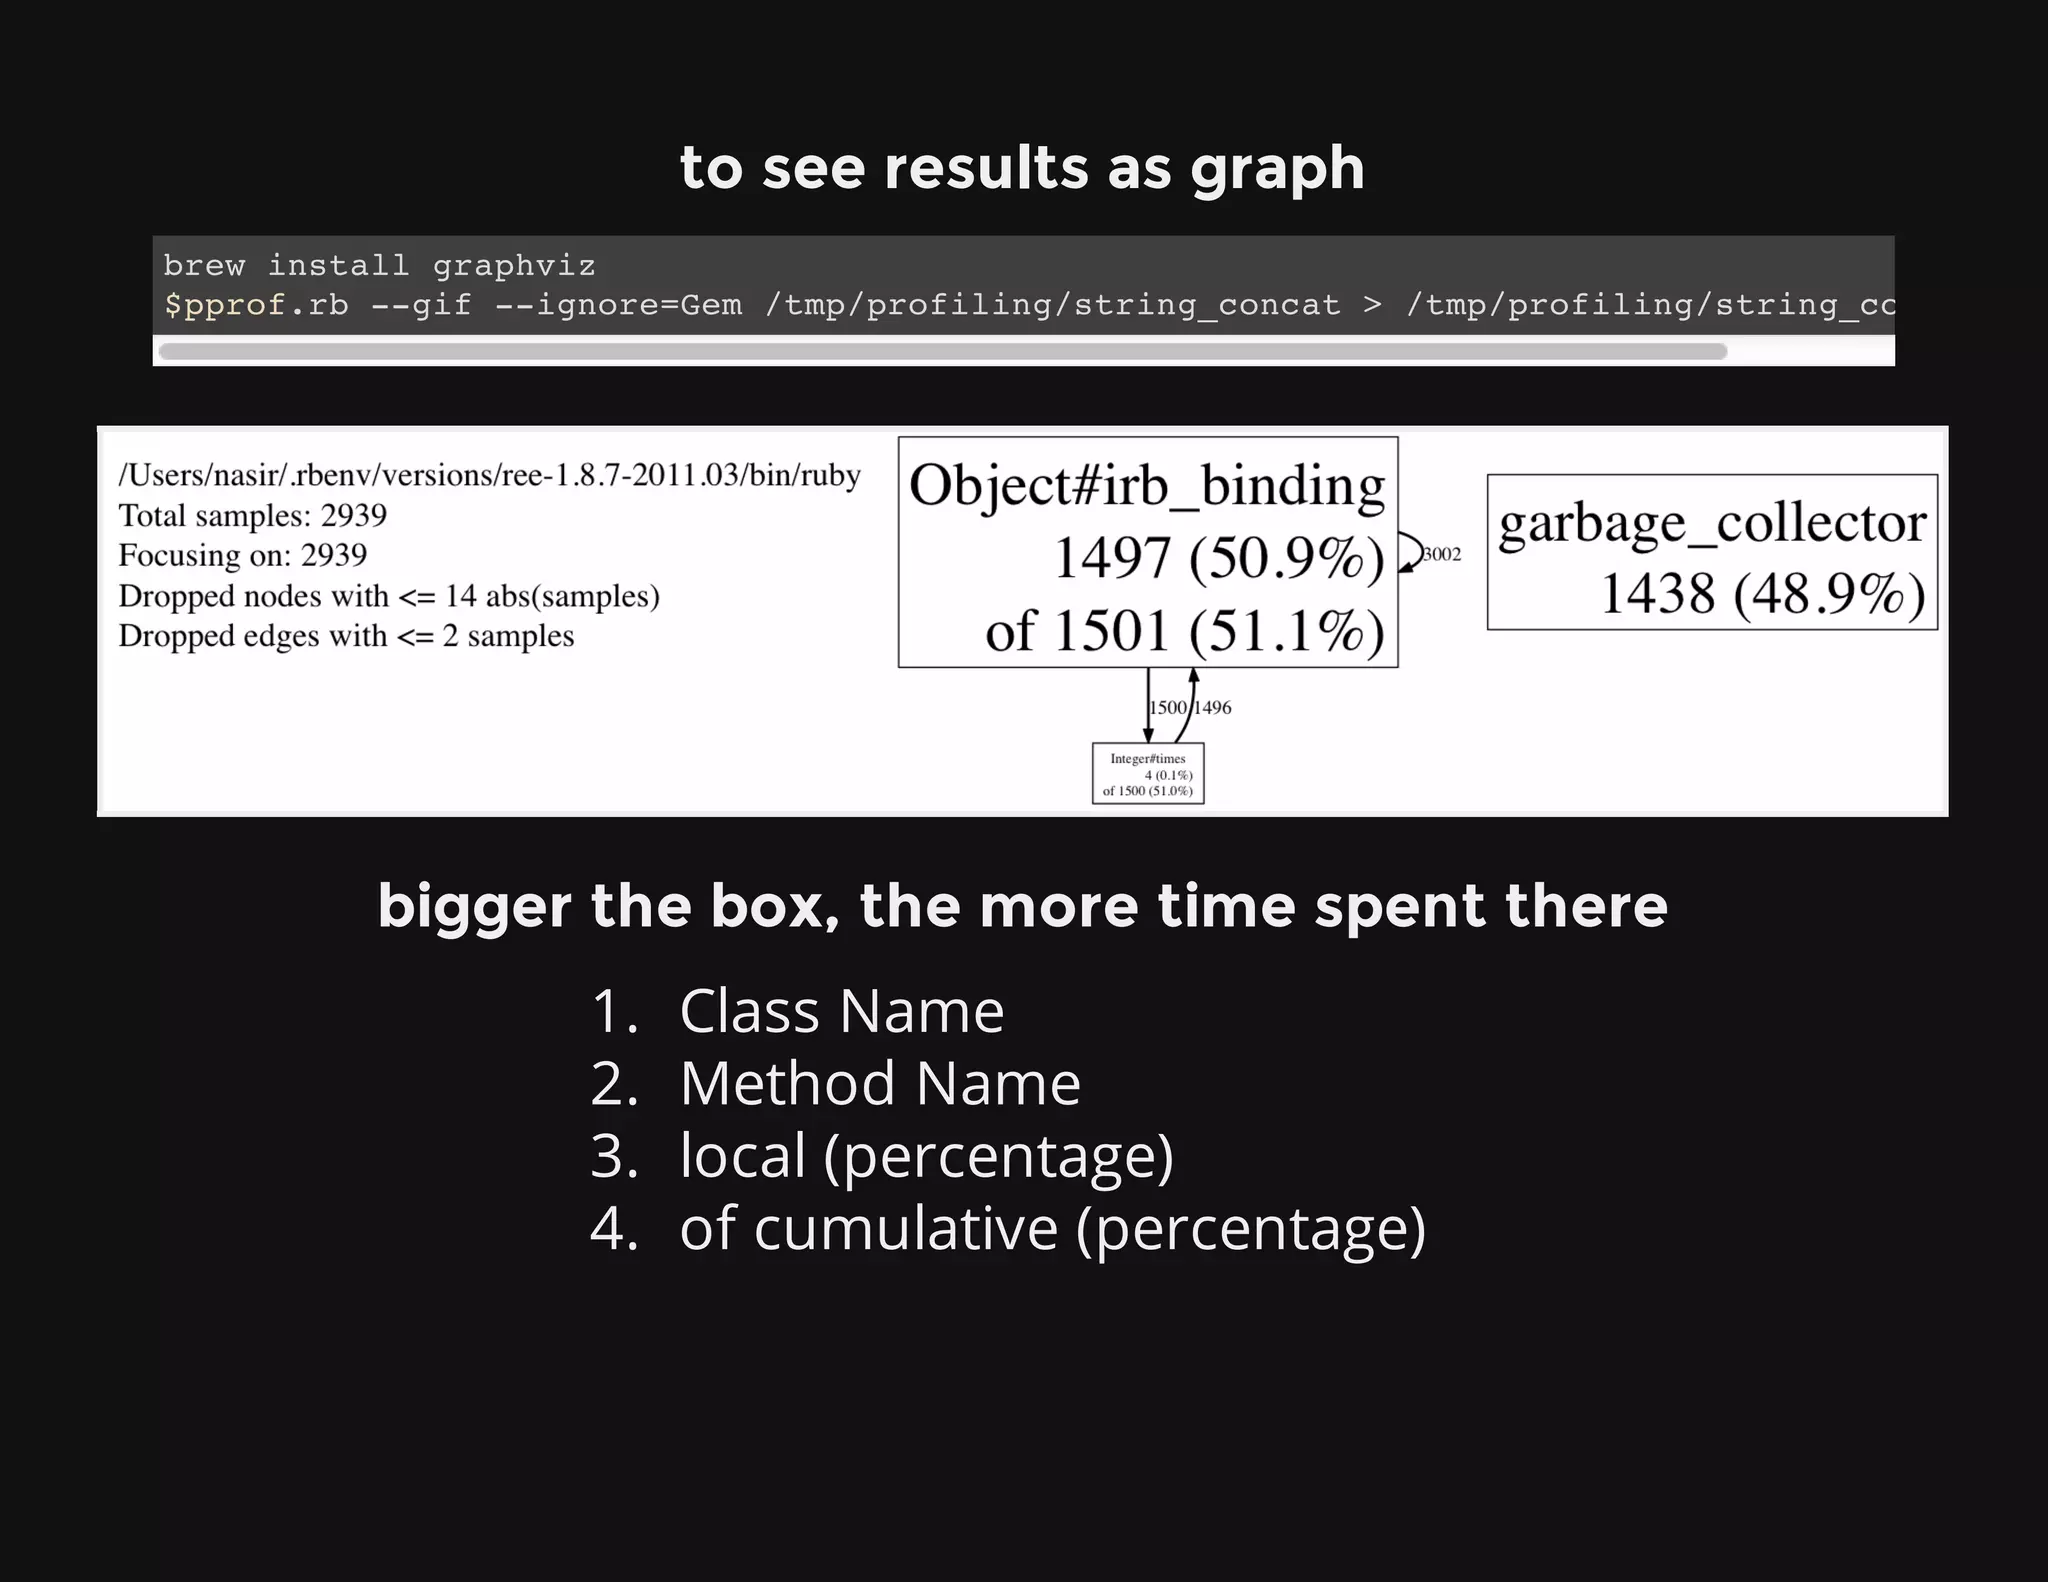
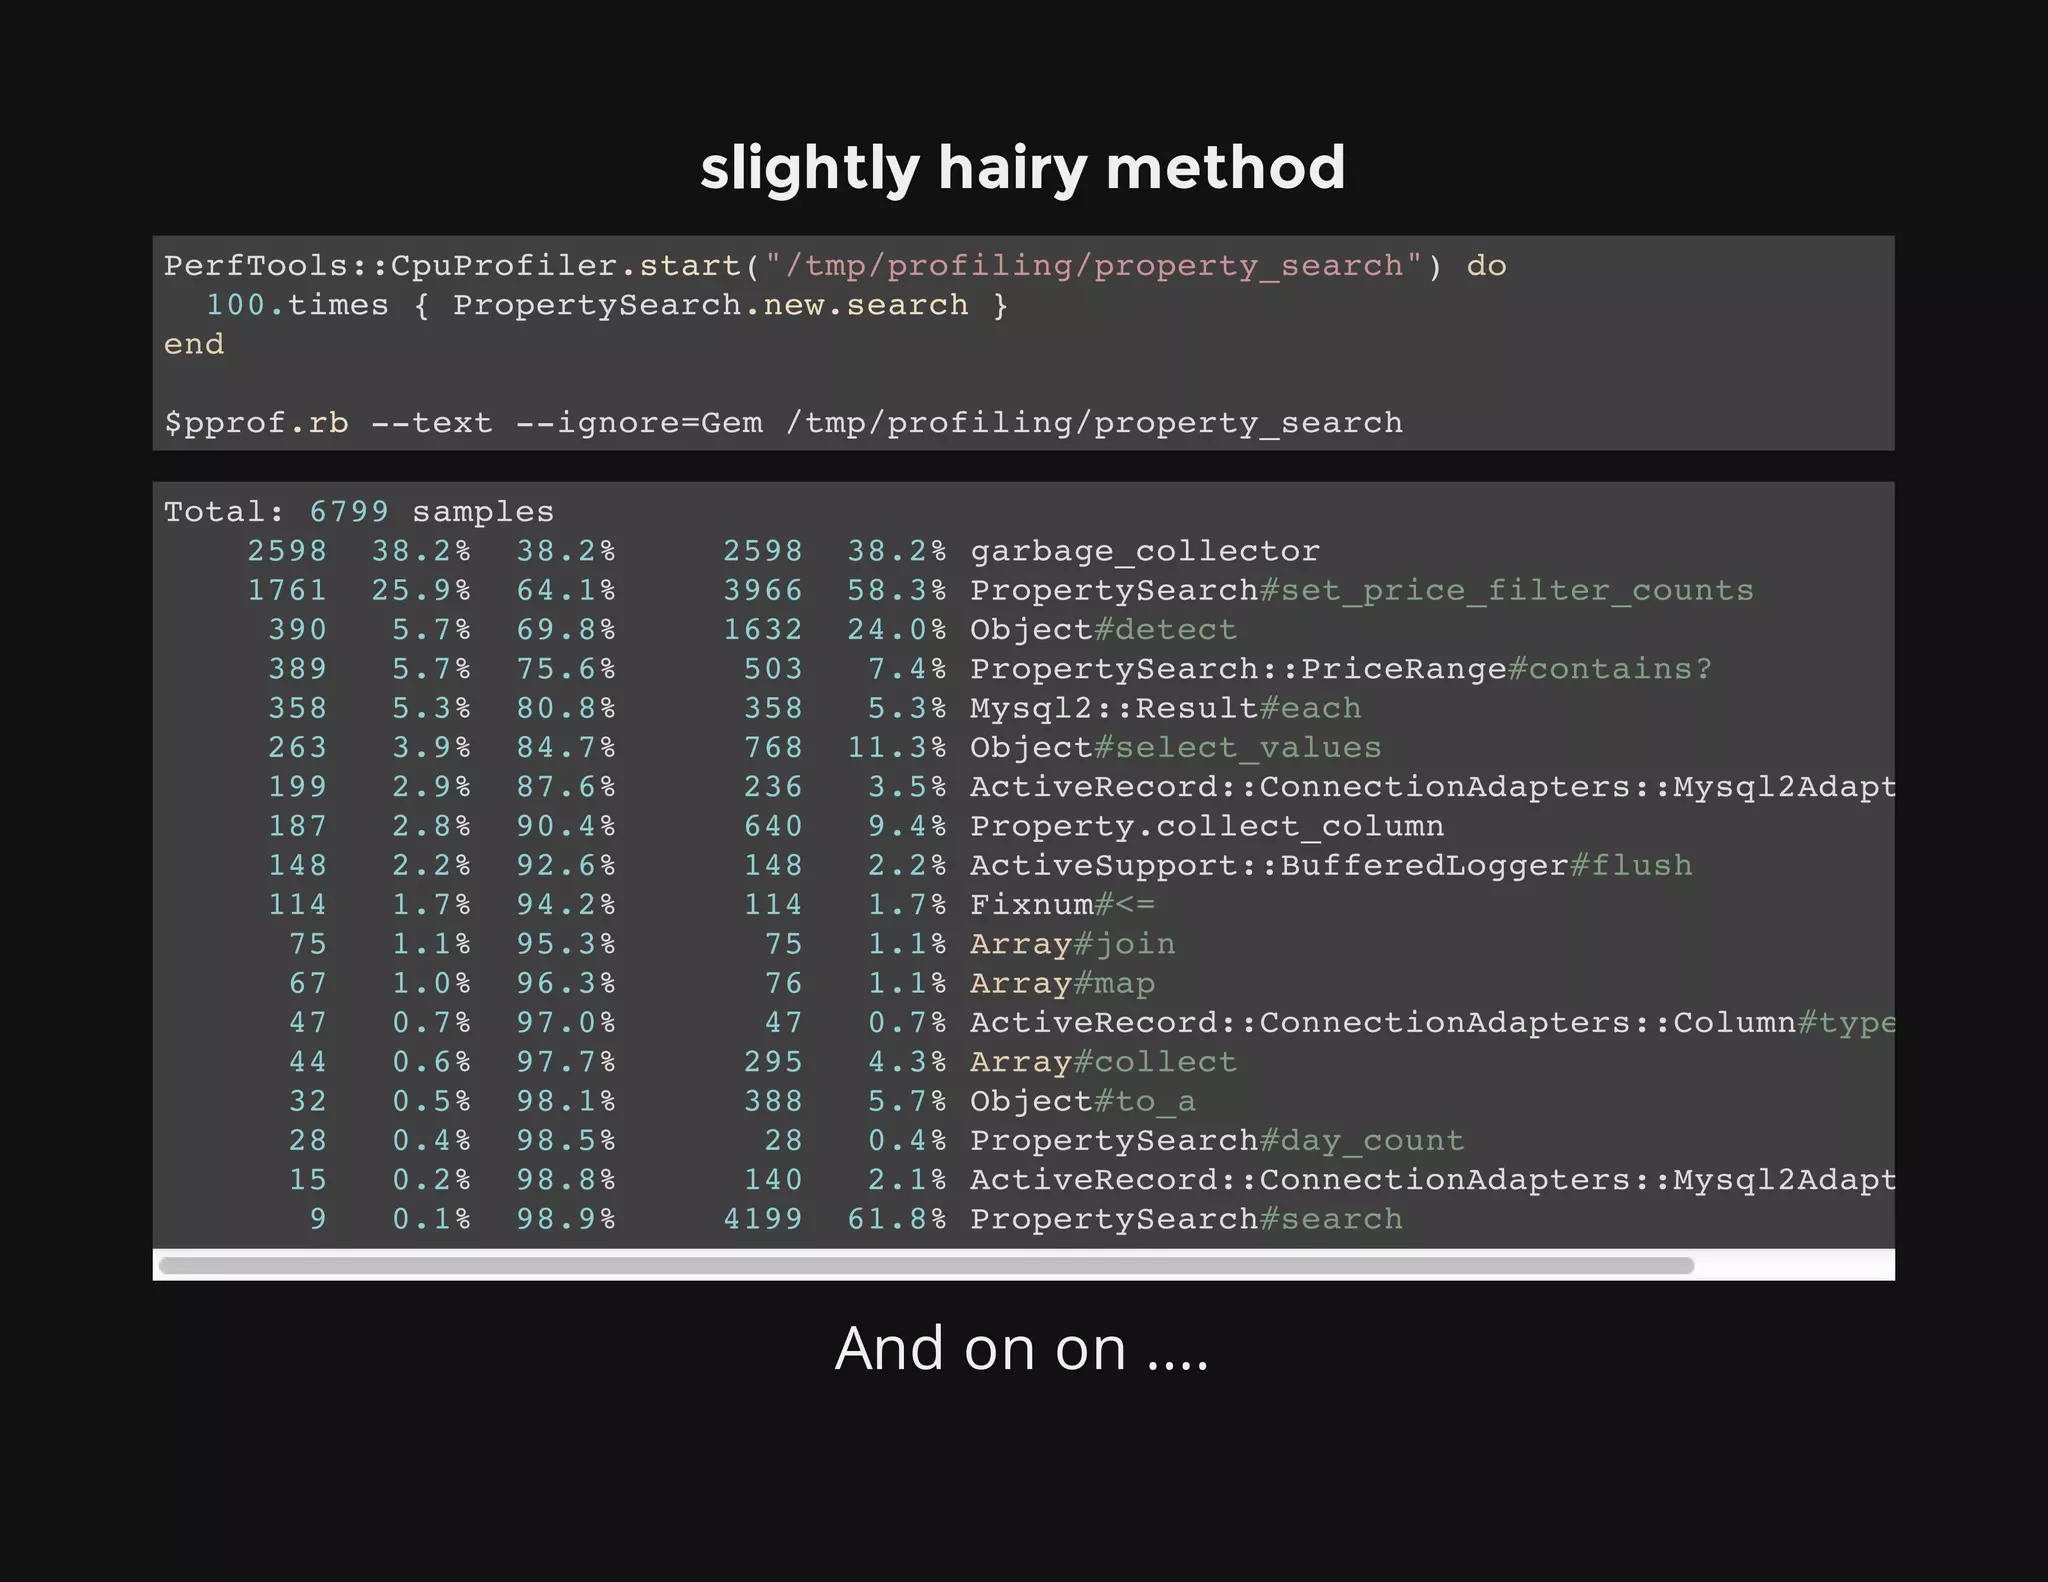
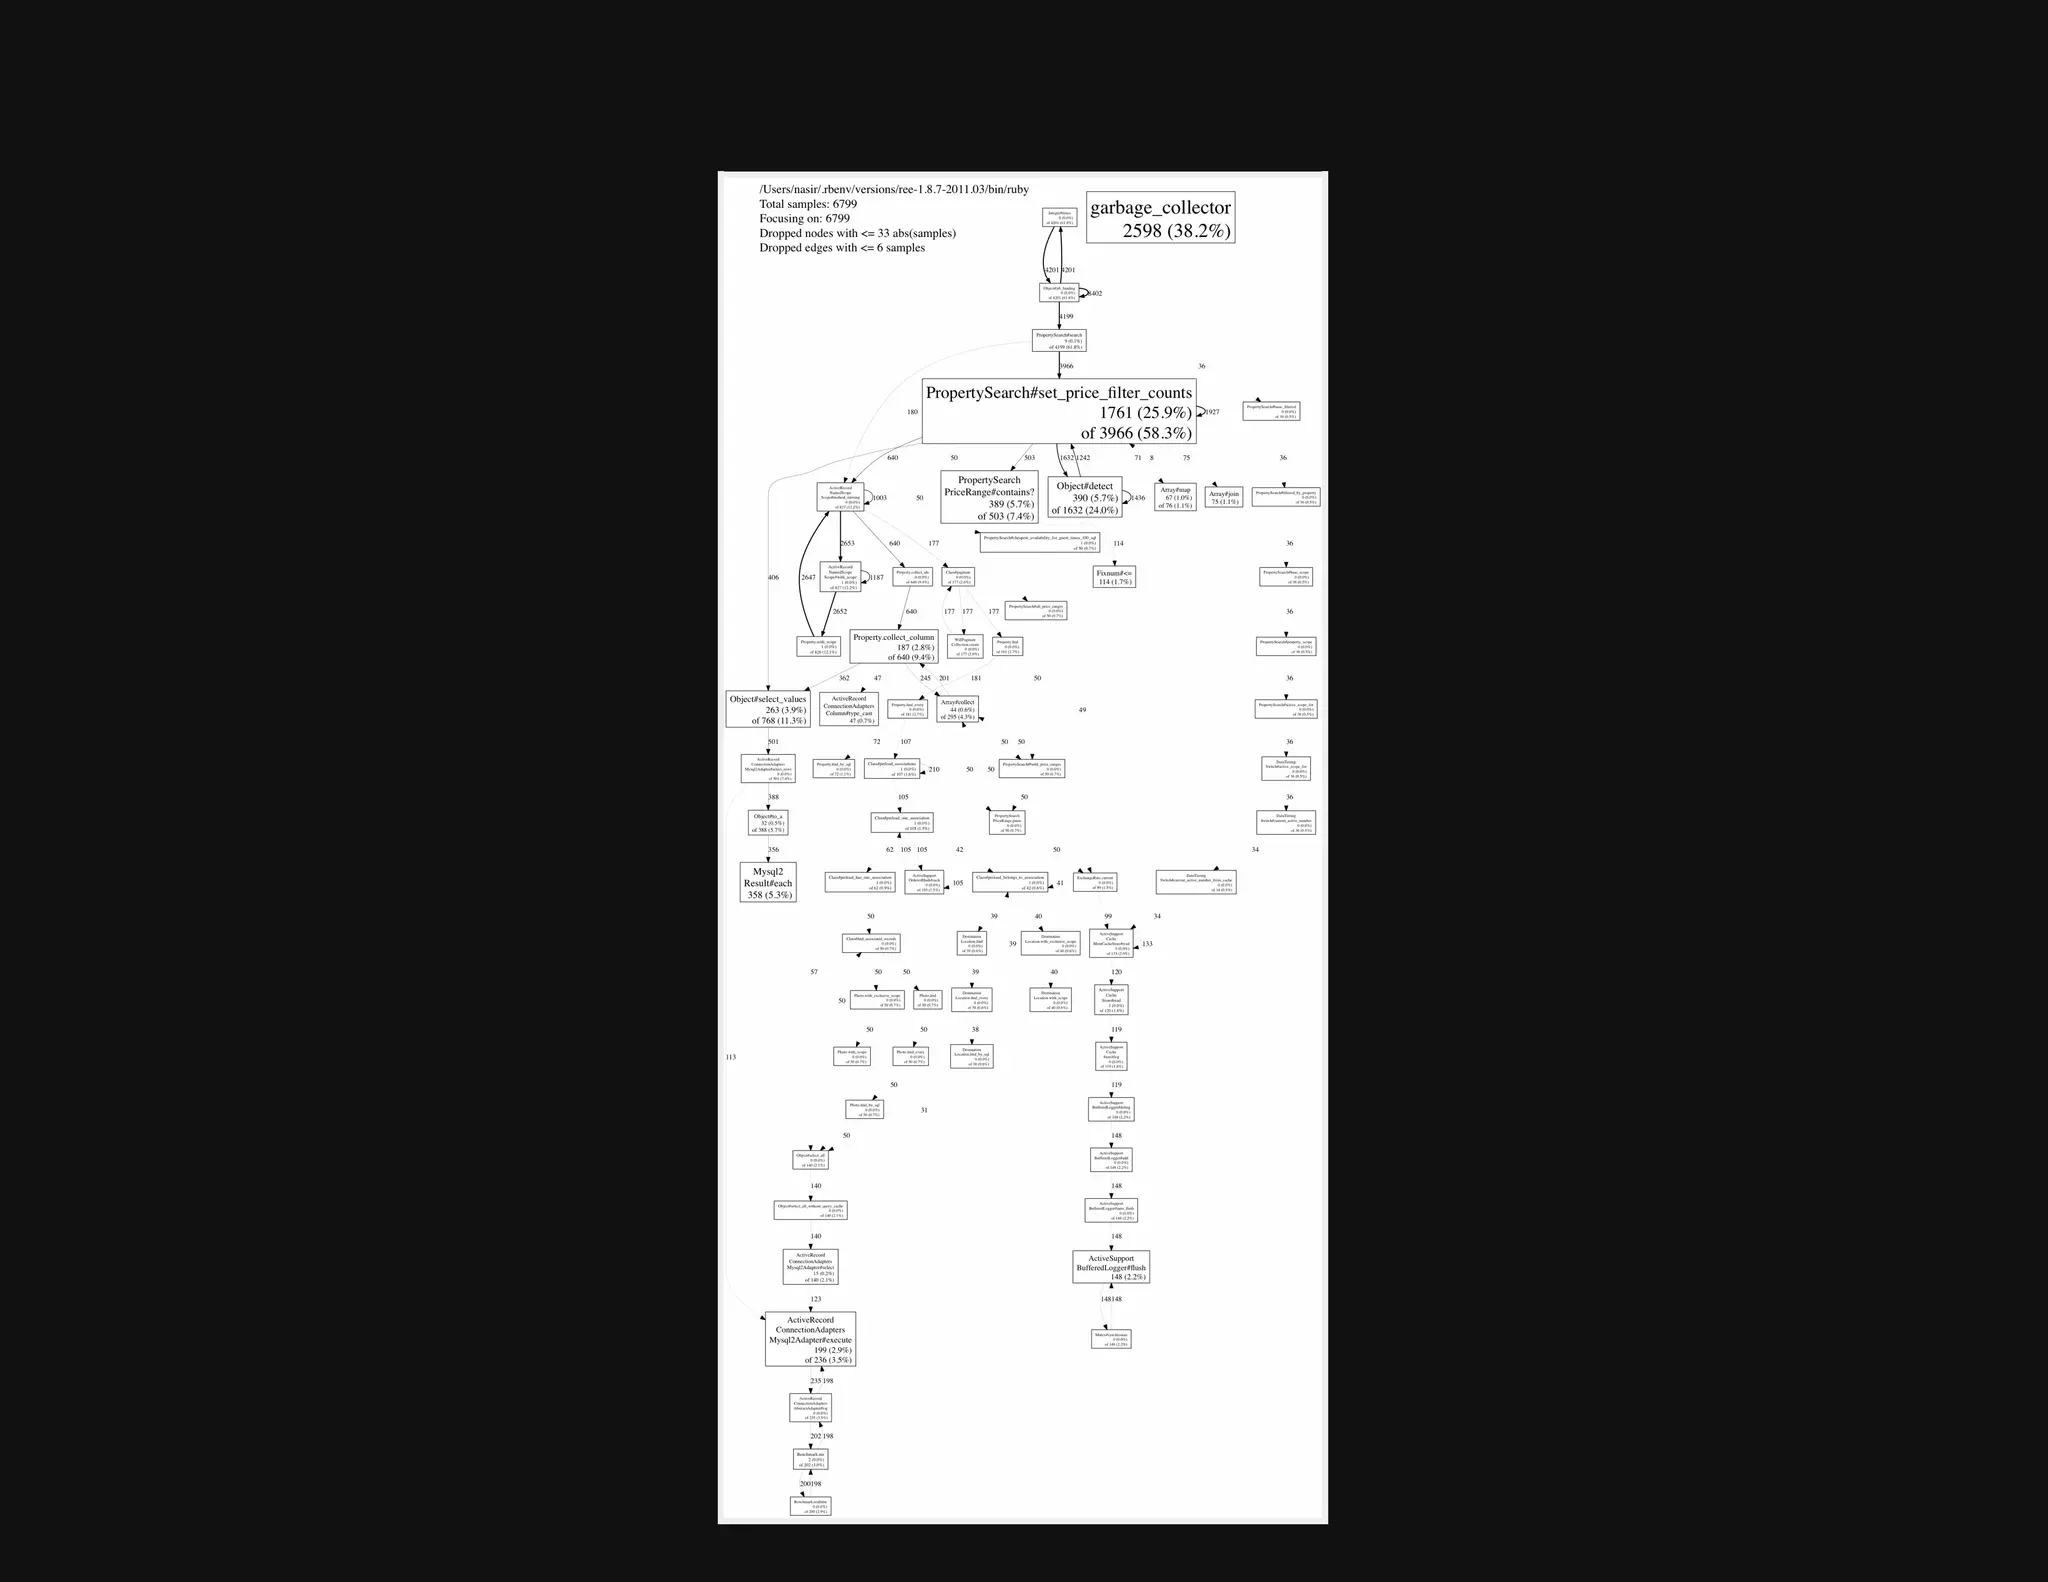
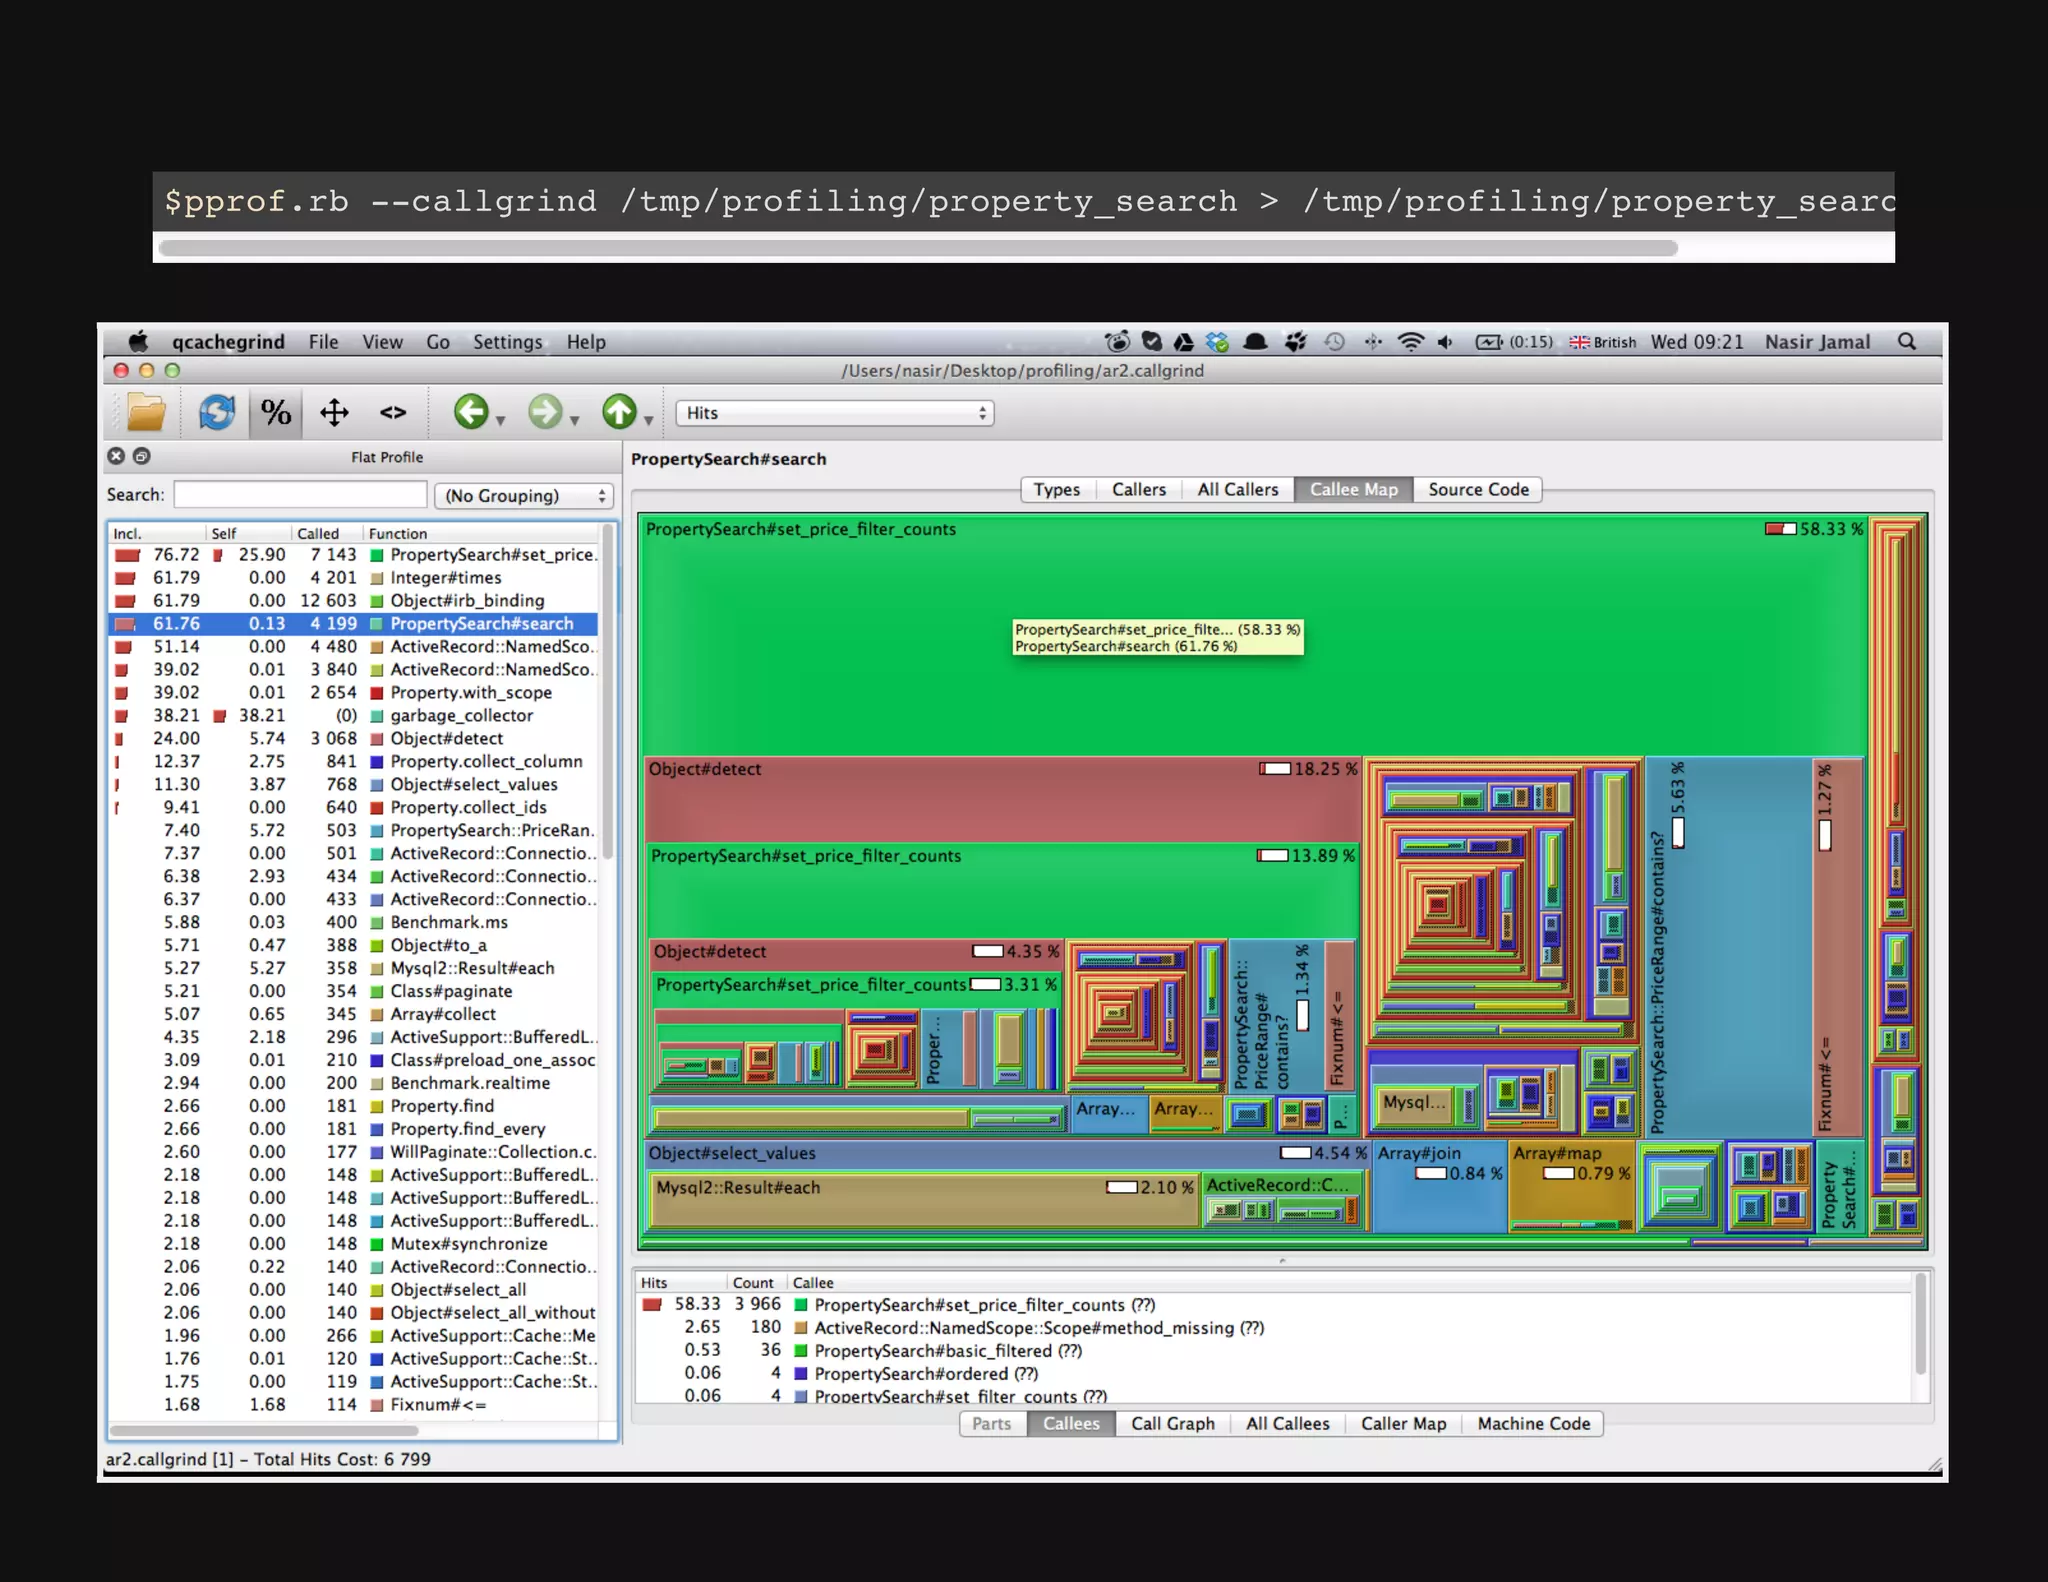
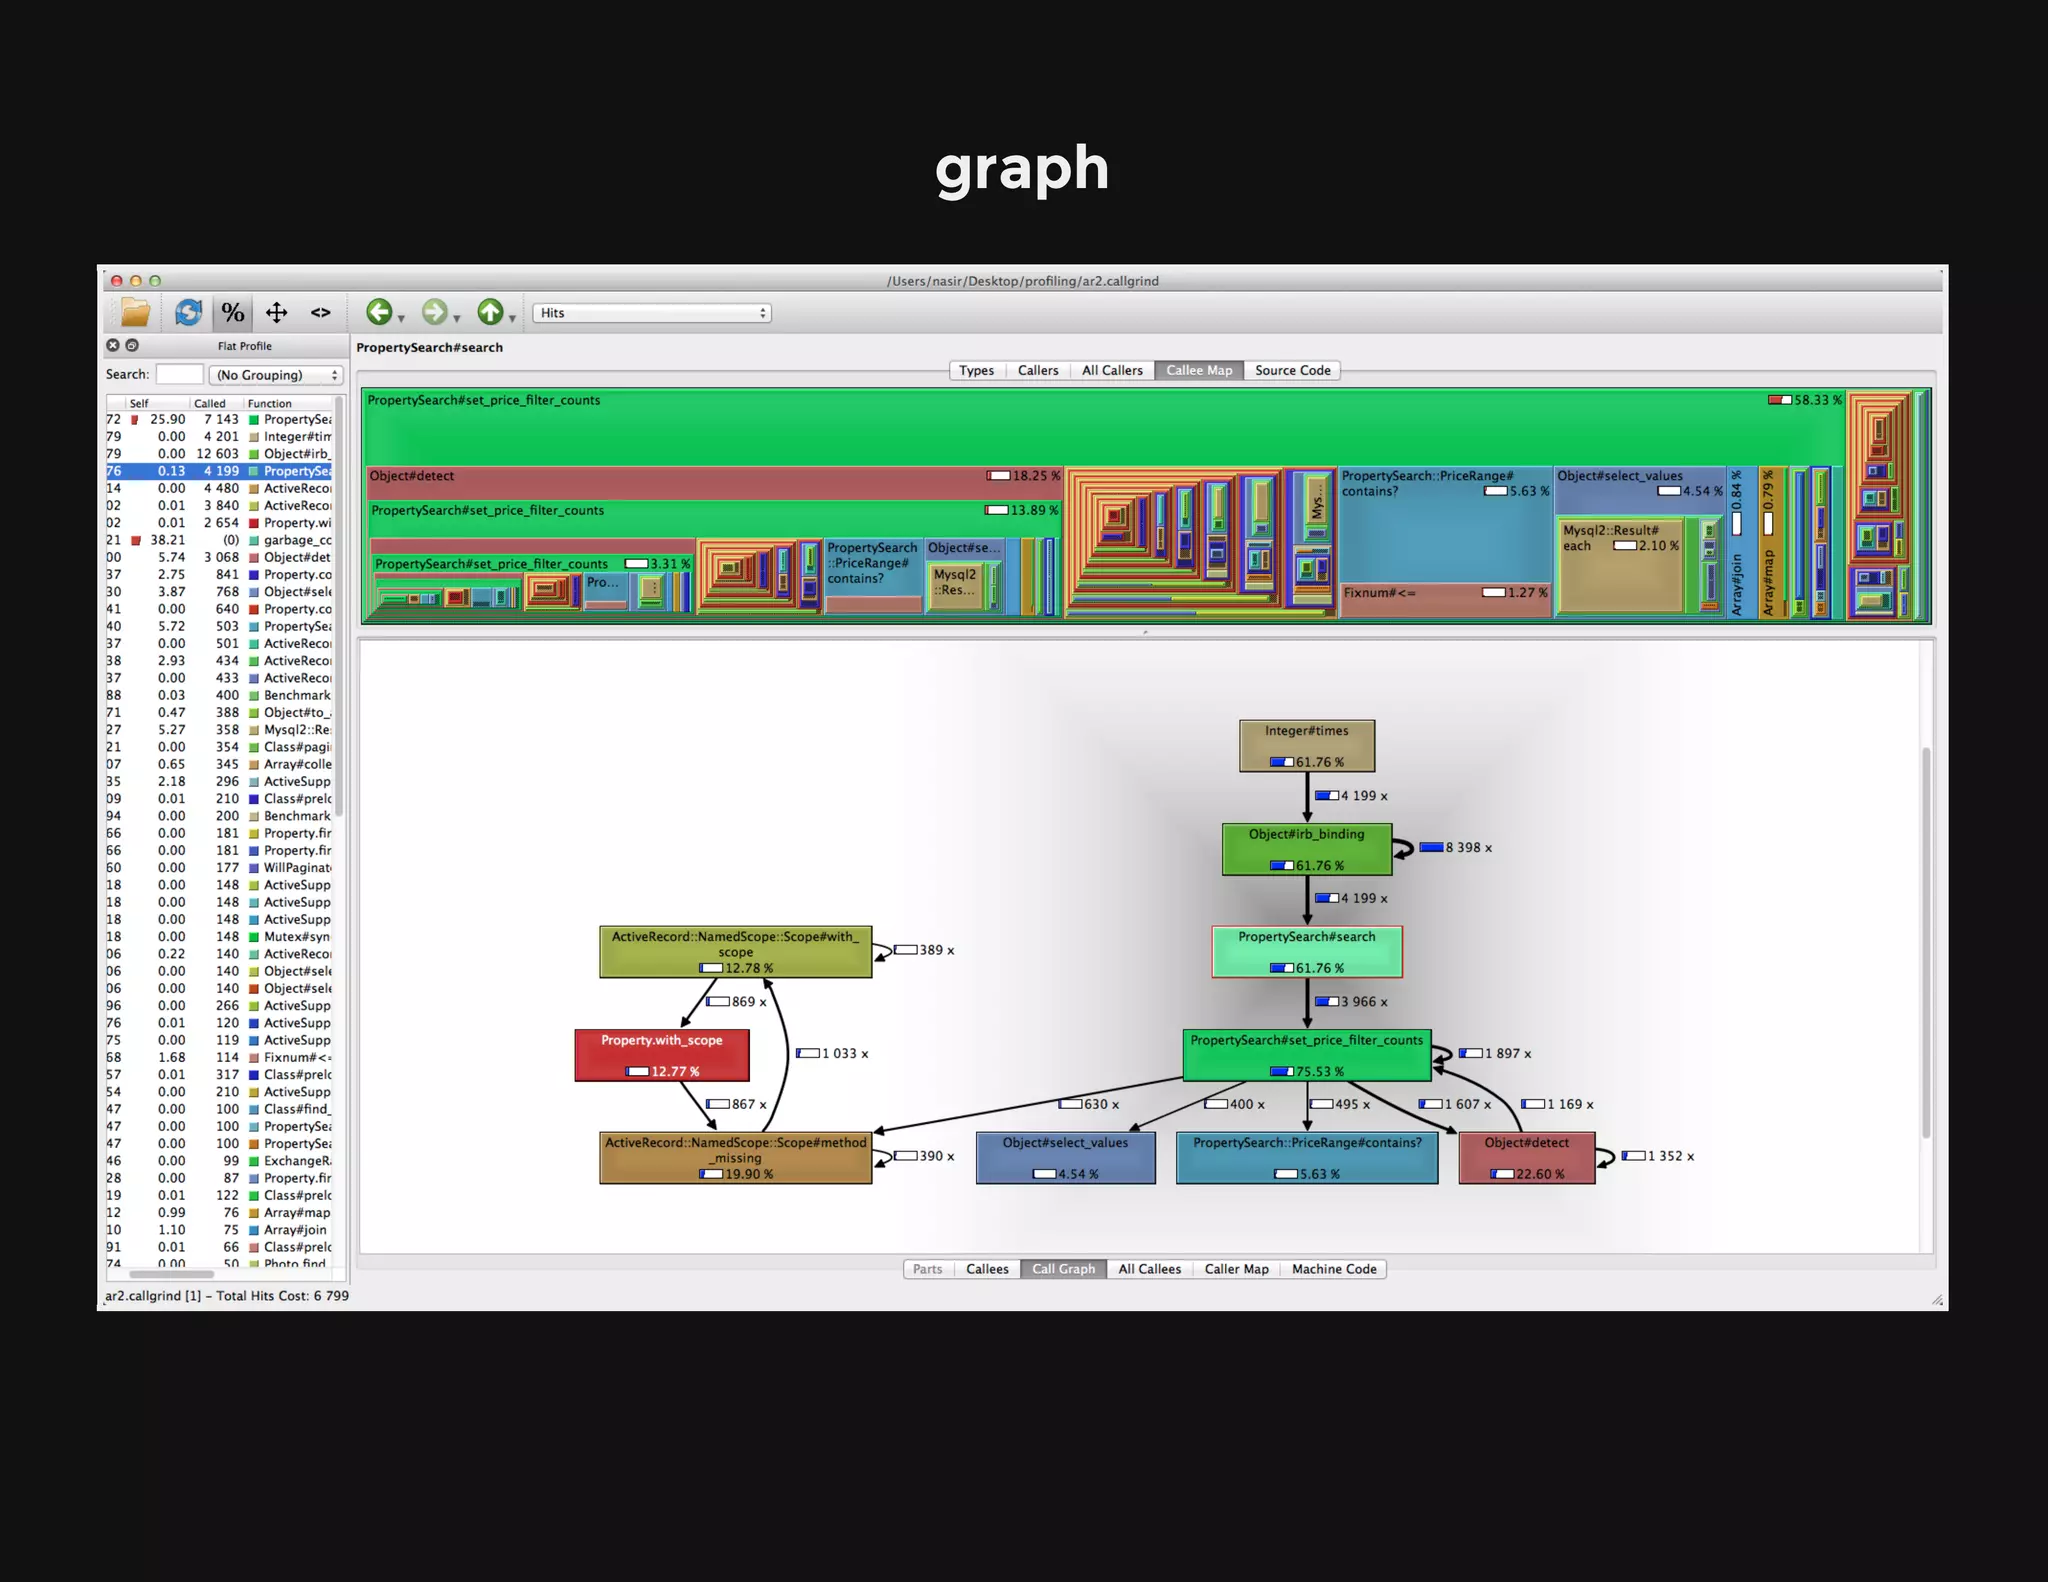
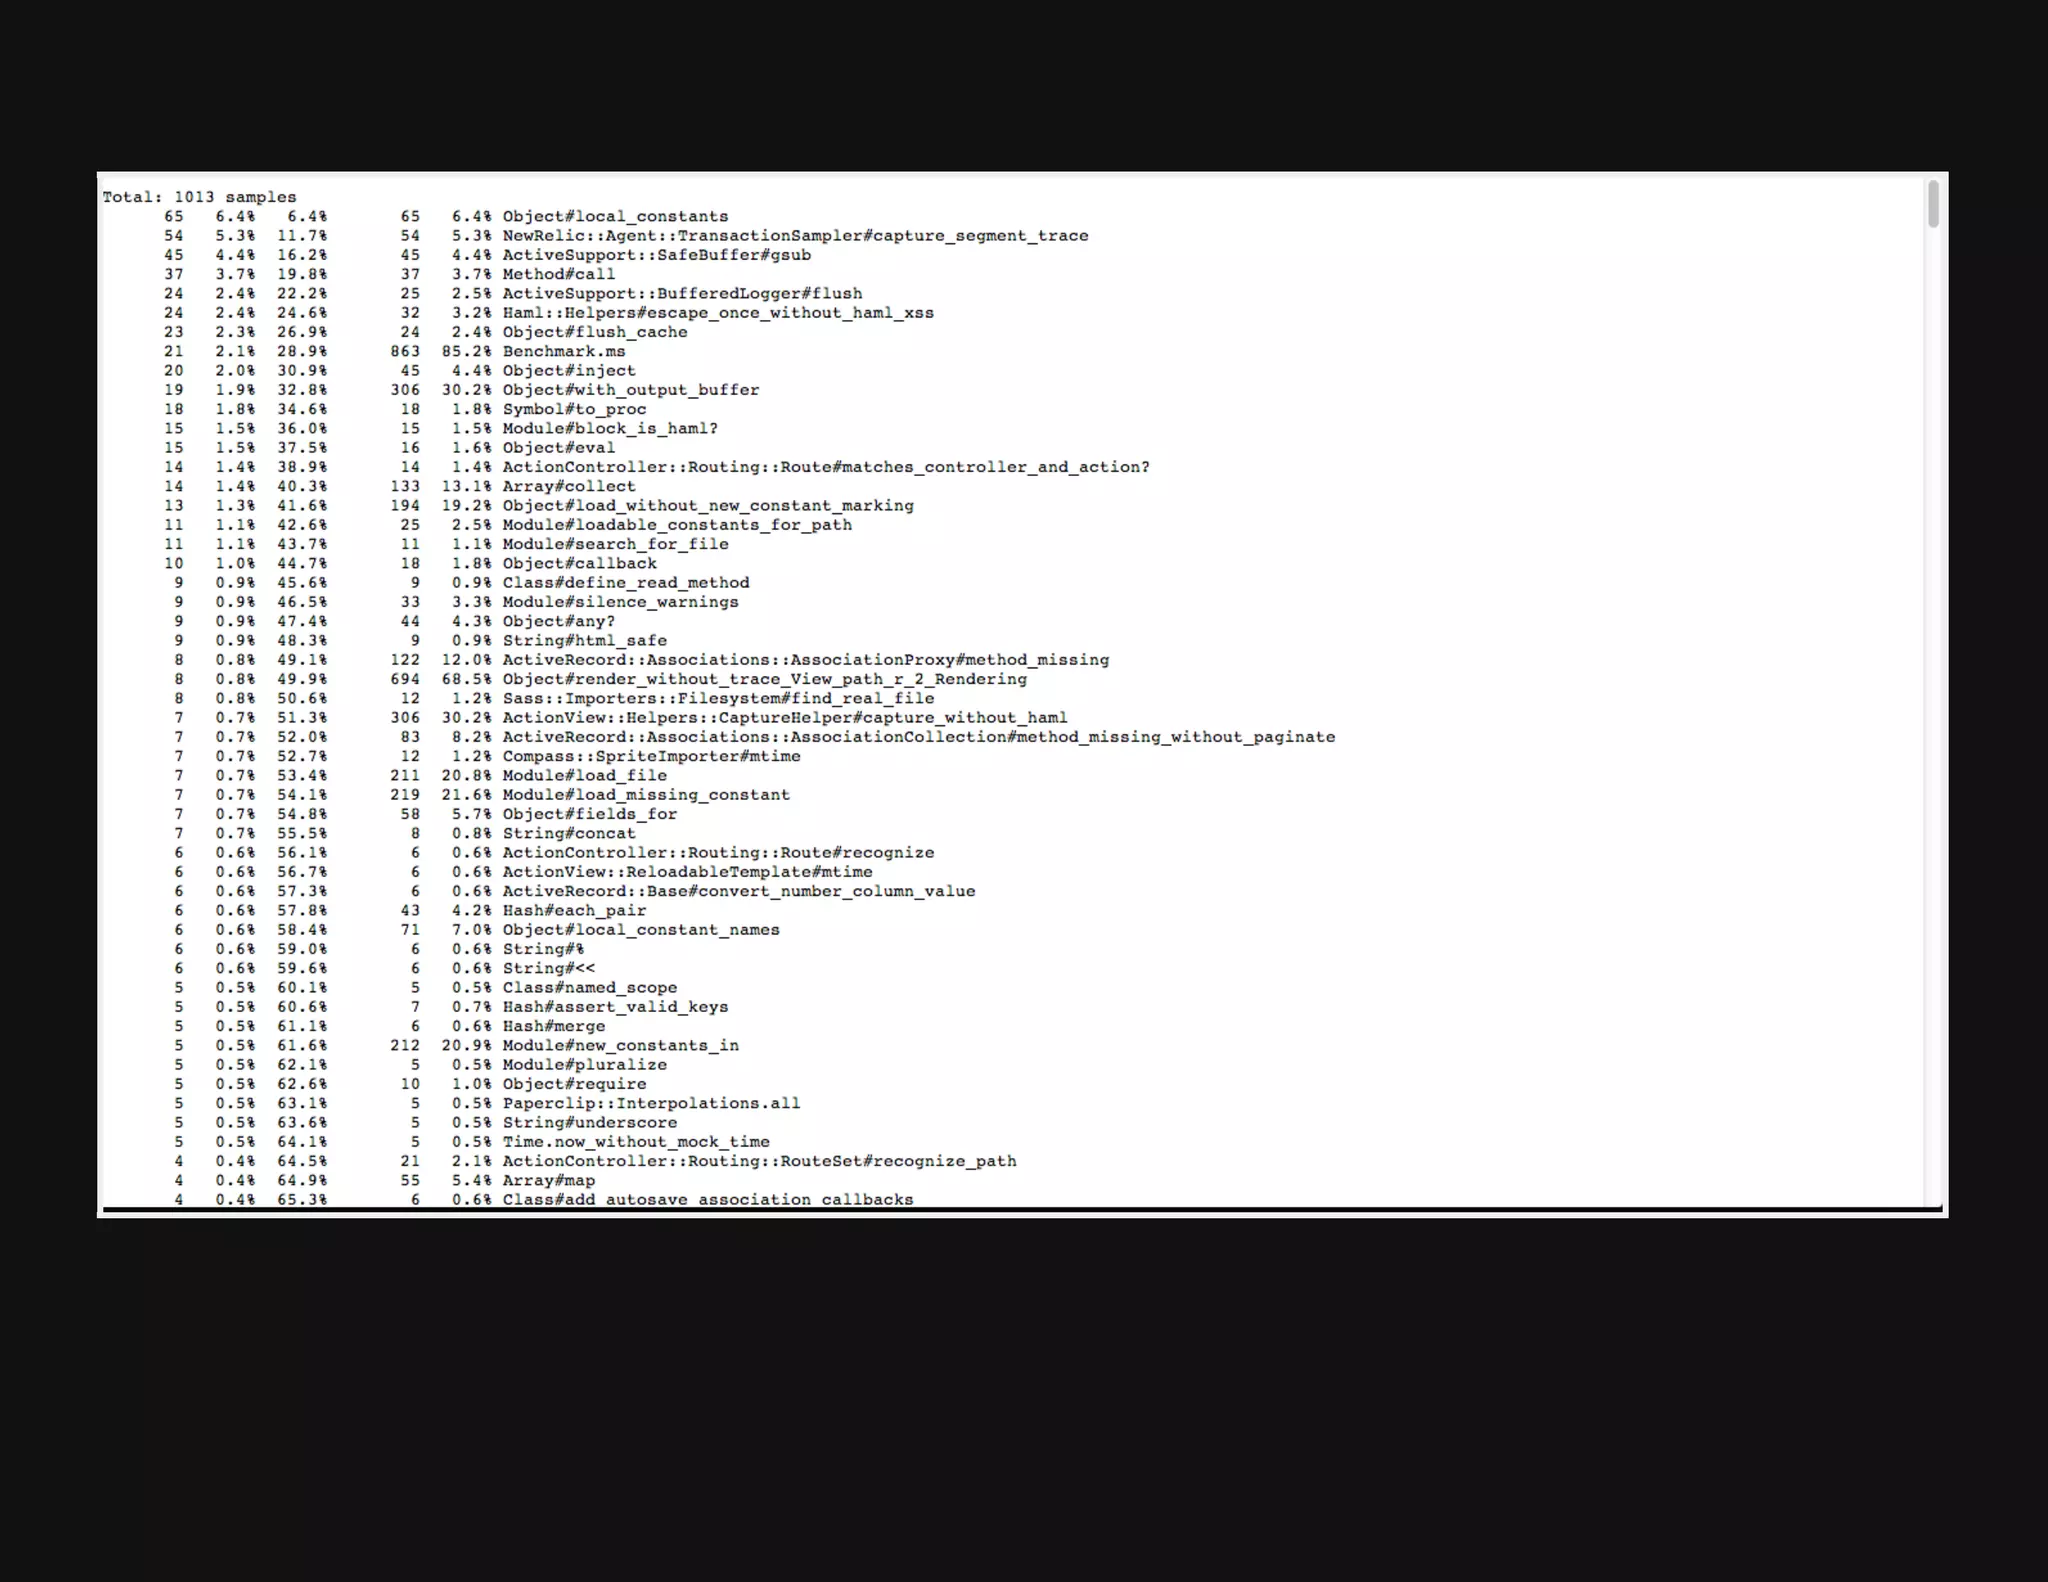
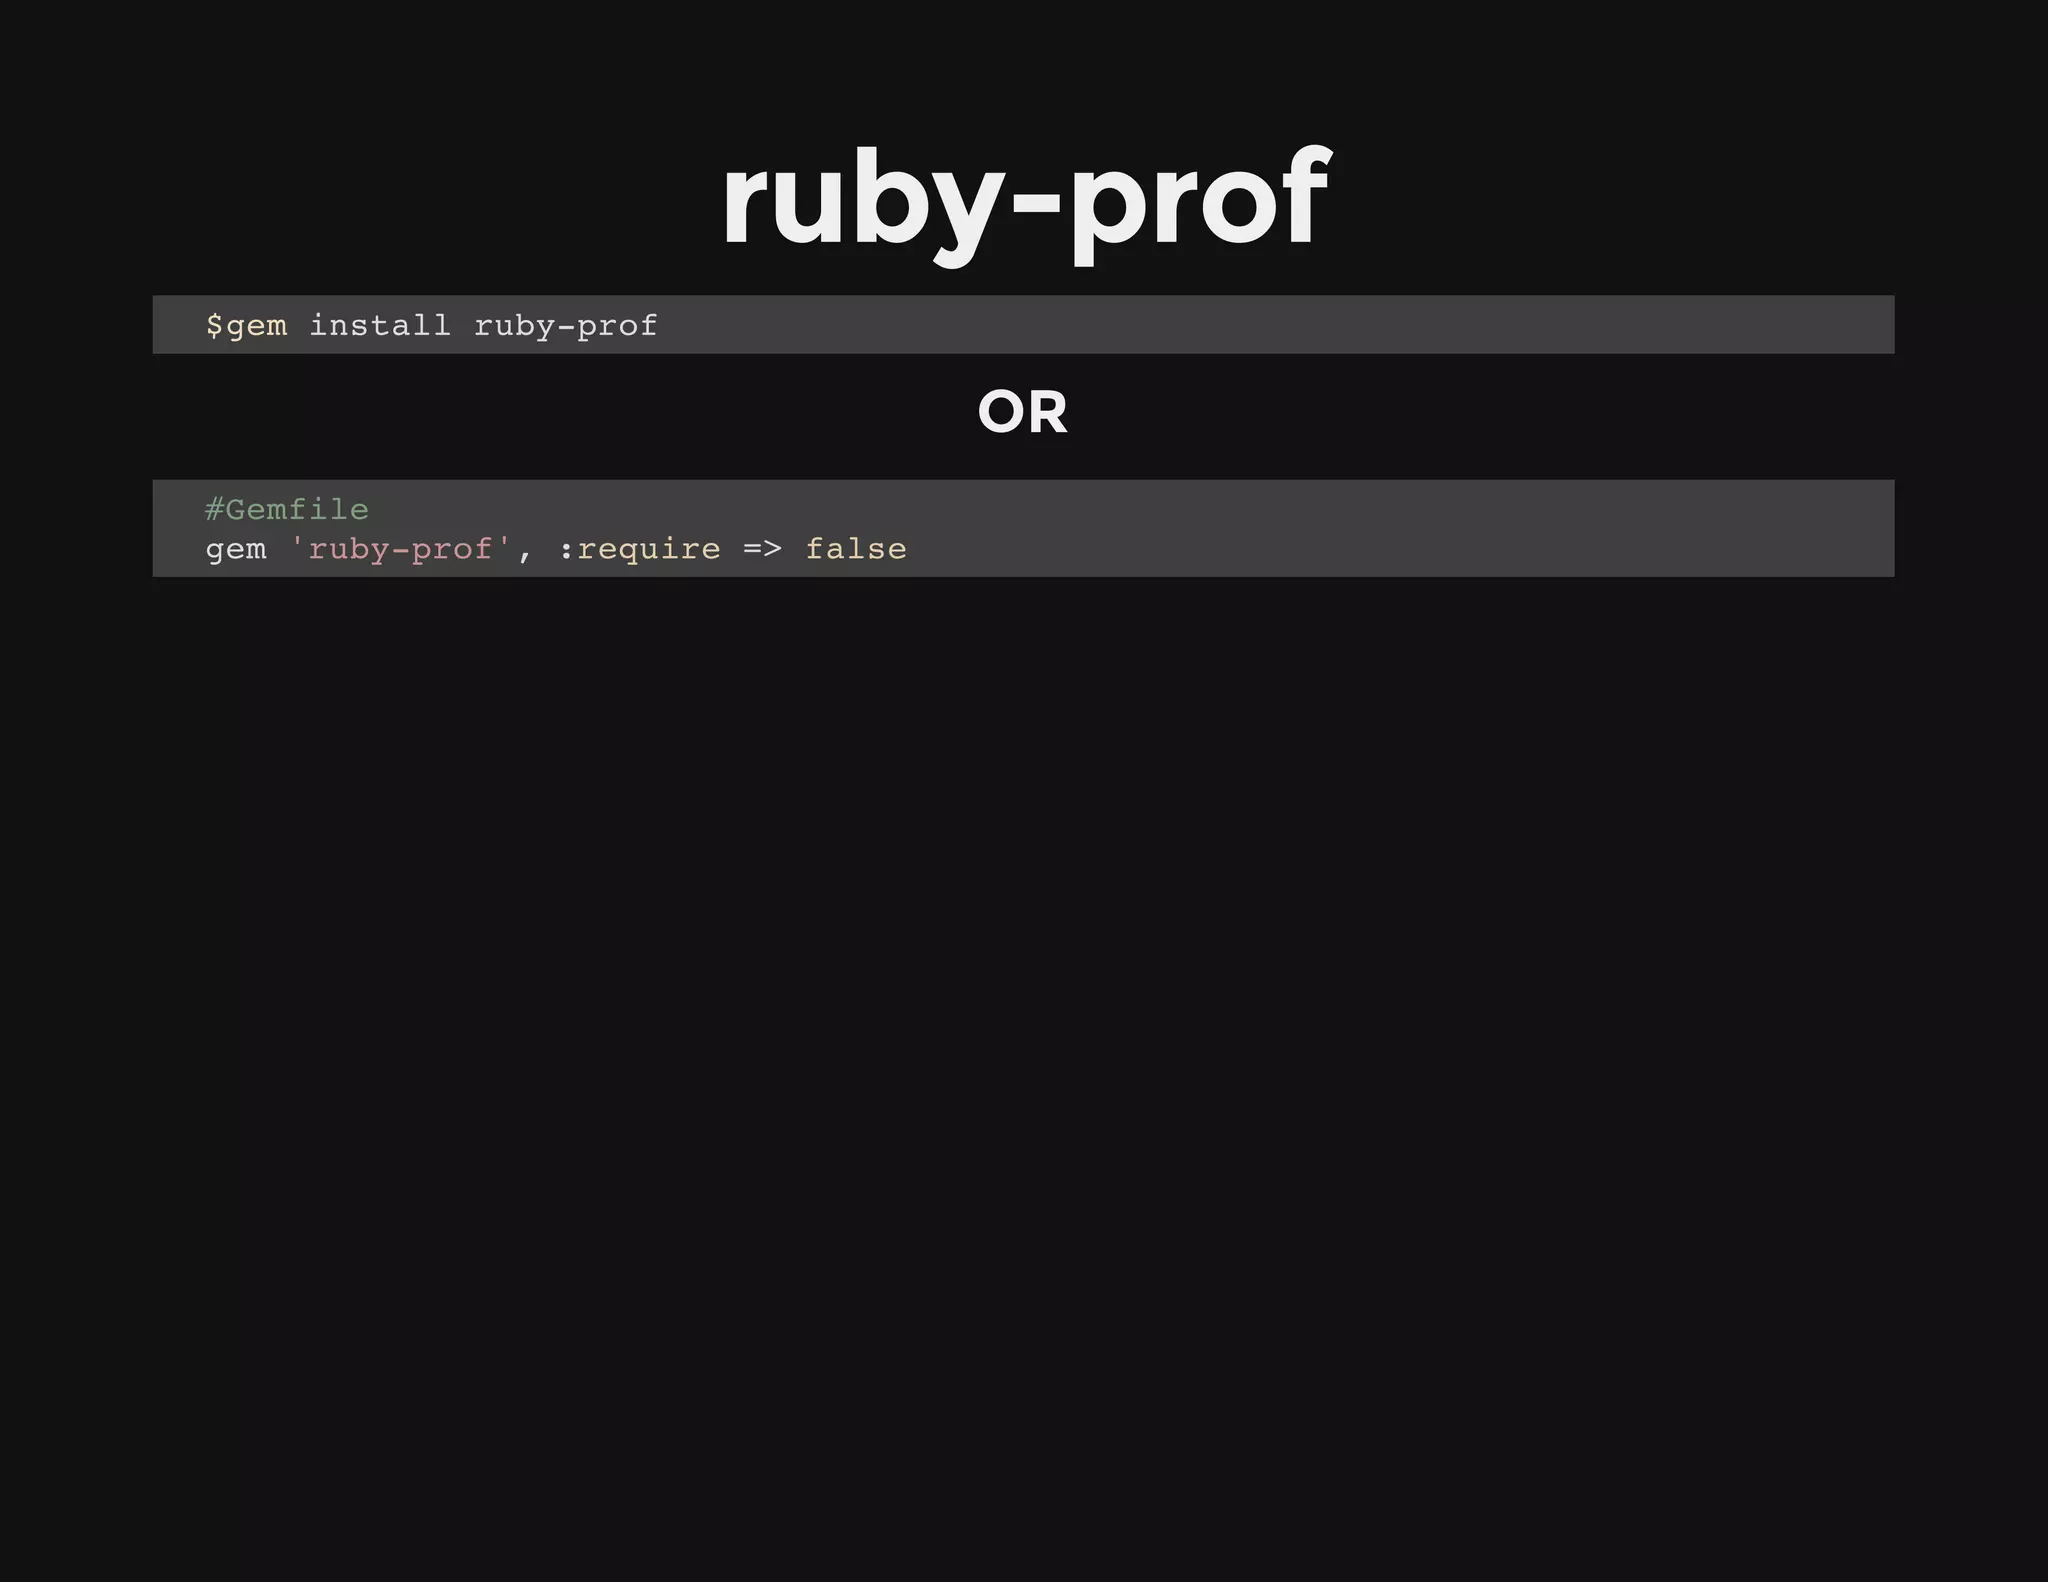
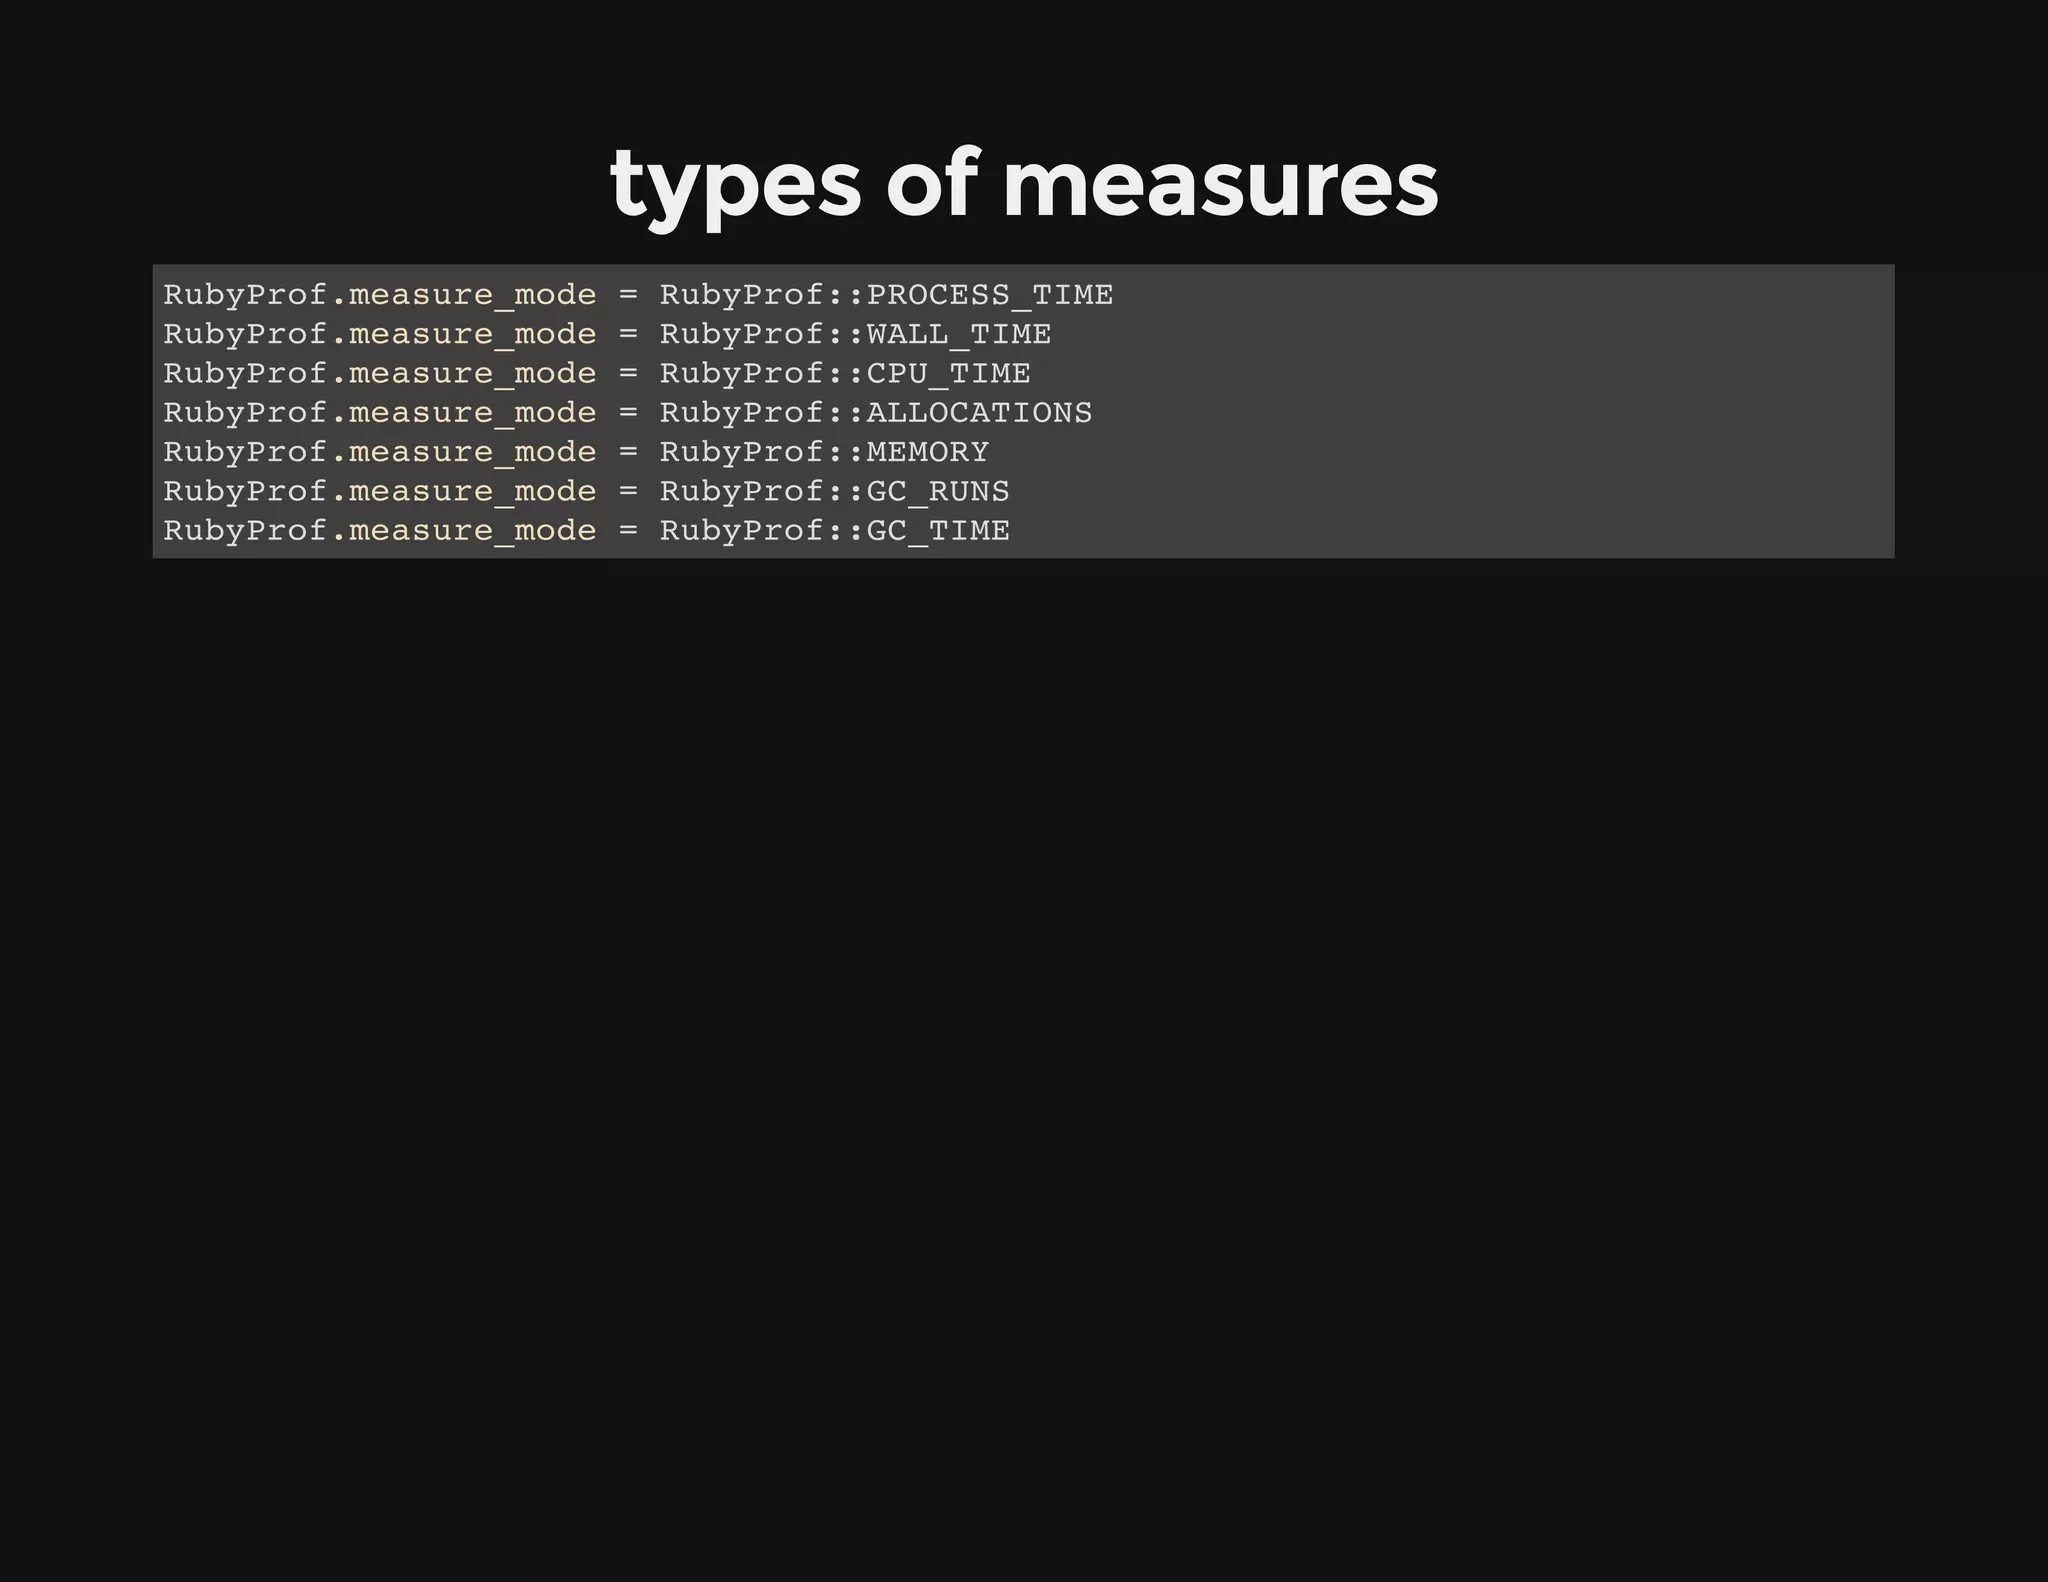
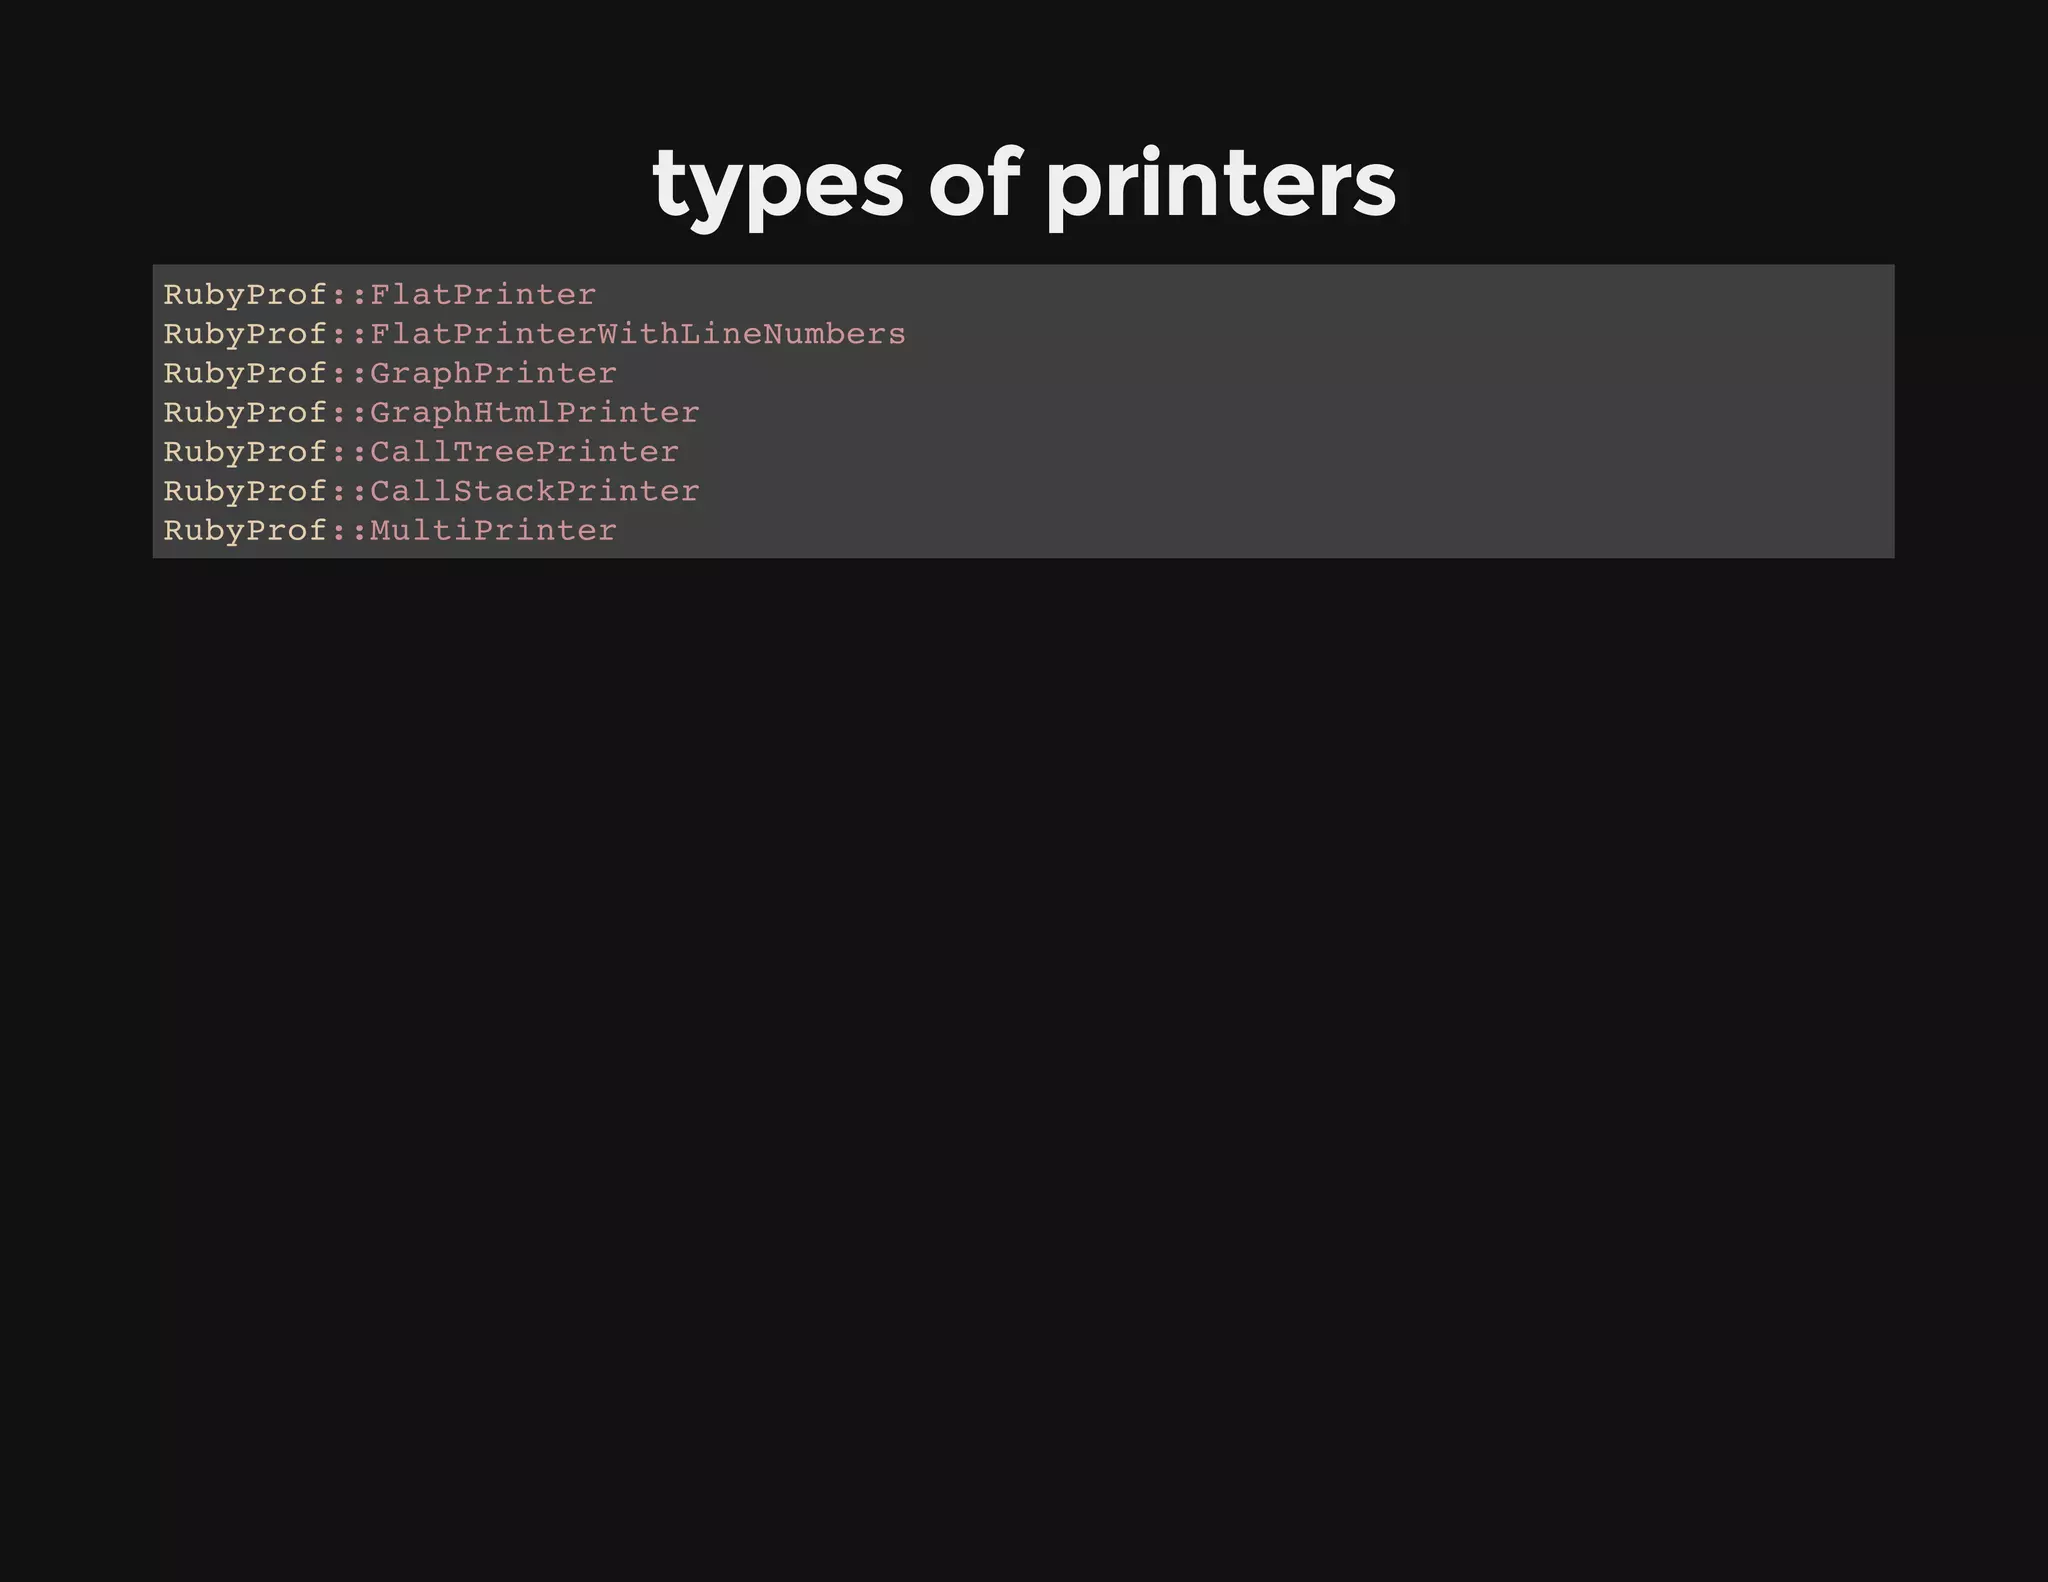
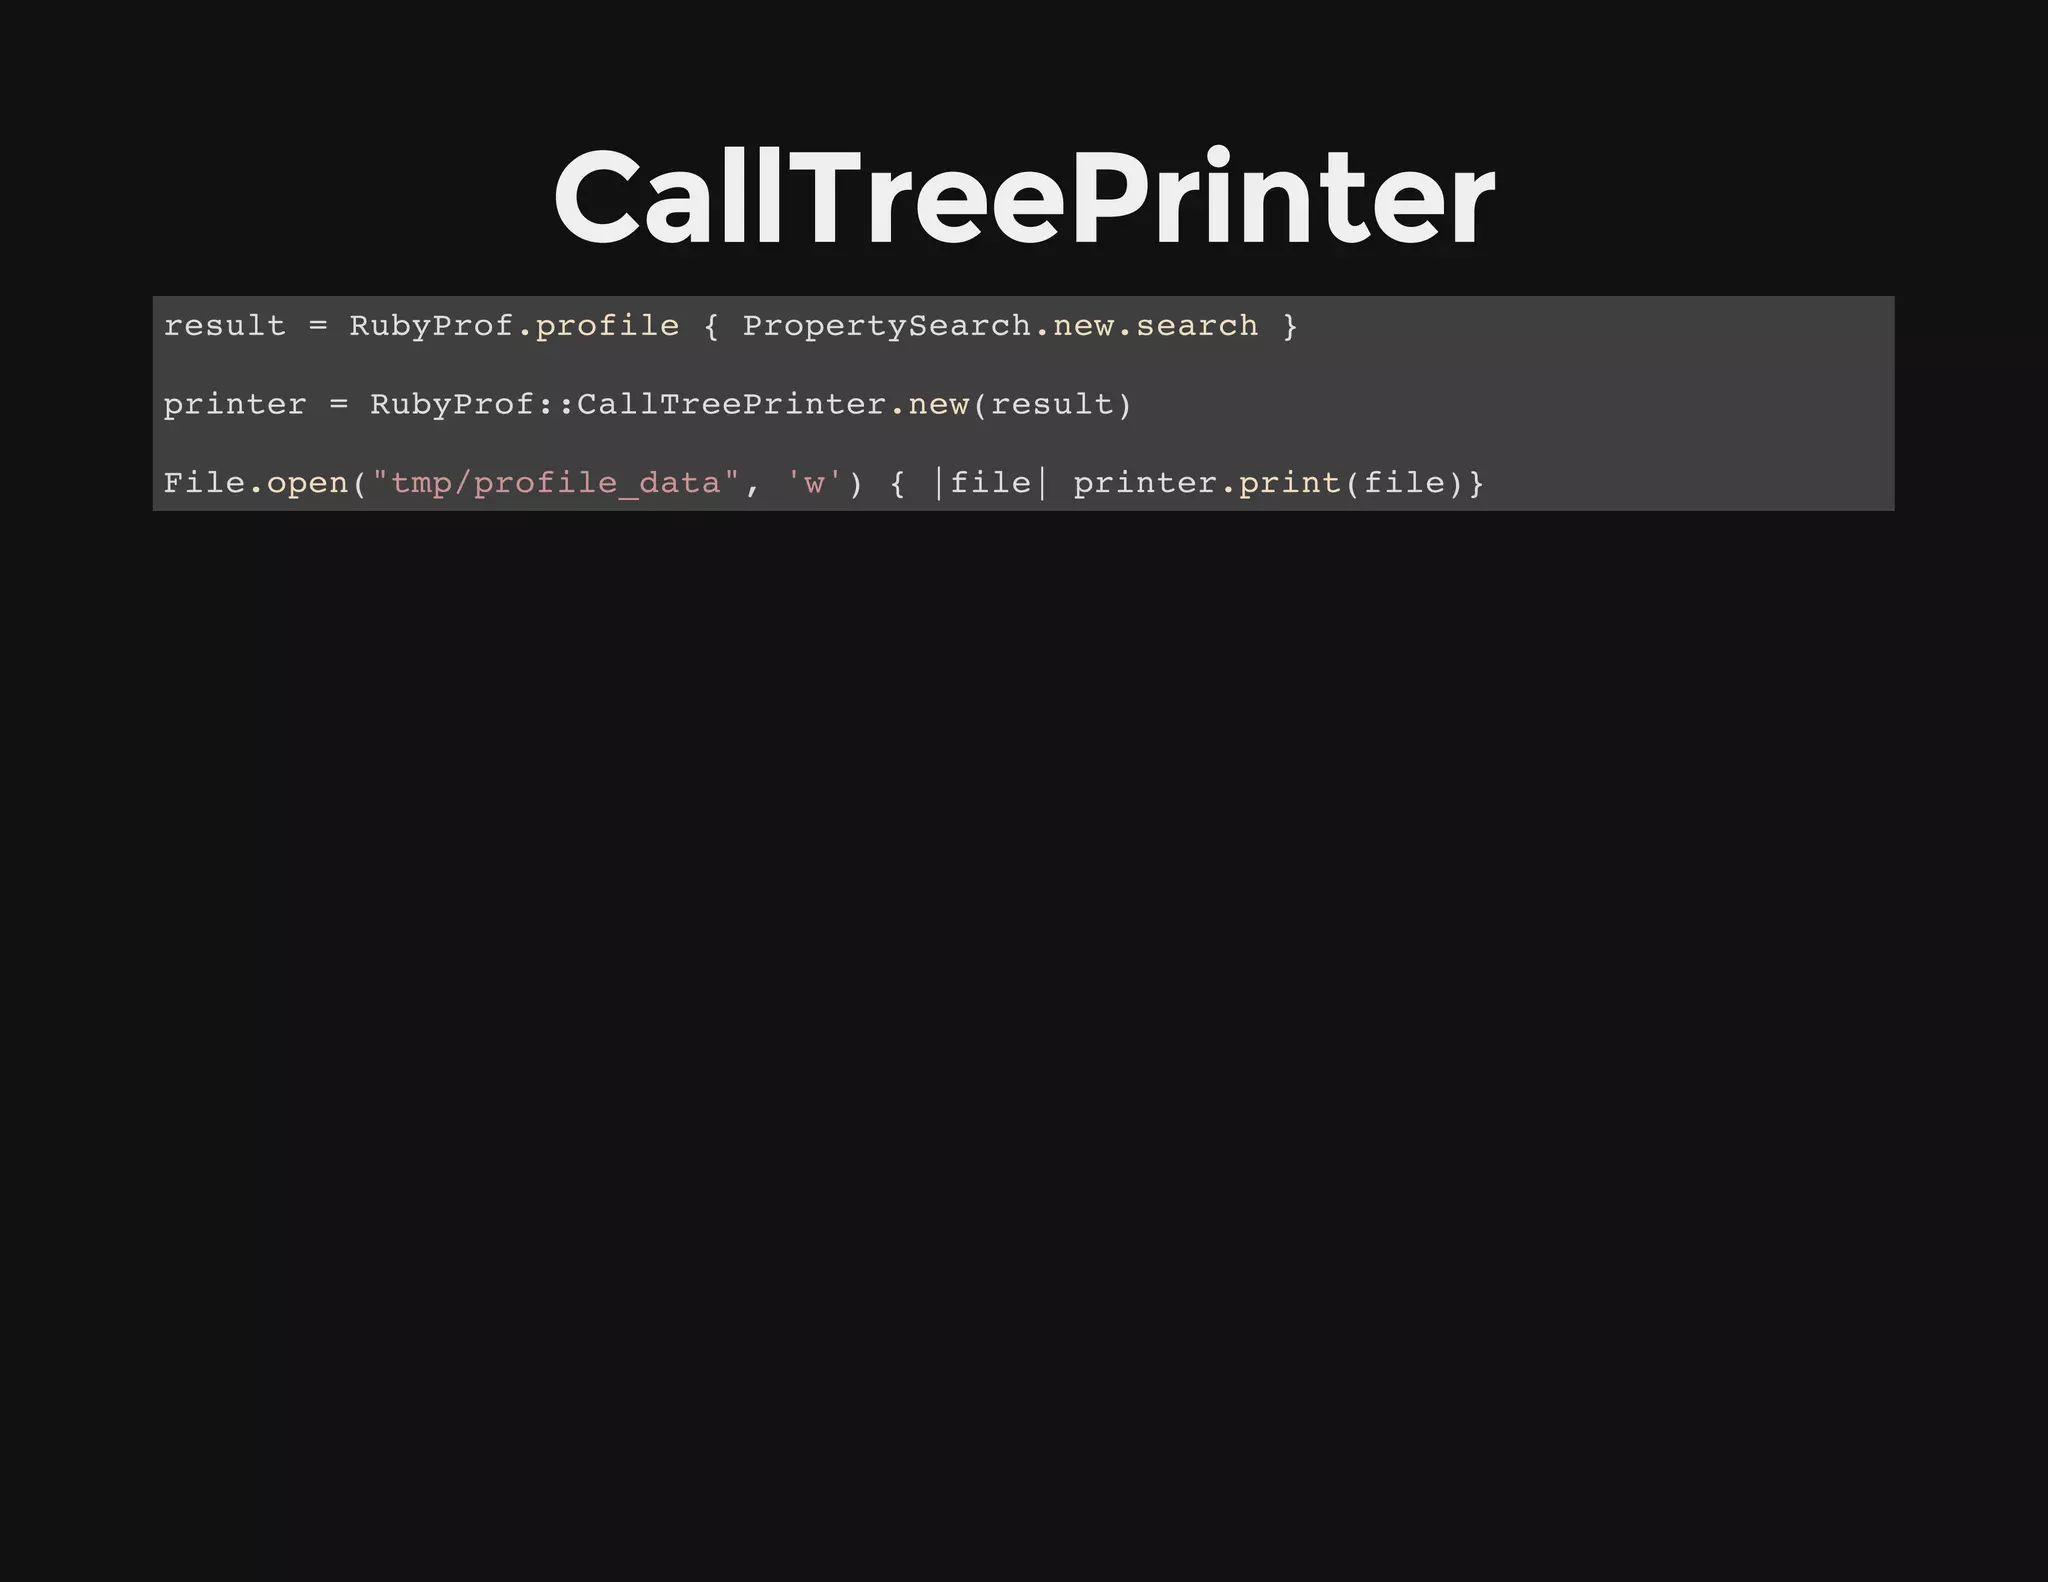
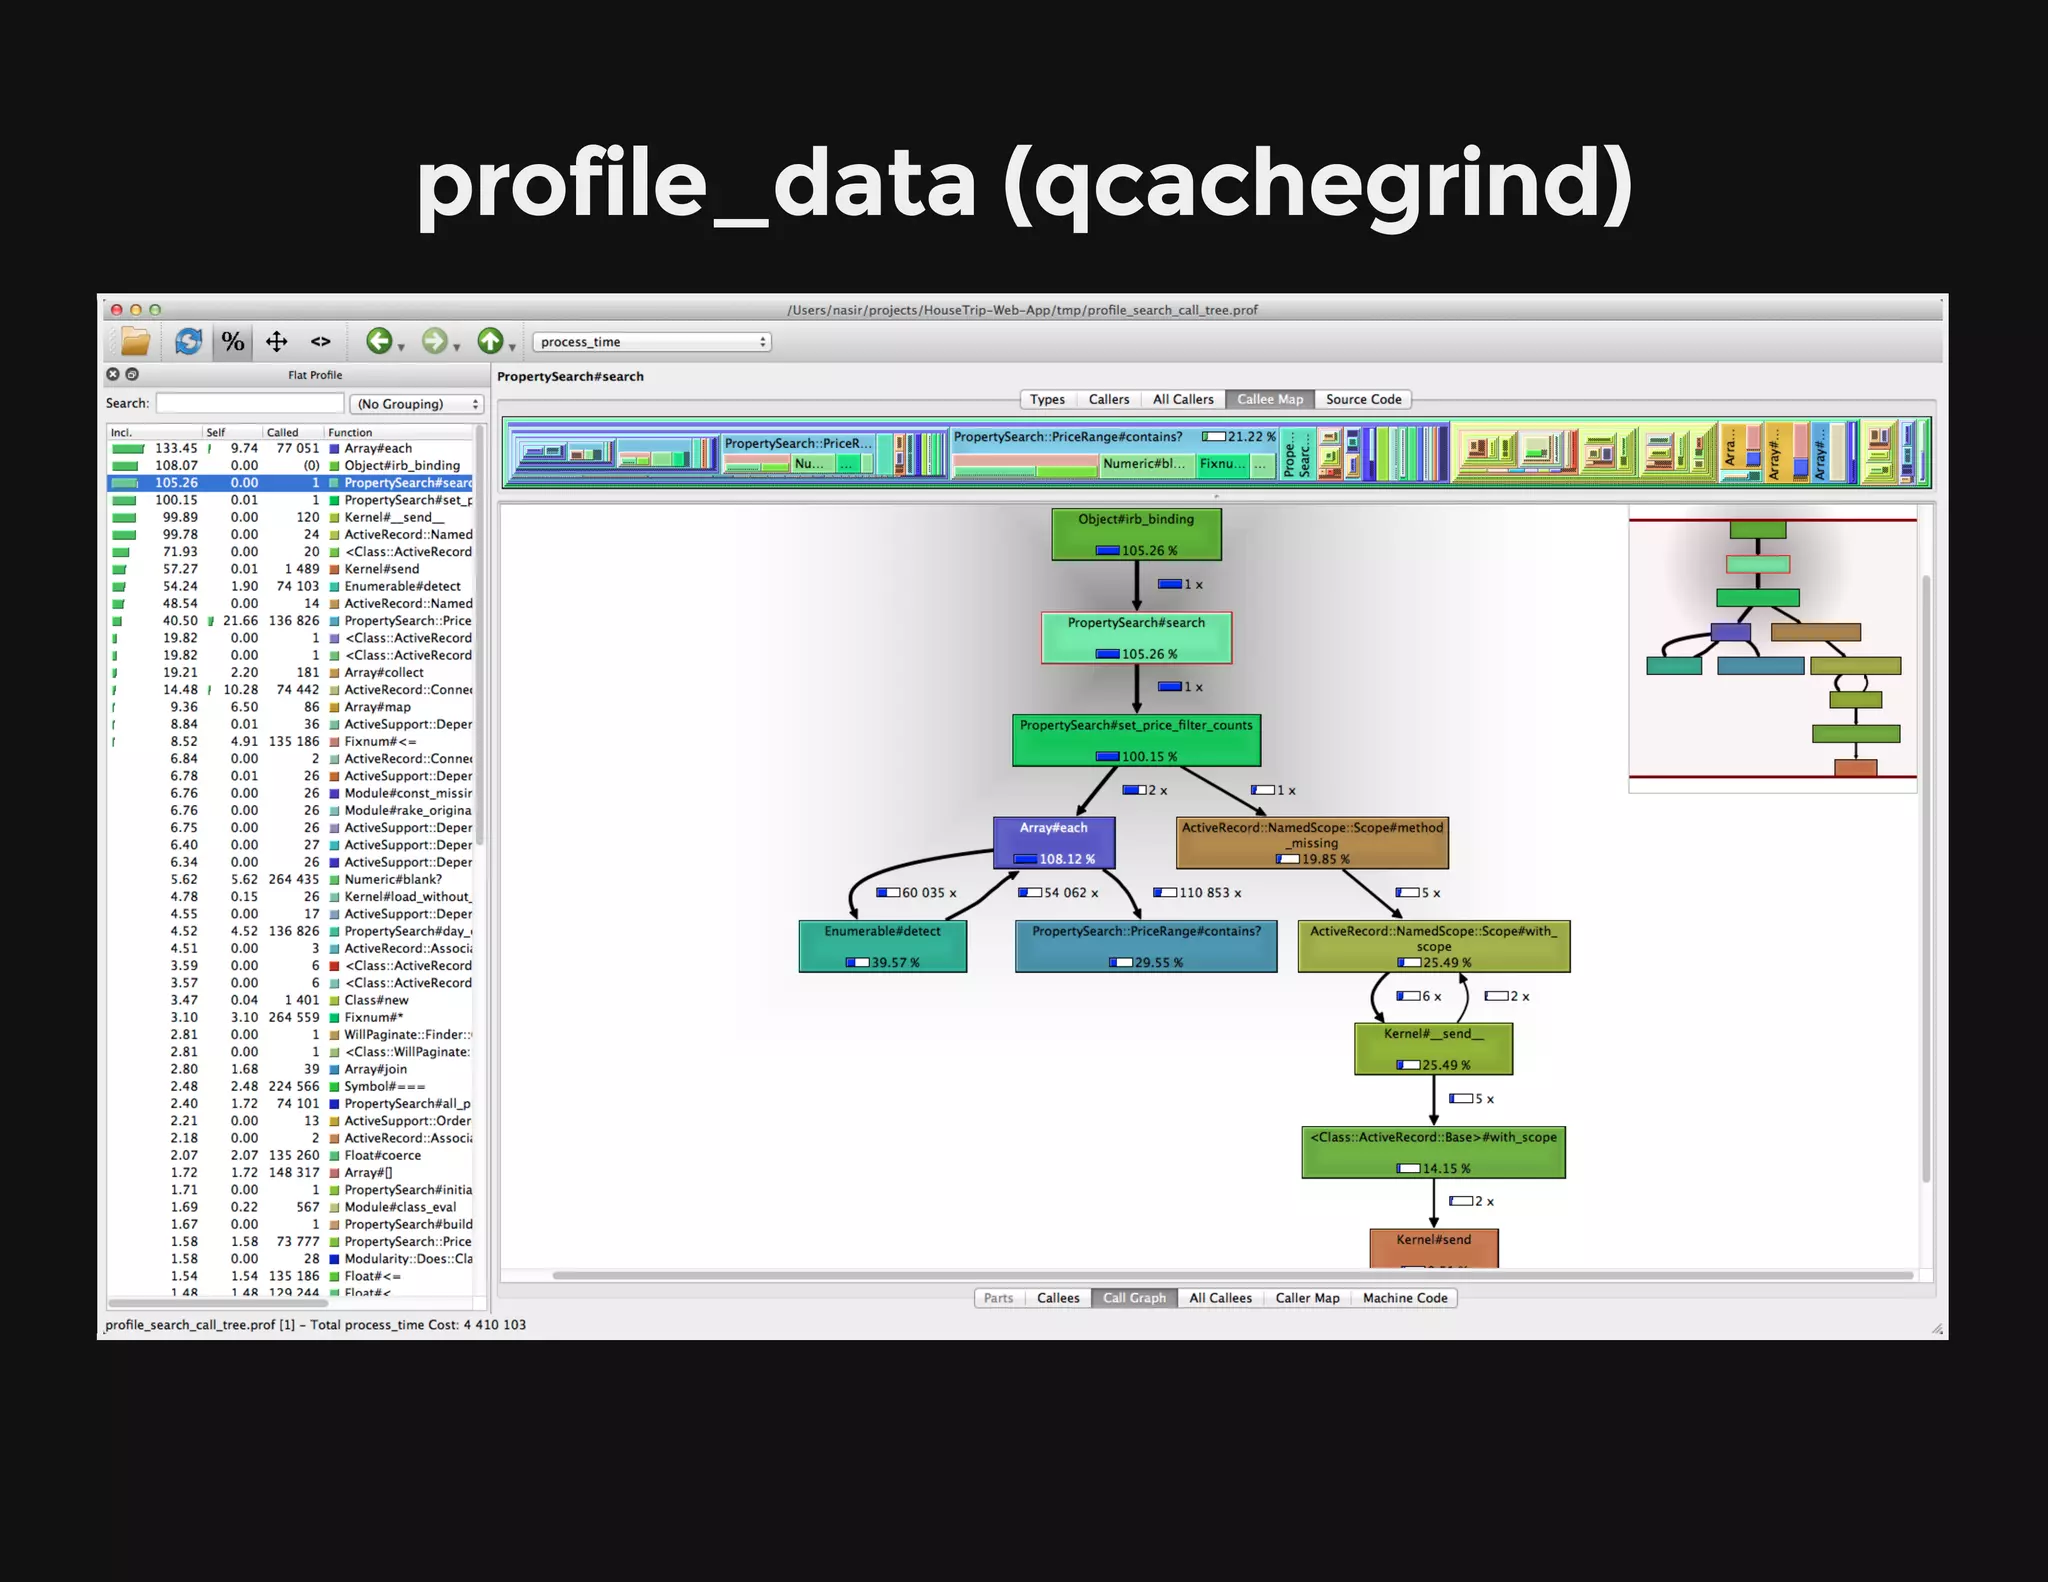
Profiling Ruby
Where and what to optimize in your code
/
jobs@housetrip.com /
Nasir Jamal work@HouseTrip
@_nasj
profiling helps you to narrow down to
where optimization would be most useful
benchmarking allows you to easily isolate
optimizations and cross-compare them
Benchmarking
Realtime
puts Benchmark.realtime { 4000.times { |x| x**x } }
#=> 0.905972957611084
1. User CPU time
2. System CPU time
3. (1 + 2) i.e. User + System CPU time
4. Realtime
puts Benchmark.measure { 4000.times { |x| x**x } }
# => 0.890000 0.020000 0.910000 (0.909118)
Benchmark.bm do |bm|
bm.report { first_algorithm }
bm.report { second_algorithm}
…..
end
#=> user system total real
0.940000 0.010000 0.950000 ( 0.956572)
0.430000 0.010000 0.440000 ( 0.423467)
Benchmark.bm(14) do |bm|
bm.report(“first header”) { first_algorithm }
bm.report(“second header”) { second_algorithm}
…..
end
#=> user system total real
first header 0.940000 0.010000 0.950000 (0.956572)
second header 0.430000 0.010000 0.440000 (0.423467)
examples ...
Benchmark.bmbm(20) do |bm|
bm.report('append') do
str1, str2, str3, str4 = 'string1', 'string2', 'string3', 'string4'
1_000_000.times { y = str1 << str2 << str3 << str4 }
end
bm.report('concat') do
str1, str2, str3, str4 = 'string1', 'string2', 'string3', 'string4'
1_000_000.times { y = str1 + str2 + str3 + str4 }
end
bm.report('interpolate') do
str1, str2, str3, str4 = 'string1', 'string2', 'string3', 'string4'
1_000_000.times { y = "#{str1}#{str2}#{str3}#{str4}" }
end
bm.report('interpolate one') do
str1, str2, str3, str4 = 'string1', 'string2', 'string3', 'string4'
1_000_000.times { y = "string1string2string3#{str4}" }
end
end
.bmbm prevents result skewing
bmbm does rehearsal which includes any initialisation and GC run
then it does the real benchmark
#=> Rehearsal ---------------------------------------------
append 0.280000 0.000000 0.280000 ( 0.294505)
concat 0.470000 0.020000 0.490000 ( 0.481748)
interpolate 0.430000 0.010000 0.440000 ( 0.433404)
interpolate one 0.320000 0.000000 0.320000 ( 0.323479)
--------------------------------------- total: 1.530000sec
| Tests | user | system | total | real |
|:---------------|:--------:|:--------:|:---------:|-----------:|
|append | 0.260000 | 0.010000 | 0.270000 | (0.265732) |
|concat | 0.400000 | 0.010000 | 0.410000 | (0.396115) |
|interpolate | 0.400000 | 0.000000 | 0.400000 | (0.408096) |
|interpolate one | 0.280000 | 0.010000 | 0.290000 | (0.286443) |
Benchmark.bmbm(20) do |bm|
bm.report('gsub') do
1_0_000.times { Date.today.to_s.gsub!('-','') }
end
bm.report('strftime') do
1_0_000.times { Date.today.strftime("%Y%m%d") }
end
end
#=> Rehearsal -------------------------------------------
gsub 0.750000 0.000000 0.750000 ( 0.751547)
strftime 1.320000 0.000000 1.320000 ( 1.320621)
------------------------------------ total: 2.070000sec
| | user | system | total | real |
|:--------|:--------:|:---------:|:--------:|:-----------|
|gsub | 0.710000 | 0.000000 | 0.710000 | (0.709918) |
|strftime | 1.320000 | 0.000000 | 1.320000 | (1.315345) |
module Extendable
def name
@name
end
end
class Person
attr_accessor :name
end
require 'ostruct'
Benchmark.bmbm(20) do |bm|
bm.report('Class') do
1_00_000.times { p = Person.new; p.name='Joe'; p.name }
end
bm.report('Extends') do
1_00_000.times { p = Person1.new; p.extend Extendable; p.name='Joe'; p.name }
end
bm.report('Struct') do
1_00_000.times { person2 = Struct.new(:name); p = person2.new('Joe'); p.name }
end
bm.report('OpenStruct') do
1_00_000.times { p = OpenStruct.new(:name => 'Joe'); p.name }
end
end
#=> Rehearsal ---------------------------------------------
Class 0.080000 0.000000 0.080000 (0.086261)
Extends 0.410000 0.000000 0.410000 (0.407723)
Struct 1.490000 0.000000 1.490000 (1.490557)
OpenStruct 1.980000 0.010000 1.990000 (1.990507)
------------------------------------ total: 3.970000sec
| | user | system | total | real |
|:----------|:--------:|:--------:|:---------:|:-----------|
|Class | 0.080000 | 0.000000 | 0.080000 | (0.082448) |
|Extends | 0.400000 | 0.000000 | 0.400000 | (0.410884) |
|Struct | 1.480000 | 0.000000 | 1.480000 | (1.490531) |
|OpenStruct | 1.960000 | 0.010000 | 1.970000 | (1.965923) |
Profiling
perftools.rb
an adaptation of Google's perftools library to the Ruby land by Aman
Gupta
https://github.com/tmm1/perftools.rb
$gem install perftools.rb
does profiling via sampling method, where by default it takes
100 samples a second
examples ...
to see results
Interpreting the above columns:
1. Number of profiling samples in this function
2. Percentage of profiling samples in this function
3. Percentage of profiling samples in the functions printed so far
4. Number of profiling samples in this function and its callees
5. Percentage of profiling samples in this function and its callees
6. Function name
a = ''
PerfTools::CpuProfiler.start("/tmp/profiling/string_concat") do
100_000.times {|x| a += x.to_s}
end
$pprof.rb --text --ignore=Gem /tmp/profiling/string_concat
Total: 2939 samples
1497 50.9% 50.9% 1501 51.1% Object#irb_binding
1438 48.9% 99.9% 1438 48.9% garbage_collector
4 0.1% 100.0% 1500 51.0% Integer#times
to see results as graph
bigger the box, the more time spent there
1. Class Name
2. Method Name
3. local (percentage)
4. of cumulative (percentage)
brew install graphviz
$pprof.rb --gif --ignore=Gem /tmp/profiling/string_concat > /tmp/profiling/string_concat.gif
slightly hairy method
And on on ....
PerfTools::CpuProfiler.start("/tmp/profiling/property_search") do
100.times { PropertySearch.new.search }
end
$pprof.rb --text --ignore=Gem /tmp/profiling/property_search
Total: 6799 samples
2598 38.2% 38.2% 2598 38.2% garbage_collector
1761 25.9% 64.1% 3966 58.3% PropertySearch#set_price_filter_counts
390 5.7% 69.8% 1632 24.0% Object#detect
389 5.7% 75.6% 503 7.4% PropertySearch::PriceRange#contains?
358 5.3% 80.8% 358 5.3% Mysql2::Result#each
263 3.9% 84.7% 768 11.3% Object#select_values
199 2.9% 87.6% 236 3.5% ActiveRecord::ConnectionAdapters::Mysql2Adapter#execu
187 2.8% 90.4% 640 9.4% Property.collect_column
148 2.2% 92.6% 148 2.2% ActiveSupport::BufferedLogger#flush
114 1.7% 94.2% 114 1.7% Fixnum#<=
75 1.1% 95.3% 75 1.1% Array#join
67 1.0% 96.3% 76 1.1% Array#map
47 0.7% 97.0% 47 0.7% ActiveRecord::ConnectionAdapters::Column#type_cast
44 0.6% 97.7% 295 4.3% Array#collect
32 0.5% 98.1% 388 5.7% Object#to_a
28 0.4% 98.5% 28 0.4% PropertySearch#day_count
15 0.2% 98.8% 140 2.1% ActiveRecord::ConnectionAdapters::Mysql2Adapter#selec
9 0.1% 98.9% 4199 61.8% PropertySearch#search
$pprof.rb --help
Qcachegrind
How to setup?
http://langui.sh/2011/06/16/how-to-install-qcachegrind-
kcachegrind-on-mac-osx-snow-leopard/
$pprof.rb --callgrind /tmp/profiling/property_search > /tmp/profiling/property_search.callgr
graph
To use with Rails
Valid default_printer values are pdf, text, raw, gif, callgrind
# Gemfile
gem 'rack-perftools_profiler', :require => false
# config/environment.rb
config.middleware.use ::Rack::PerftoolsProfiler,
:default_printer => 'gif',
:bundler => true,
:mode => :cputime,
:frequency => 250
profile=true will enable profiling
times=10 will hit the page for 10 times
will store the results in profile_ppp_page.txt
RACK_PROFILER=true script/server
curl -o profile_ppp_page.txt 
"http://localhost:3000/en/rentals/107605?profile=true&times=10"
ruby-prof
OR
$gem install ruby-prof
#Gemfile
gem 'ruby-prof', :require => false
types of measures
RubyProf.measure_mode = RubyProf::PROCESS_TIME
RubyProf.measure_mode = RubyProf::WALL_TIME
RubyProf.measure_mode = RubyProf::CPU_TIME
RubyProf.measure_mode = RubyProf::ALLOCATIONS
RubyProf.measure_mode = RubyProf::MEMORY
RubyProf.measure_mode = RubyProf::GC_RUNS
RubyProf.measure_mode = RubyProf::GC_TIME
types of printers
RubyProf::FlatPrinter
RubyProf::FlatPrinterWithLineNumbers
RubyProf::GraphPrinter
RubyProf::GraphHtmlPrinter
RubyProf::CallTreePrinter
RubyProf::CallStackPrinter
RubyProf::MultiPrinter
examples ...
GraphHtmlPrinter
result = RubyProf.profile { PropertySearch.new.search }
printer = RubyProf::GraphHtmlPrinter.new(result)
File.open("tmp/profile_data.html", 'w') { |file| printer.print(file)}
profile_data.html
CallStackPrinter
result = RubyProf.profile { PropertySearch.new.search }
printer = RubyProf::CallStackPrinter.new(result)
File.open("tmp/profile_data.html", 'w') { |file| printer.print(file)}
profile_data.html
CallTreePrinter
result = RubyProf.profile { PropertySearch.new.search }
printer = RubyProf::CallTreePrinter.new(result)
File.open("tmp/profile_data", 'w') { |file| printer.print(file)}
profile_data (qcachegrind)
In Rails
2.x.x
3.x.x
Or just use rake tasks
script/performance/benchmarker 10 'Class.method_name' 'AnotherClass.method_name'
script/performance/profiler 'Class.method_name' 10 graph
script/performance/profiler 'Class.method_name' 10 graph_html 2> property.html && open prope
rails benchmarker 'Class.method_name'
rails profiler 'Class.method_name' --runs 3 --metrics cpu_time,memory
rake test:benchmark
rake test:profile
rake test:profile TEST=test/performance/home_page_test.rb
But from Rails 4.0
performance tests are no longer part of the default
stack
https://github.com/rails/rails-perftest
Questions?
jobs@housetrip.com
We are hiring
Thank you

Profiling ruby

  • 1.
    Profiling Ruby Where andwhat to optimize in your code / jobs@housetrip.com / Nasir Jamal work@HouseTrip @_nasj
  • 2.
    profiling helps youto narrow down to where optimization would be most useful
  • 3.
    benchmarking allows youto easily isolate optimizations and cross-compare them
  • 4.
  • 5.
    Realtime puts Benchmark.realtime {4000.times { |x| x**x } } #=> 0.905972957611084
  • 6.
    1. User CPUtime 2. System CPU time 3. (1 + 2) i.e. User + System CPU time 4. Realtime puts Benchmark.measure { 4000.times { |x| x**x } } # => 0.890000 0.020000 0.910000 (0.909118)
  • 7.
    Benchmark.bm do |bm| bm.report{ first_algorithm } bm.report { second_algorithm} ….. end #=> user system total real 0.940000 0.010000 0.950000 ( 0.956572) 0.430000 0.010000 0.440000 ( 0.423467)
  • 8.
    Benchmark.bm(14) do |bm| bm.report(“firstheader”) { first_algorithm } bm.report(“second header”) { second_algorithm} ….. end #=> user system total real first header 0.940000 0.010000 0.950000 (0.956572) second header 0.430000 0.010000 0.440000 (0.423467)
  • 9.
  • 10.
    Benchmark.bmbm(20) do |bm| bm.report('append')do str1, str2, str3, str4 = 'string1', 'string2', 'string3', 'string4' 1_000_000.times { y = str1 << str2 << str3 << str4 } end bm.report('concat') do str1, str2, str3, str4 = 'string1', 'string2', 'string3', 'string4' 1_000_000.times { y = str1 + str2 + str3 + str4 } end bm.report('interpolate') do str1, str2, str3, str4 = 'string1', 'string2', 'string3', 'string4' 1_000_000.times { y = "#{str1}#{str2}#{str3}#{str4}" } end bm.report('interpolate one') do str1, str2, str3, str4 = 'string1', 'string2', 'string3', 'string4' 1_000_000.times { y = "string1string2string3#{str4}" } end end .bmbm prevents result skewing
  • 11.
    bmbm does rehearsalwhich includes any initialisation and GC run then it does the real benchmark #=> Rehearsal --------------------------------------------- append 0.280000 0.000000 0.280000 ( 0.294505) concat 0.470000 0.020000 0.490000 ( 0.481748) interpolate 0.430000 0.010000 0.440000 ( 0.433404) interpolate one 0.320000 0.000000 0.320000 ( 0.323479) --------------------------------------- total: 1.530000sec | Tests | user | system | total | real | |:---------------|:--------:|:--------:|:---------:|-----------:| |append | 0.260000 | 0.010000 | 0.270000 | (0.265732) | |concat | 0.400000 | 0.010000 | 0.410000 | (0.396115) | |interpolate | 0.400000 | 0.000000 | 0.400000 | (0.408096) | |interpolate one | 0.280000 | 0.010000 | 0.290000 | (0.286443) |
  • 12.
    Benchmark.bmbm(20) do |bm| bm.report('gsub')do 1_0_000.times { Date.today.to_s.gsub!('-','') } end bm.report('strftime') do 1_0_000.times { Date.today.strftime("%Y%m%d") } end end #=> Rehearsal ------------------------------------------- gsub 0.750000 0.000000 0.750000 ( 0.751547) strftime 1.320000 0.000000 1.320000 ( 1.320621) ------------------------------------ total: 2.070000sec | | user | system | total | real | |:--------|:--------:|:---------:|:--------:|:-----------| |gsub | 0.710000 | 0.000000 | 0.710000 | (0.709918) | |strftime | 1.320000 | 0.000000 | 1.320000 | (1.315345) |
  • 13.
    module Extendable def name @name end end classPerson attr_accessor :name end require 'ostruct' Benchmark.bmbm(20) do |bm| bm.report('Class') do 1_00_000.times { p = Person.new; p.name='Joe'; p.name } end bm.report('Extends') do 1_00_000.times { p = Person1.new; p.extend Extendable; p.name='Joe'; p.name } end bm.report('Struct') do 1_00_000.times { person2 = Struct.new(:name); p = person2.new('Joe'); p.name } end bm.report('OpenStruct') do 1_00_000.times { p = OpenStruct.new(:name => 'Joe'); p.name } end end
  • 14.
    #=> Rehearsal --------------------------------------------- Class0.080000 0.000000 0.080000 (0.086261) Extends 0.410000 0.000000 0.410000 (0.407723) Struct 1.490000 0.000000 1.490000 (1.490557) OpenStruct 1.980000 0.010000 1.990000 (1.990507) ------------------------------------ total: 3.970000sec | | user | system | total | real | |:----------|:--------:|:--------:|:---------:|:-----------| |Class | 0.080000 | 0.000000 | 0.080000 | (0.082448) | |Extends | 0.400000 | 0.000000 | 0.400000 | (0.410884) | |Struct | 1.480000 | 0.000000 | 1.480000 | (1.490531) | |OpenStruct | 1.960000 | 0.010000 | 1.970000 | (1.965923) |
  • 15.
  • 16.
    perftools.rb an adaptation ofGoogle's perftools library to the Ruby land by Aman Gupta https://github.com/tmm1/perftools.rb $gem install perftools.rb
  • 17.
    does profiling viasampling method, where by default it takes 100 samples a second
  • 18.
  • 19.
    to see results Interpretingthe above columns: 1. Number of profiling samples in this function 2. Percentage of profiling samples in this function 3. Percentage of profiling samples in the functions printed so far 4. Number of profiling samples in this function and its callees 5. Percentage of profiling samples in this function and its callees 6. Function name a = '' PerfTools::CpuProfiler.start("/tmp/profiling/string_concat") do 100_000.times {|x| a += x.to_s} end $pprof.rb --text --ignore=Gem /tmp/profiling/string_concat Total: 2939 samples 1497 50.9% 50.9% 1501 51.1% Object#irb_binding 1438 48.9% 99.9% 1438 48.9% garbage_collector 4 0.1% 100.0% 1500 51.0% Integer#times
  • 20.
    to see resultsas graph bigger the box, the more time spent there 1. Class Name 2. Method Name 3. local (percentage) 4. of cumulative (percentage) brew install graphviz $pprof.rb --gif --ignore=Gem /tmp/profiling/string_concat > /tmp/profiling/string_concat.gif
  • 21.
    slightly hairy method Andon on .... PerfTools::CpuProfiler.start("/tmp/profiling/property_search") do 100.times { PropertySearch.new.search } end $pprof.rb --text --ignore=Gem /tmp/profiling/property_search Total: 6799 samples 2598 38.2% 38.2% 2598 38.2% garbage_collector 1761 25.9% 64.1% 3966 58.3% PropertySearch#set_price_filter_counts 390 5.7% 69.8% 1632 24.0% Object#detect 389 5.7% 75.6% 503 7.4% PropertySearch::PriceRange#contains? 358 5.3% 80.8% 358 5.3% Mysql2::Result#each 263 3.9% 84.7% 768 11.3% Object#select_values 199 2.9% 87.6% 236 3.5% ActiveRecord::ConnectionAdapters::Mysql2Adapter#execu 187 2.8% 90.4% 640 9.4% Property.collect_column 148 2.2% 92.6% 148 2.2% ActiveSupport::BufferedLogger#flush 114 1.7% 94.2% 114 1.7% Fixnum#<= 75 1.1% 95.3% 75 1.1% Array#join 67 1.0% 96.3% 76 1.1% Array#map 47 0.7% 97.0% 47 0.7% ActiveRecord::ConnectionAdapters::Column#type_cast 44 0.6% 97.7% 295 4.3% Array#collect 32 0.5% 98.1% 388 5.7% Object#to_a 28 0.4% 98.5% 28 0.4% PropertySearch#day_count 15 0.2% 98.8% 140 2.1% ActiveRecord::ConnectionAdapters::Mysql2Adapter#selec 9 0.1% 98.9% 4199 61.8% PropertySearch#search
  • 23.
  • 24.
  • 25.
    $pprof.rb --callgrind /tmp/profiling/property_search> /tmp/profiling/property_search.callgr
  • 26.
  • 27.
    To use withRails Valid default_printer values are pdf, text, raw, gif, callgrind # Gemfile gem 'rack-perftools_profiler', :require => false # config/environment.rb config.middleware.use ::Rack::PerftoolsProfiler, :default_printer => 'gif', :bundler => true, :mode => :cputime, :frequency => 250
  • 28.
    profile=true will enableprofiling times=10 will hit the page for 10 times will store the results in profile_ppp_page.txt RACK_PROFILER=true script/server curl -o profile_ppp_page.txt "http://localhost:3000/en/rentals/107605?profile=true&times=10"
  • 30.
  • 31.
    types of measures RubyProf.measure_mode= RubyProf::PROCESS_TIME RubyProf.measure_mode = RubyProf::WALL_TIME RubyProf.measure_mode = RubyProf::CPU_TIME RubyProf.measure_mode = RubyProf::ALLOCATIONS RubyProf.measure_mode = RubyProf::MEMORY RubyProf.measure_mode = RubyProf::GC_RUNS RubyProf.measure_mode = RubyProf::GC_TIME
  • 32.
  • 33.
  • 34.
    GraphHtmlPrinter result = RubyProf.profile{ PropertySearch.new.search } printer = RubyProf::GraphHtmlPrinter.new(result) File.open("tmp/profile_data.html", 'w') { |file| printer.print(file)}
  • 35.
  • 36.
    CallStackPrinter result = RubyProf.profile{ PropertySearch.new.search } printer = RubyProf::CallStackPrinter.new(result) File.open("tmp/profile_data.html", 'w') { |file| printer.print(file)}
  • 37.
  • 38.
    CallTreePrinter result = RubyProf.profile{ PropertySearch.new.search } printer = RubyProf::CallTreePrinter.new(result) File.open("tmp/profile_data", 'w') { |file| printer.print(file)}
  • 39.
  • 40.
    In Rails 2.x.x 3.x.x Or justuse rake tasks script/performance/benchmarker 10 'Class.method_name' 'AnotherClass.method_name' script/performance/profiler 'Class.method_name' 10 graph script/performance/profiler 'Class.method_name' 10 graph_html 2> property.html && open prope rails benchmarker 'Class.method_name' rails profiler 'Class.method_name' --runs 3 --metrics cpu_time,memory rake test:benchmark rake test:profile rake test:profile TEST=test/performance/home_page_test.rb
  • 41.
    But from Rails4.0 performance tests are no longer part of the default stack https://github.com/rails/rails-perftest
  • 42.
  • 43.
  • 44.