Download to read offline


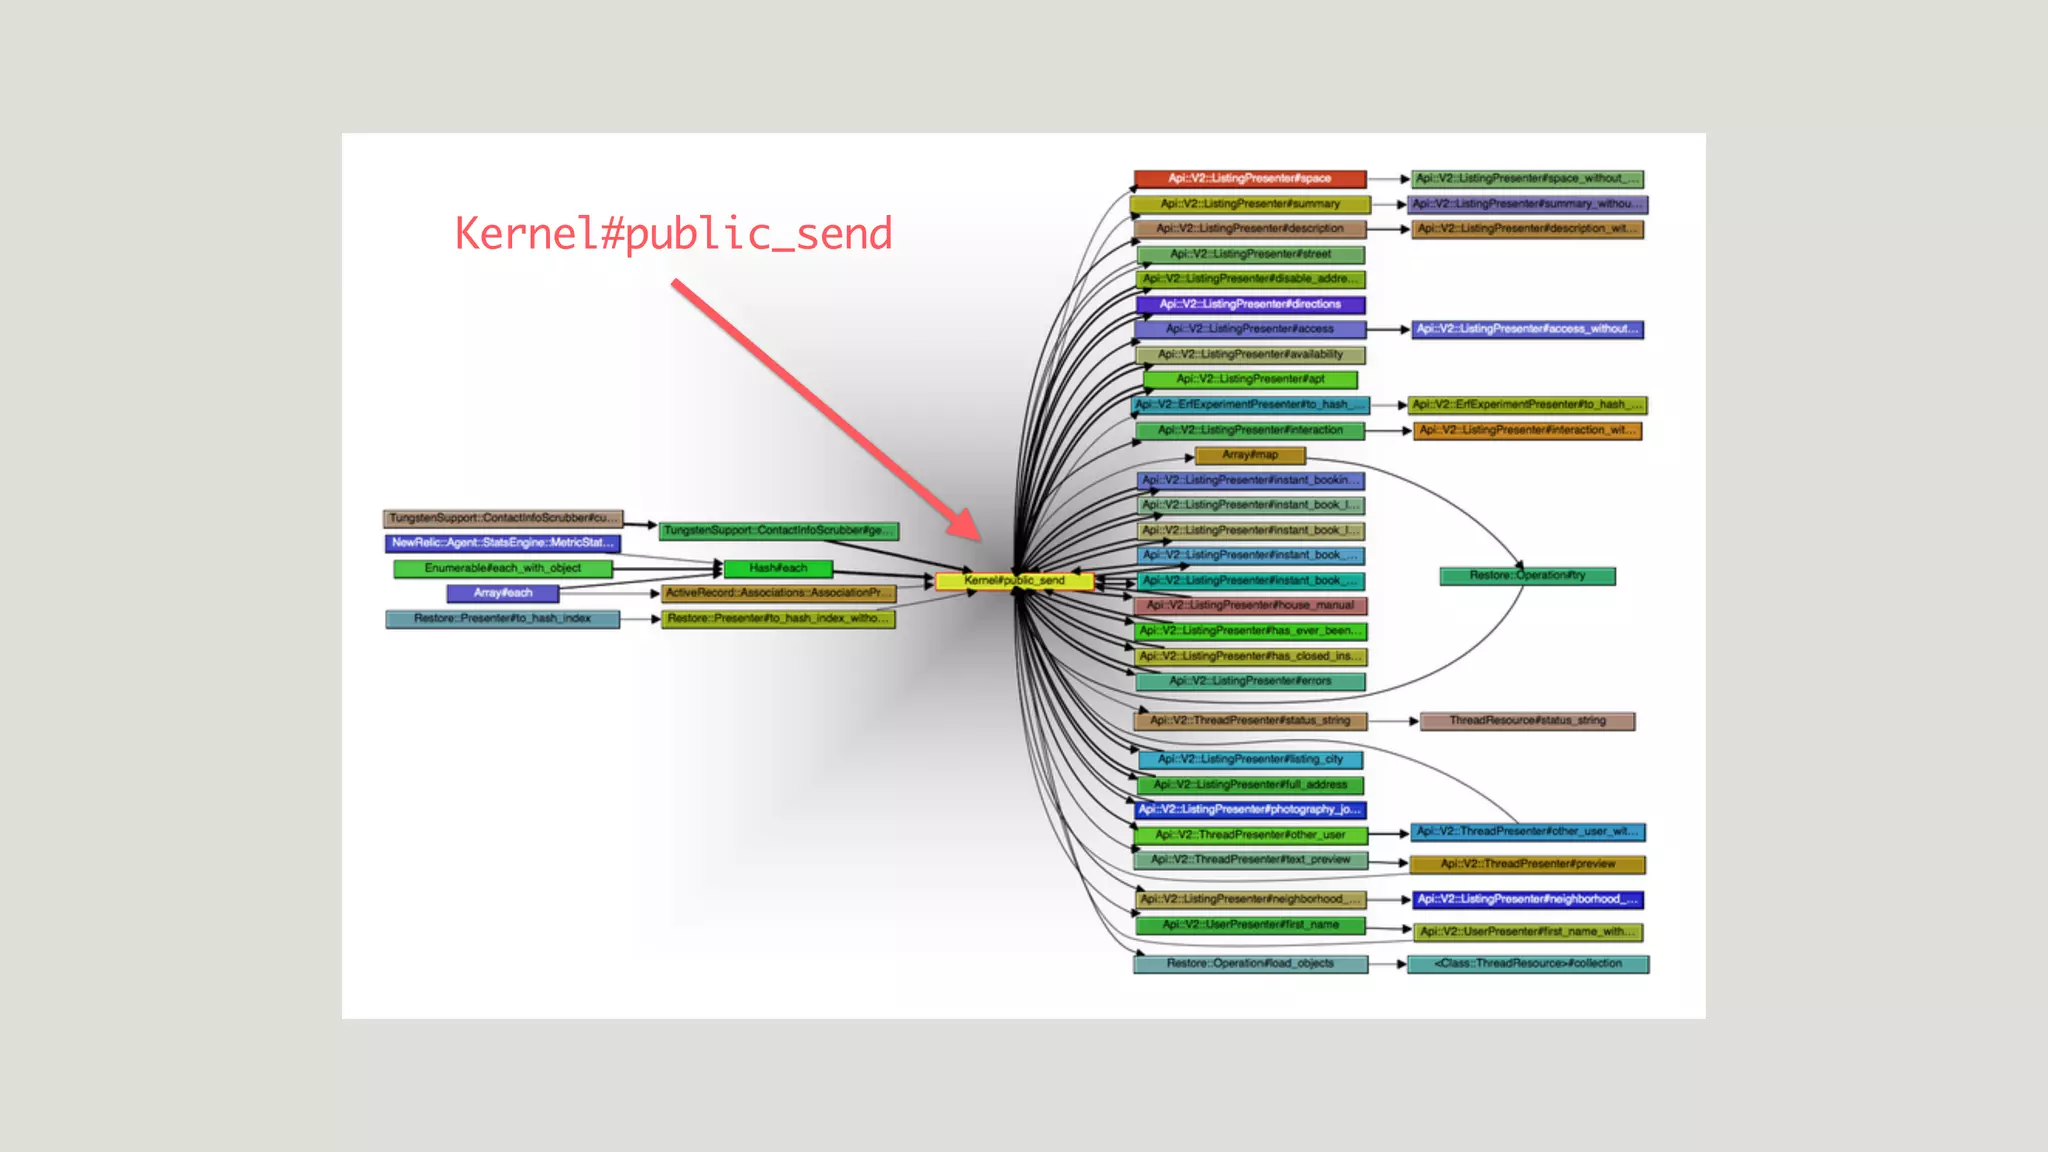
![read_authorization [:airbnb, :public], [
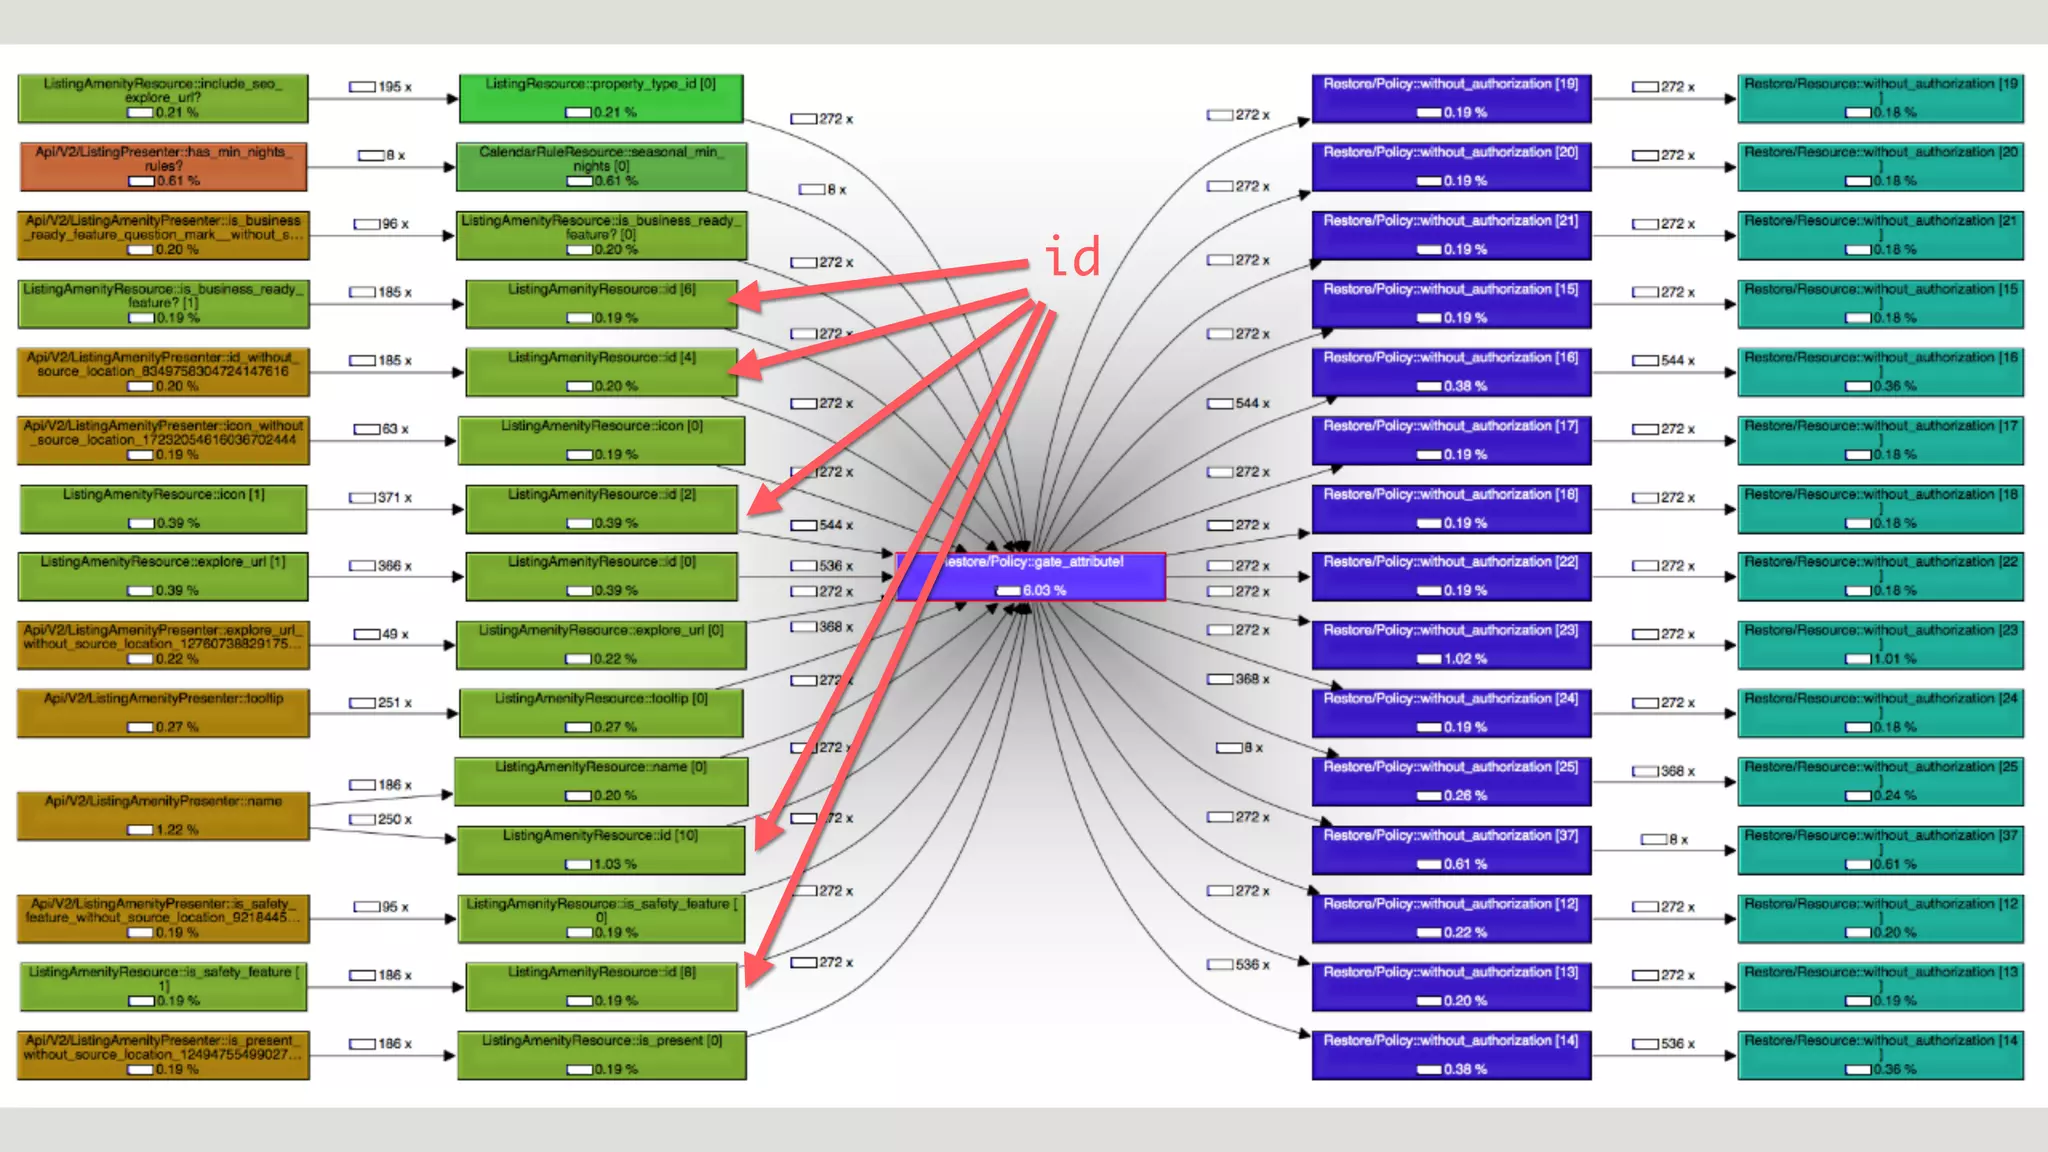
:icon,
:id,
:is_safety_feature,
:explore_url,
:name,
:tooltip,
:is_present,
:listing_id,
], lambda { can_view? }](https://image.slidesharecdn.com/scalingrailswithruby-prof-rubyconfkenya2017atbybenhughes1-170729072305/75/Scaling-Rails-with-Ruby-prof-Ruby-Conf-Kenya-2017-by-Ben-Hughes-30-2048.jpg)


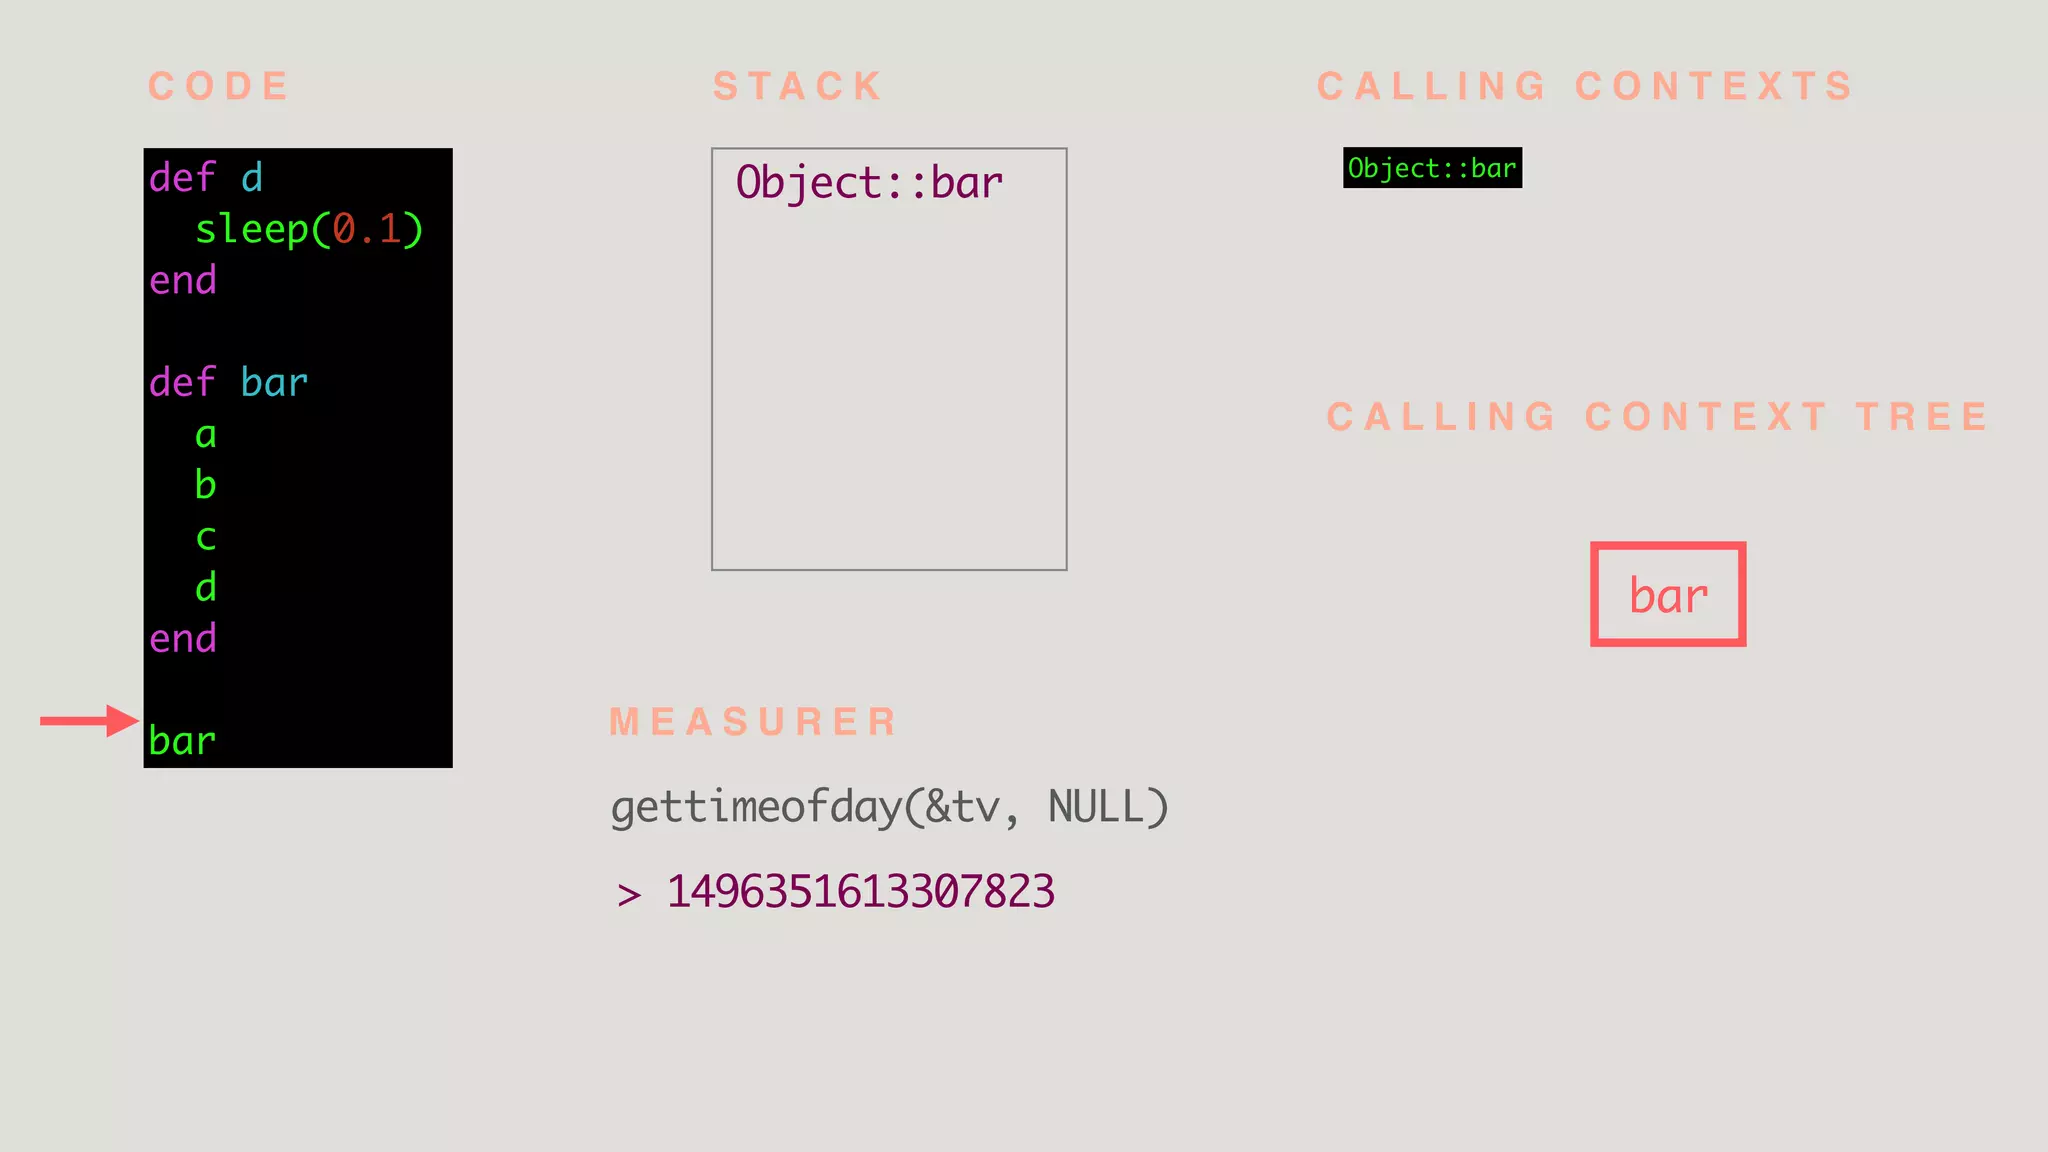
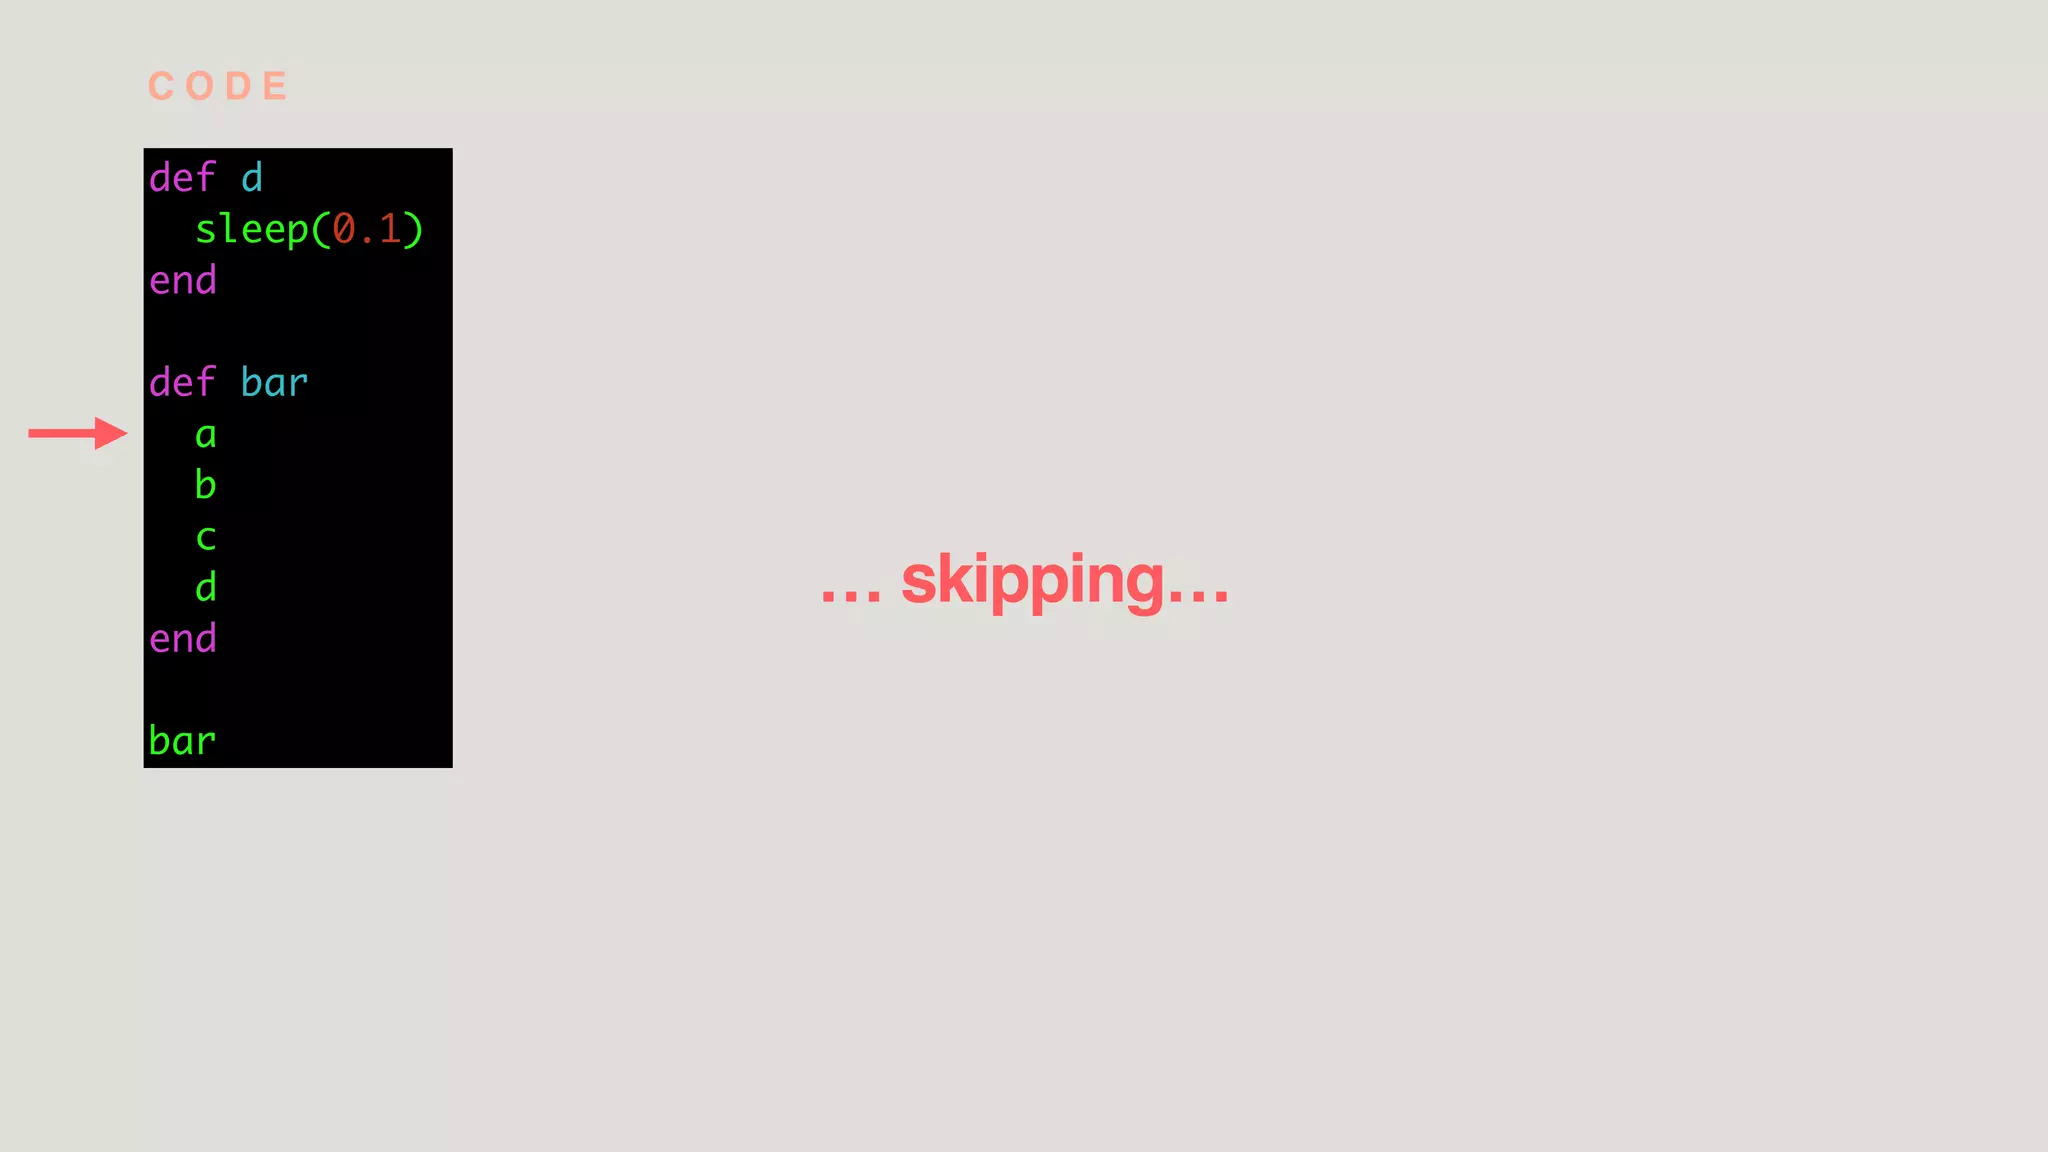
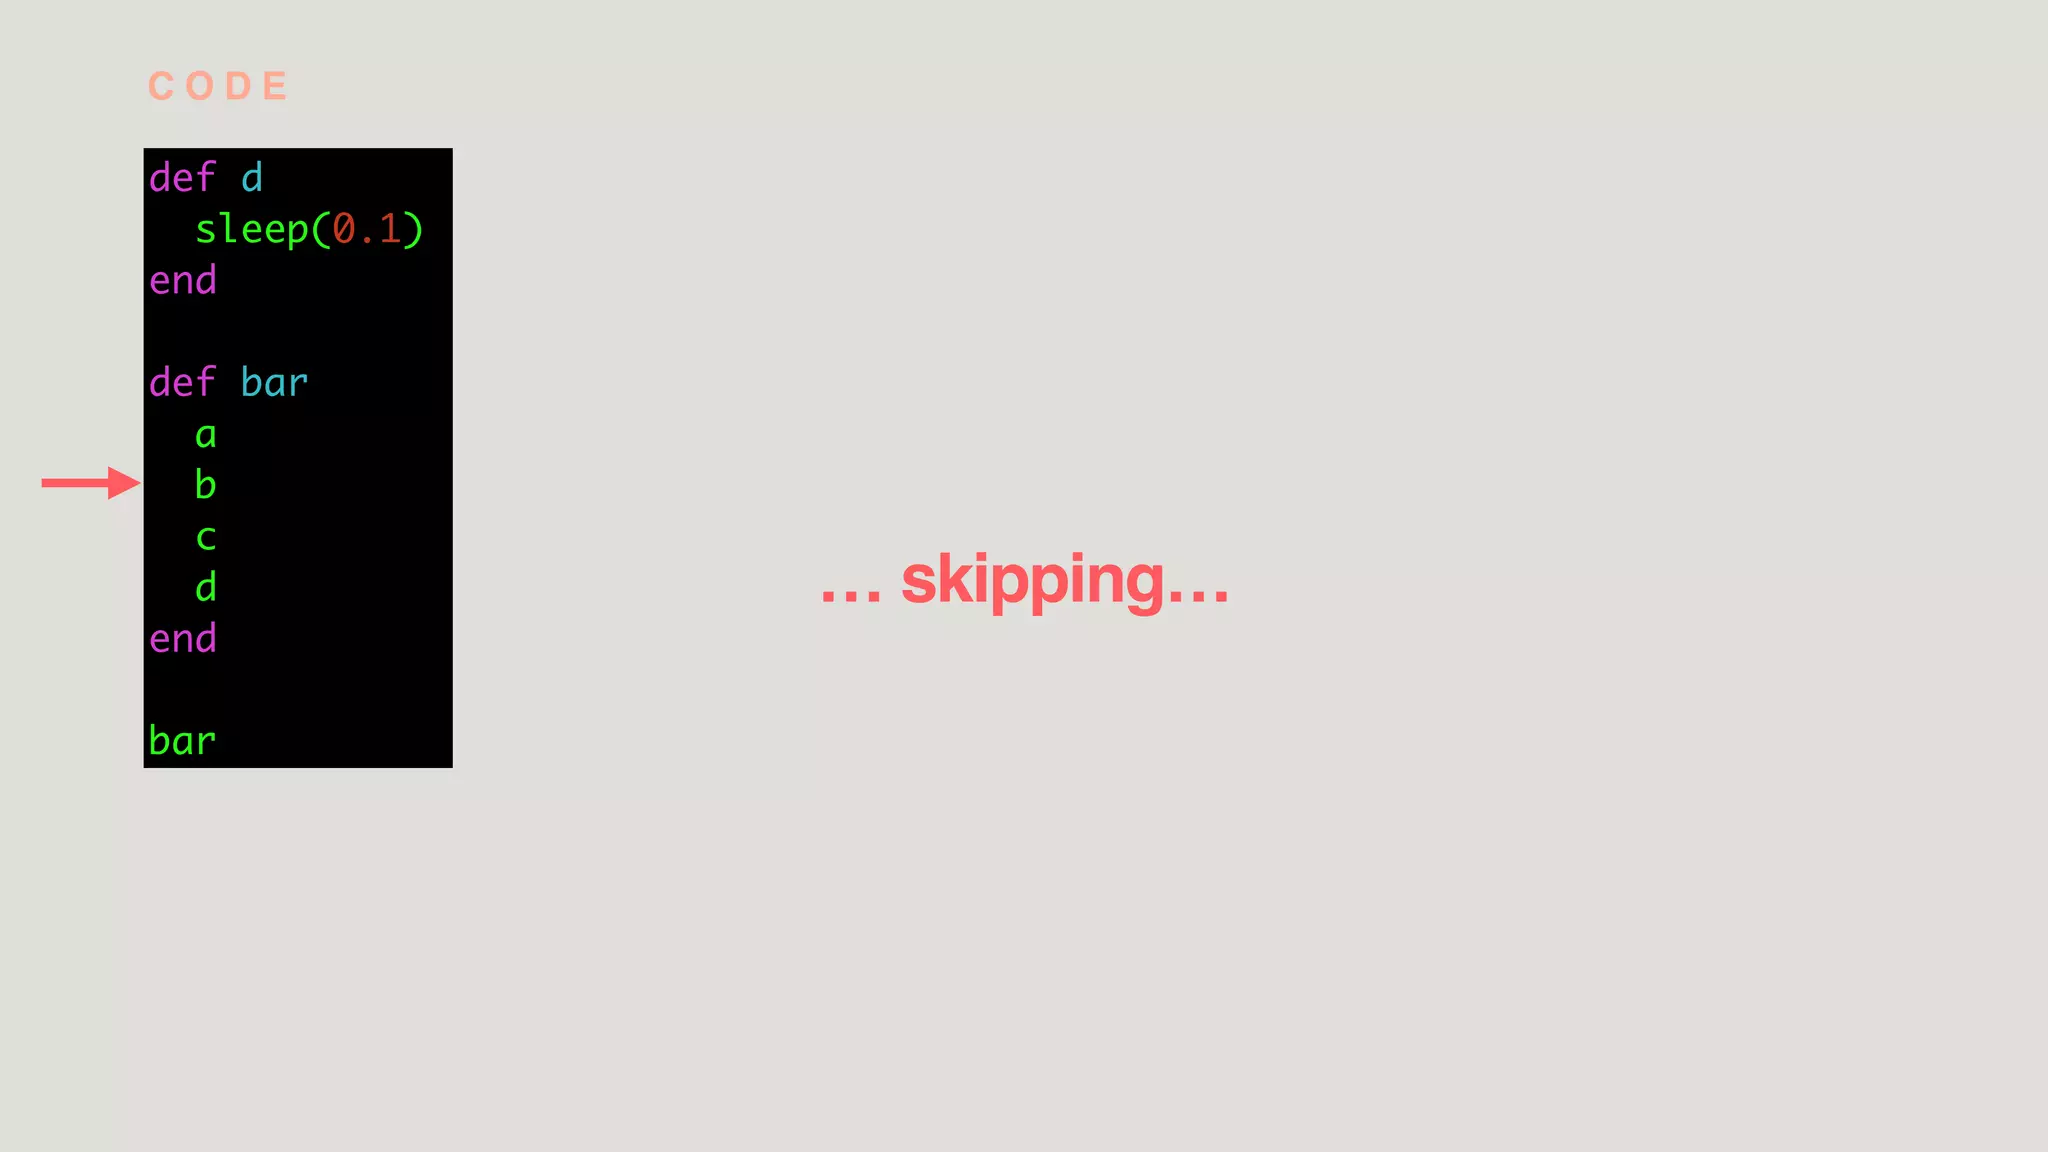
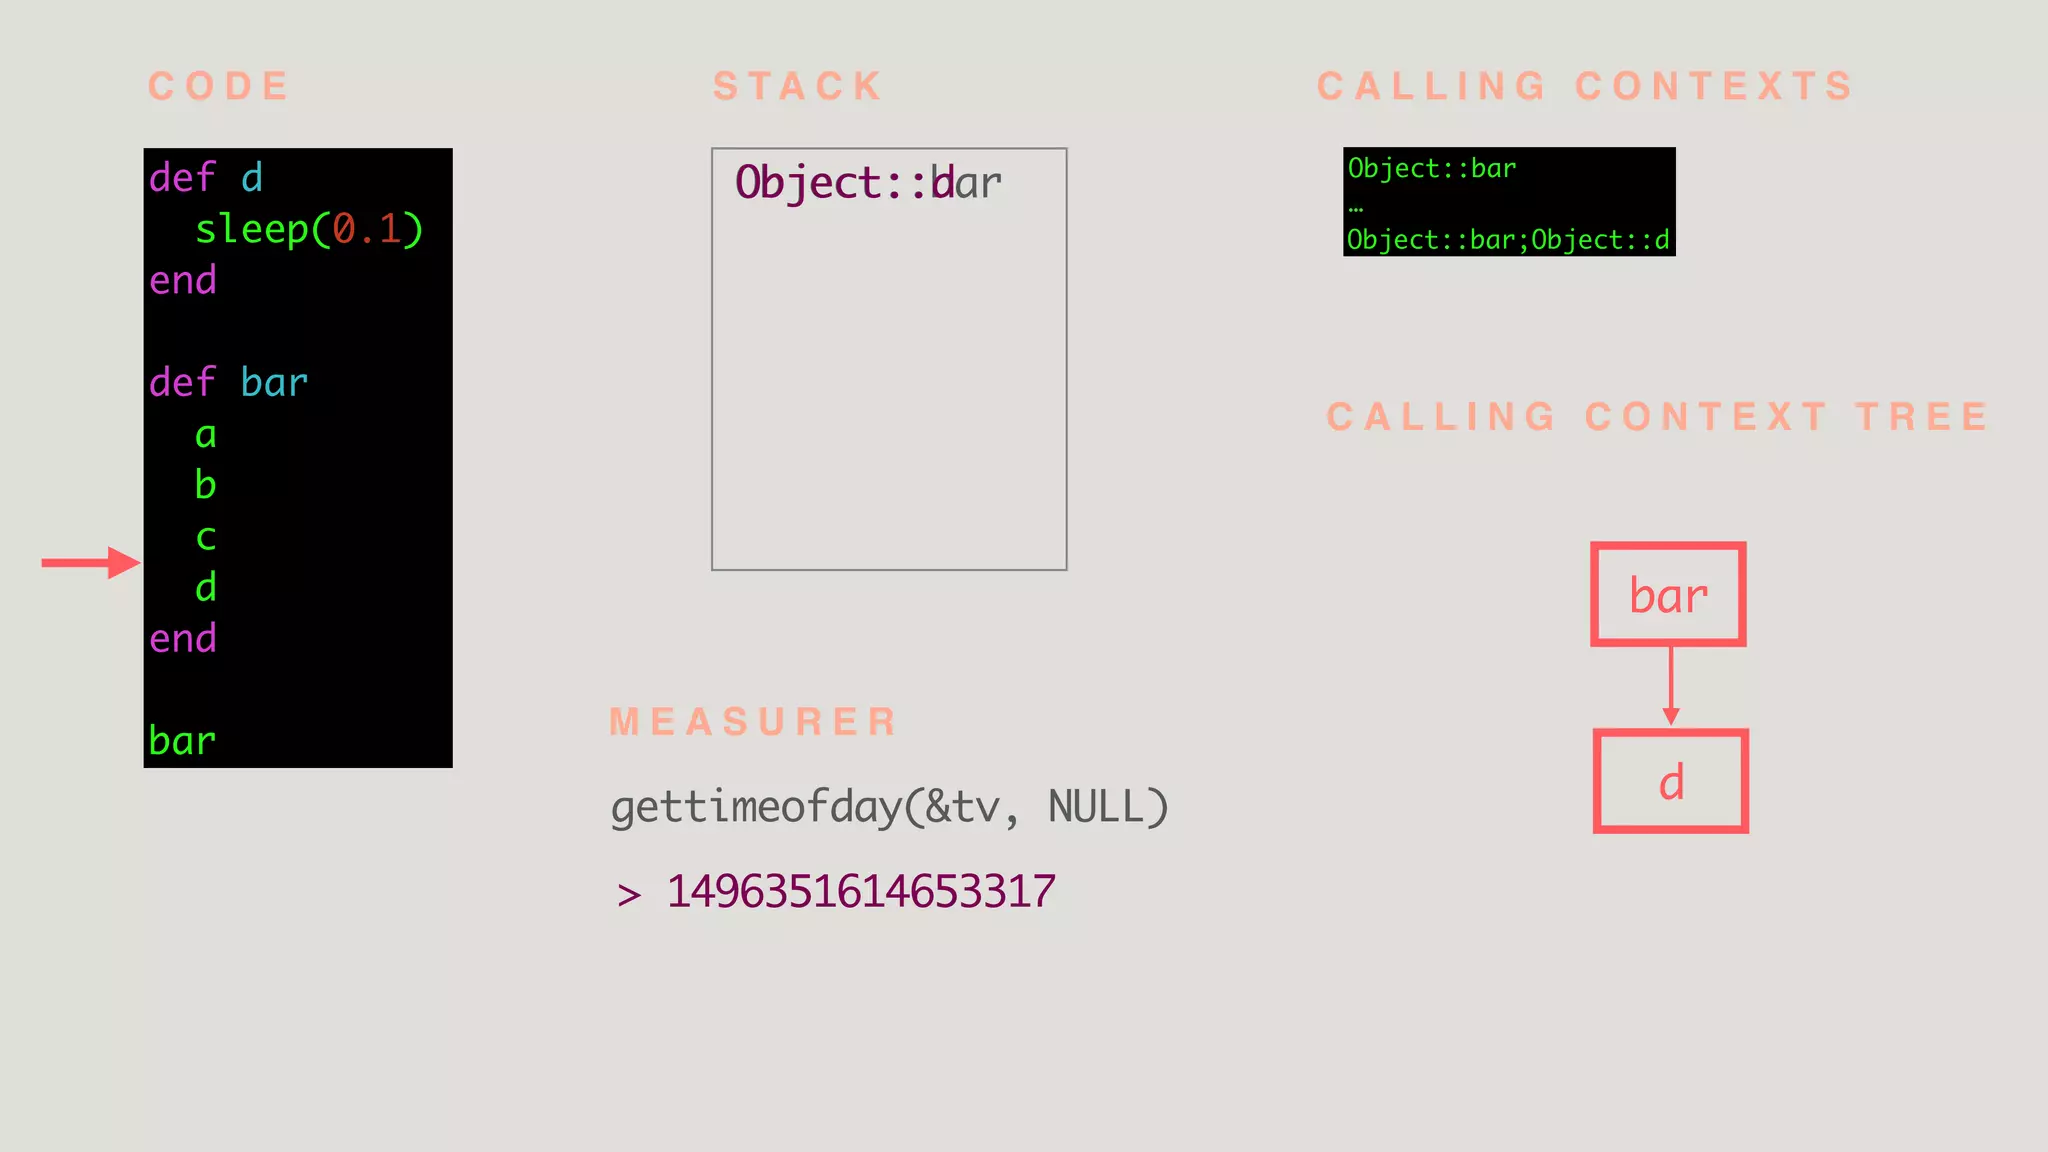
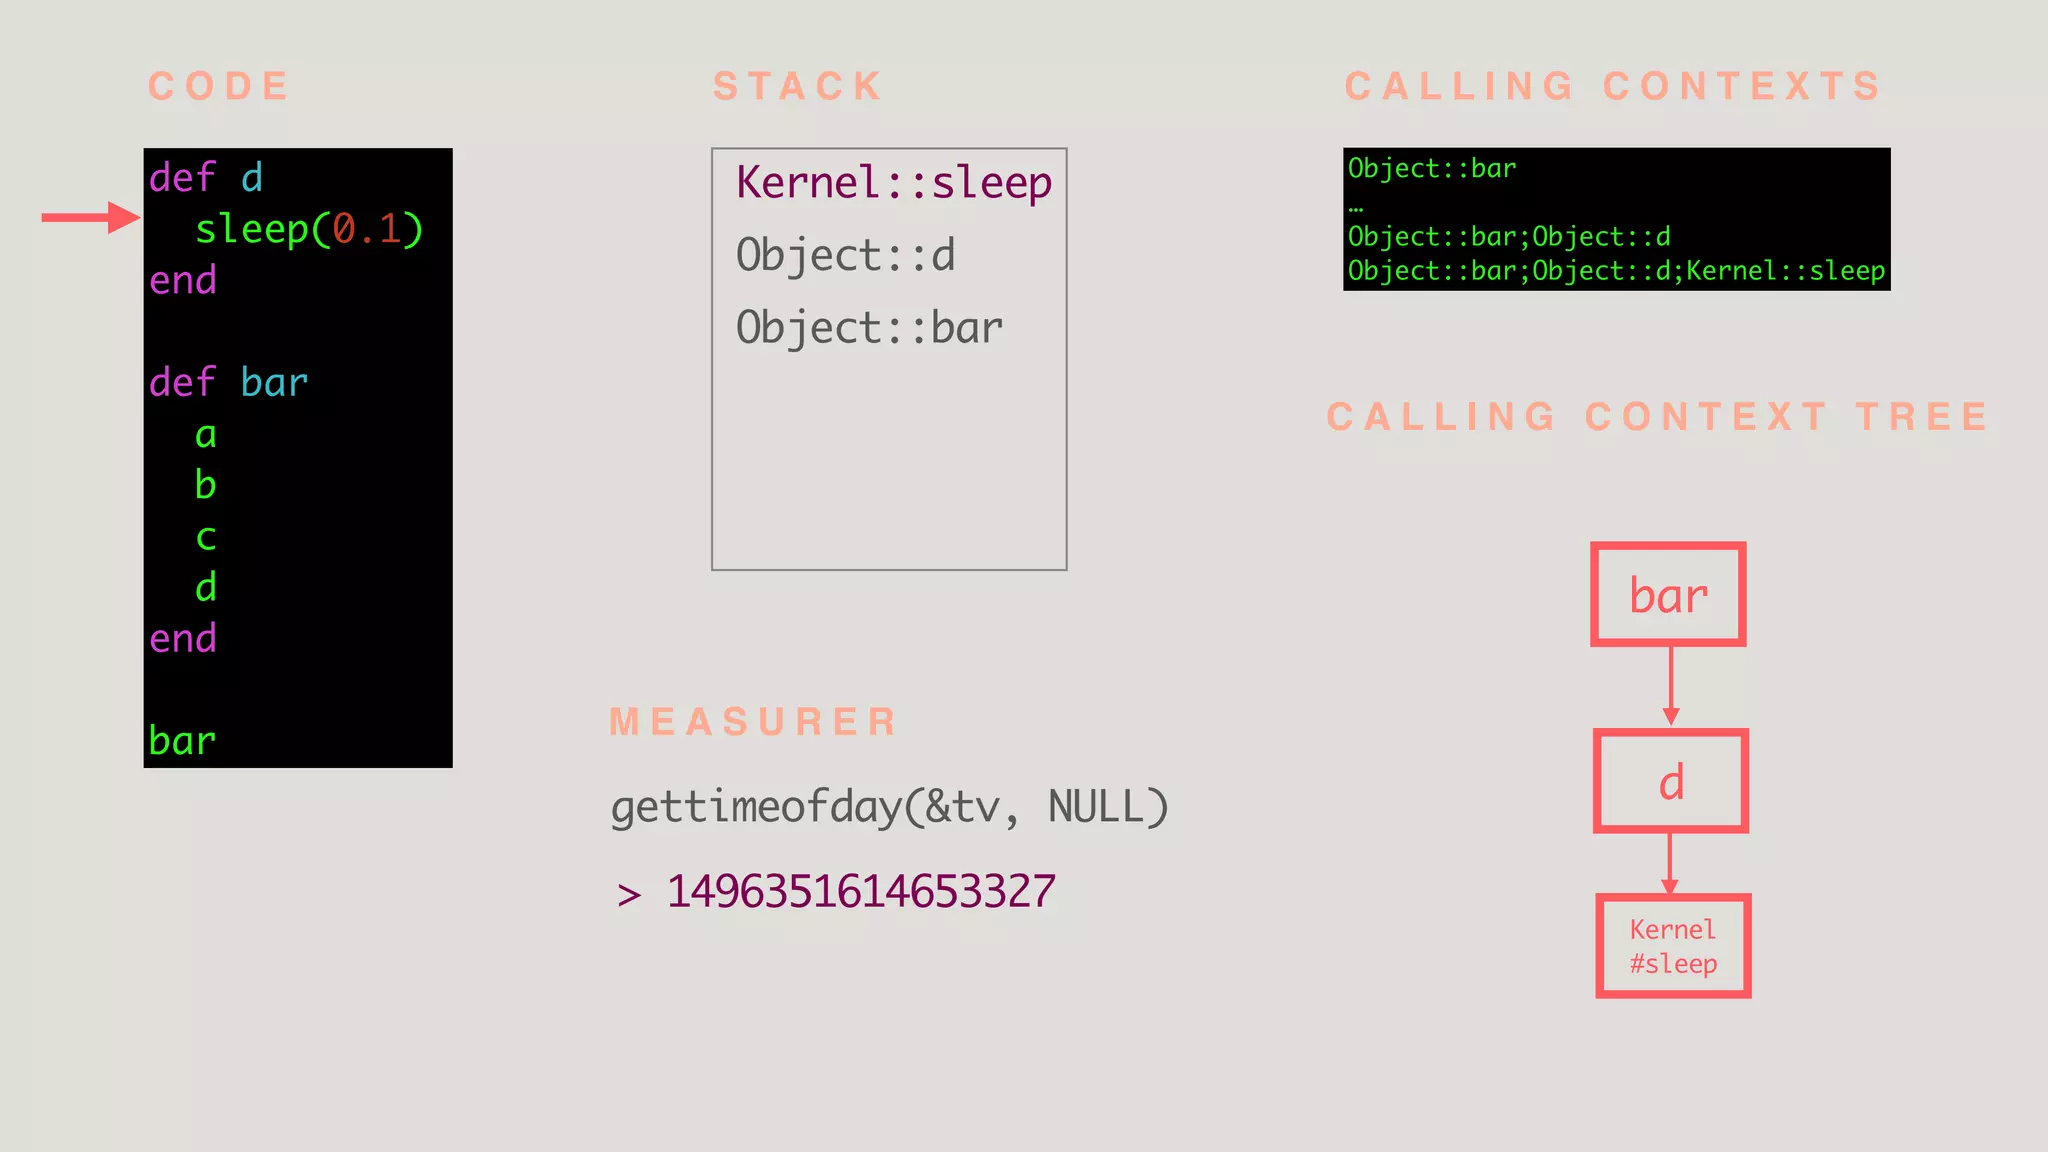
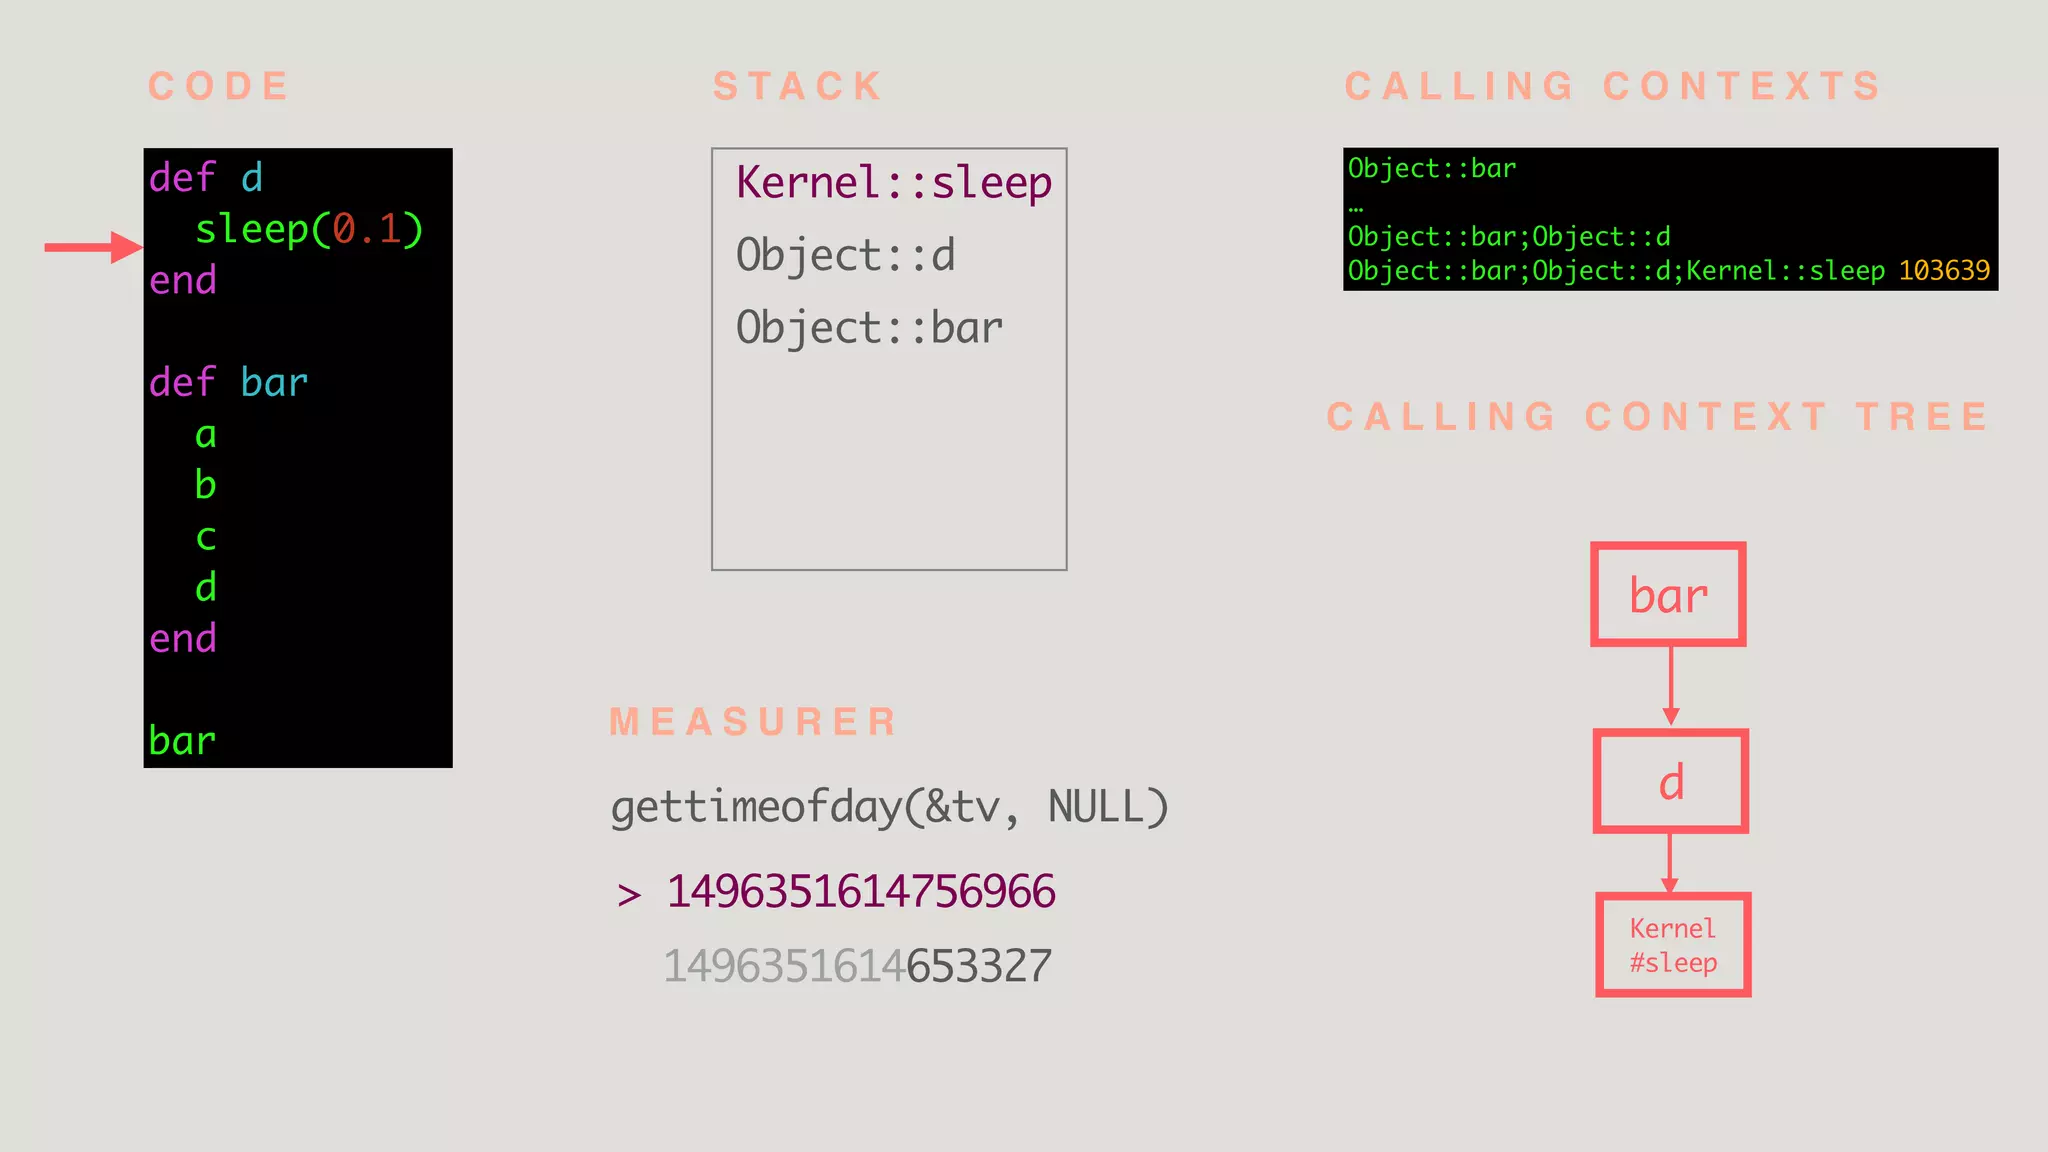
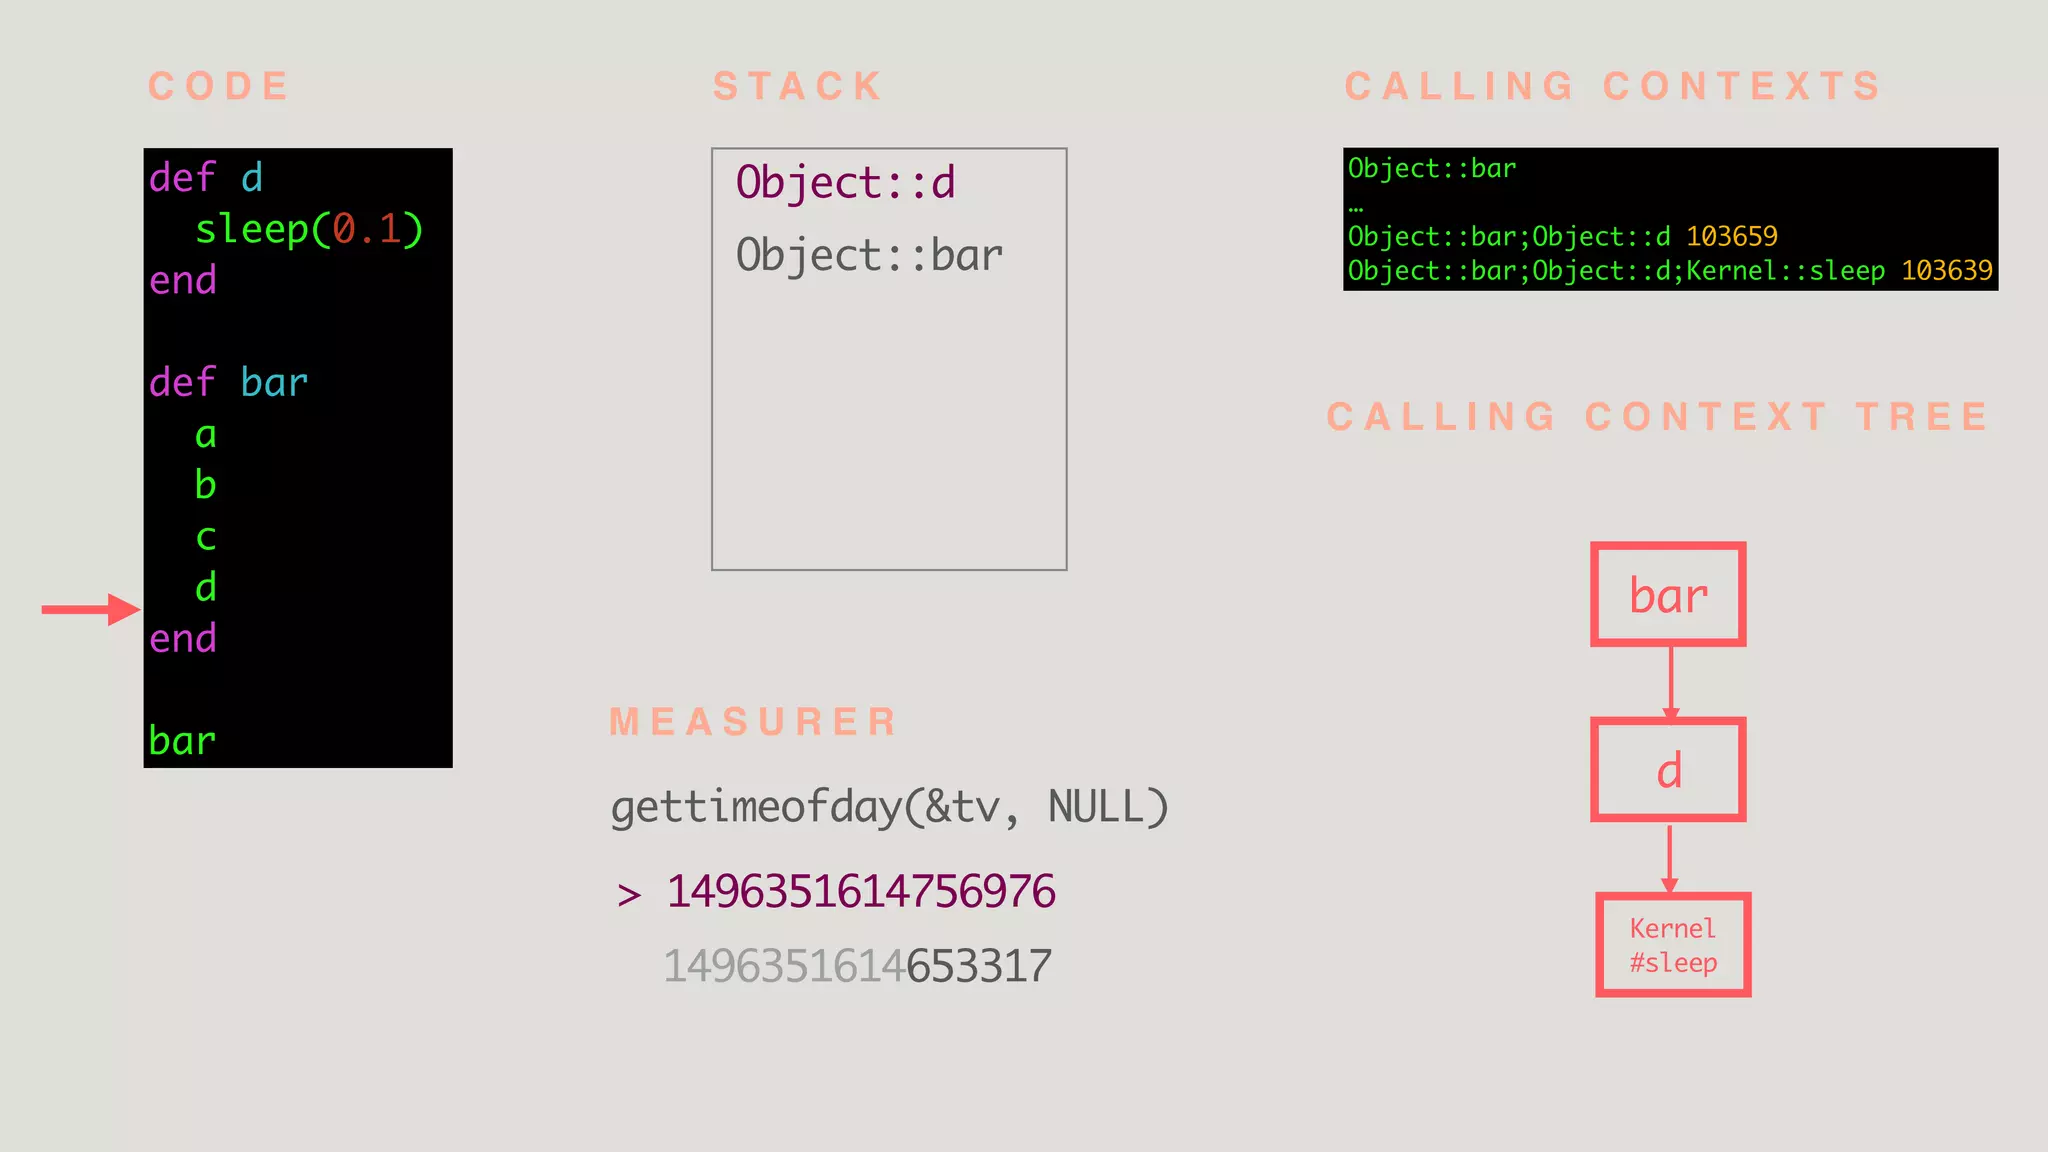
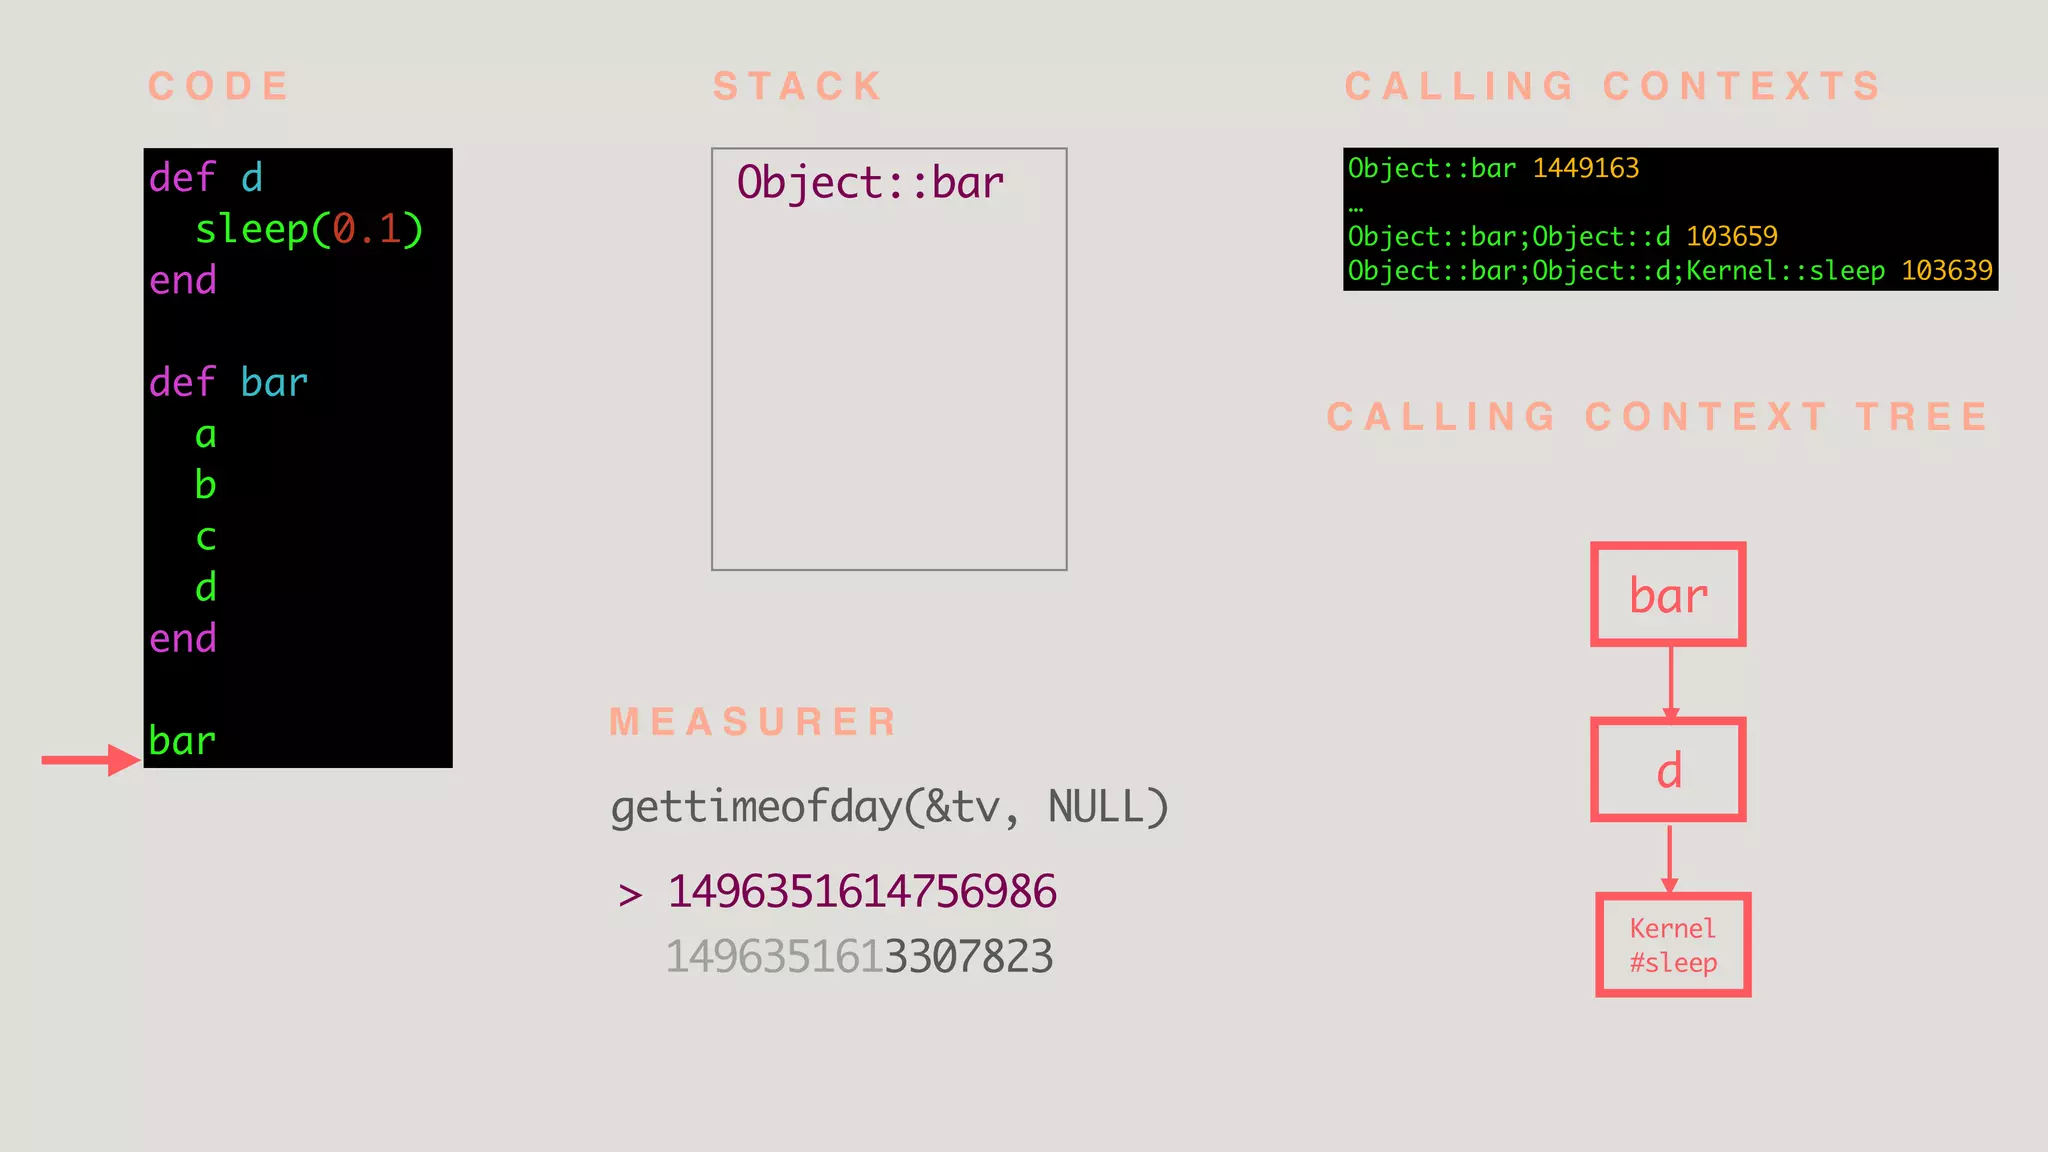
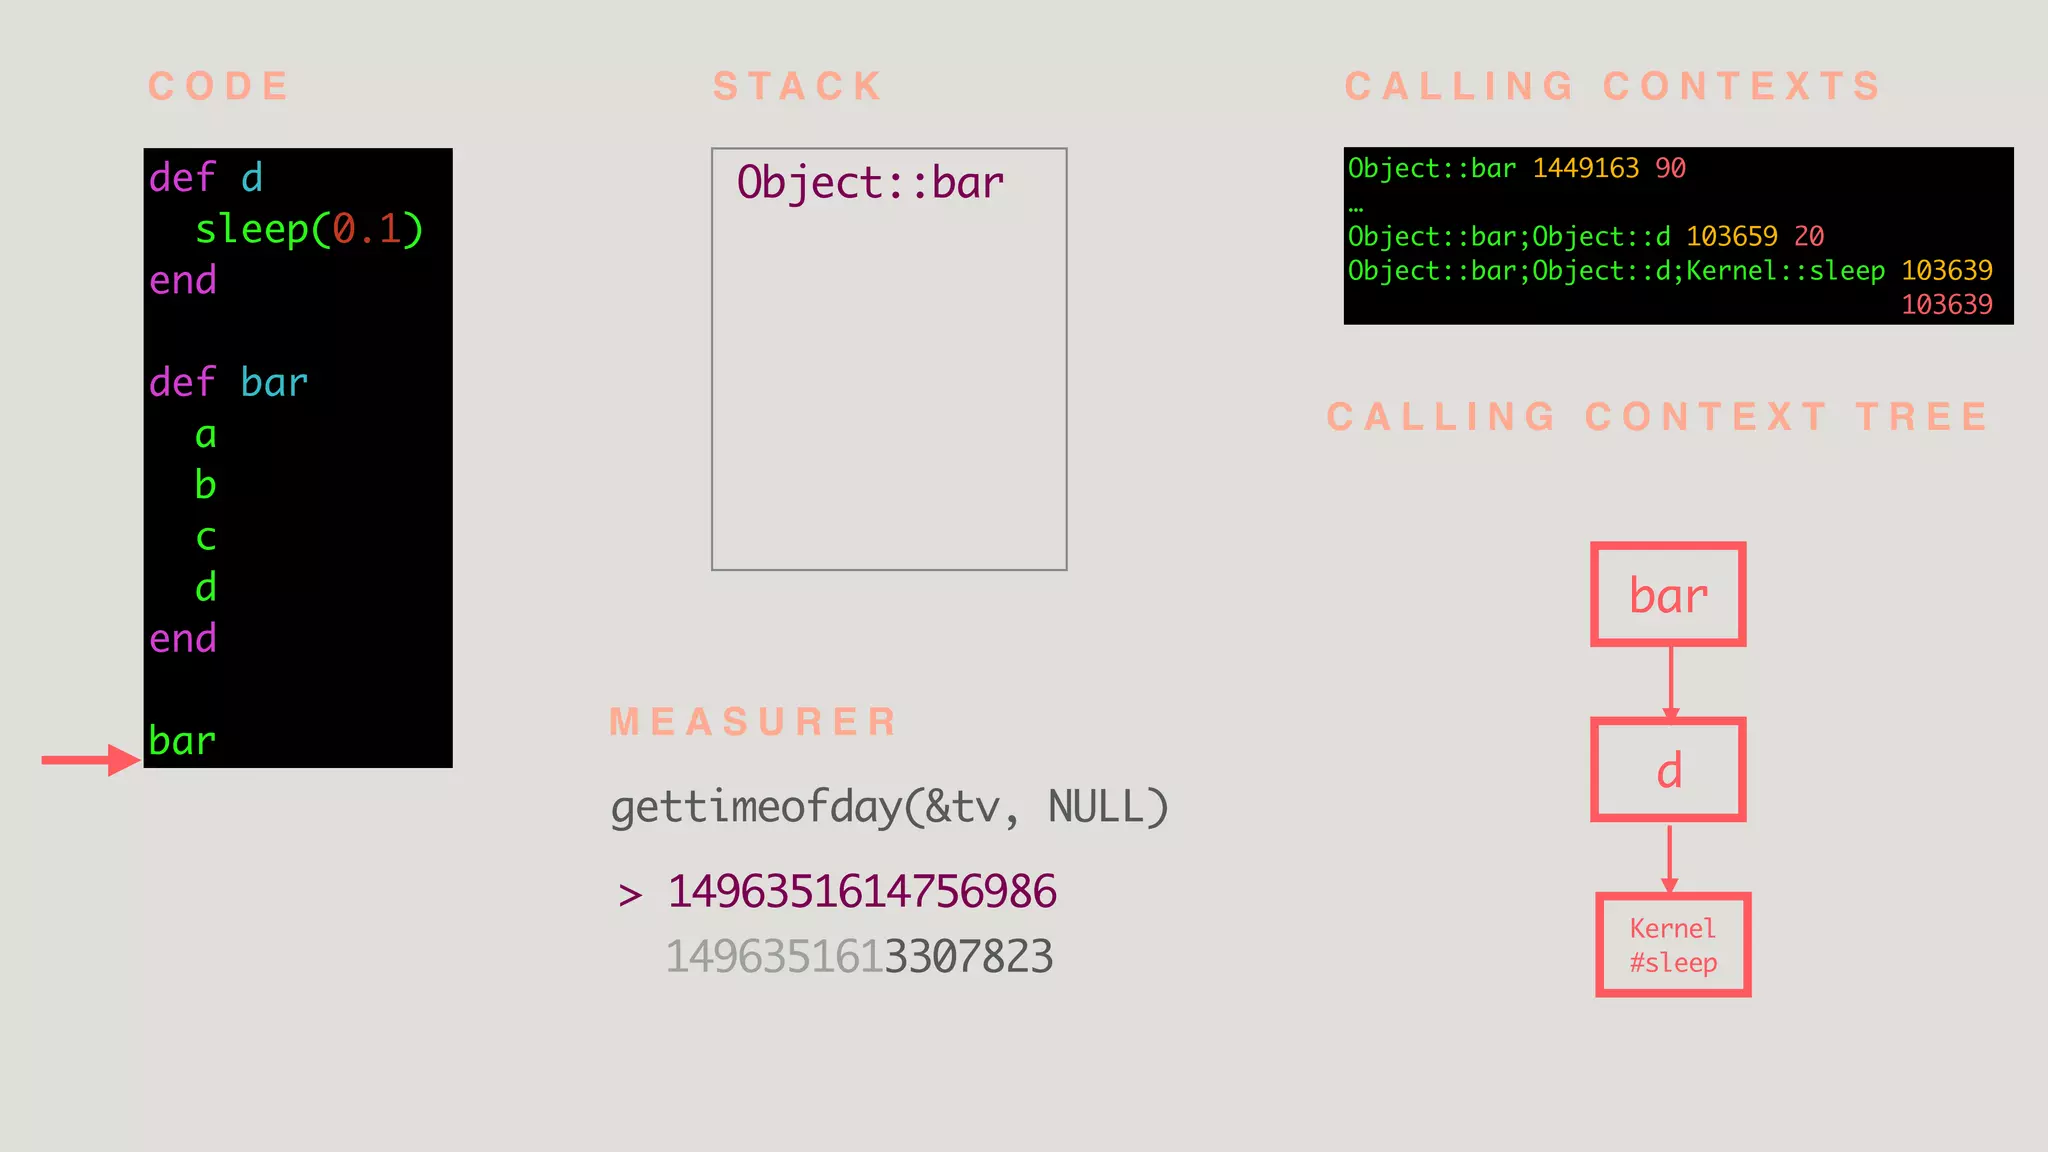
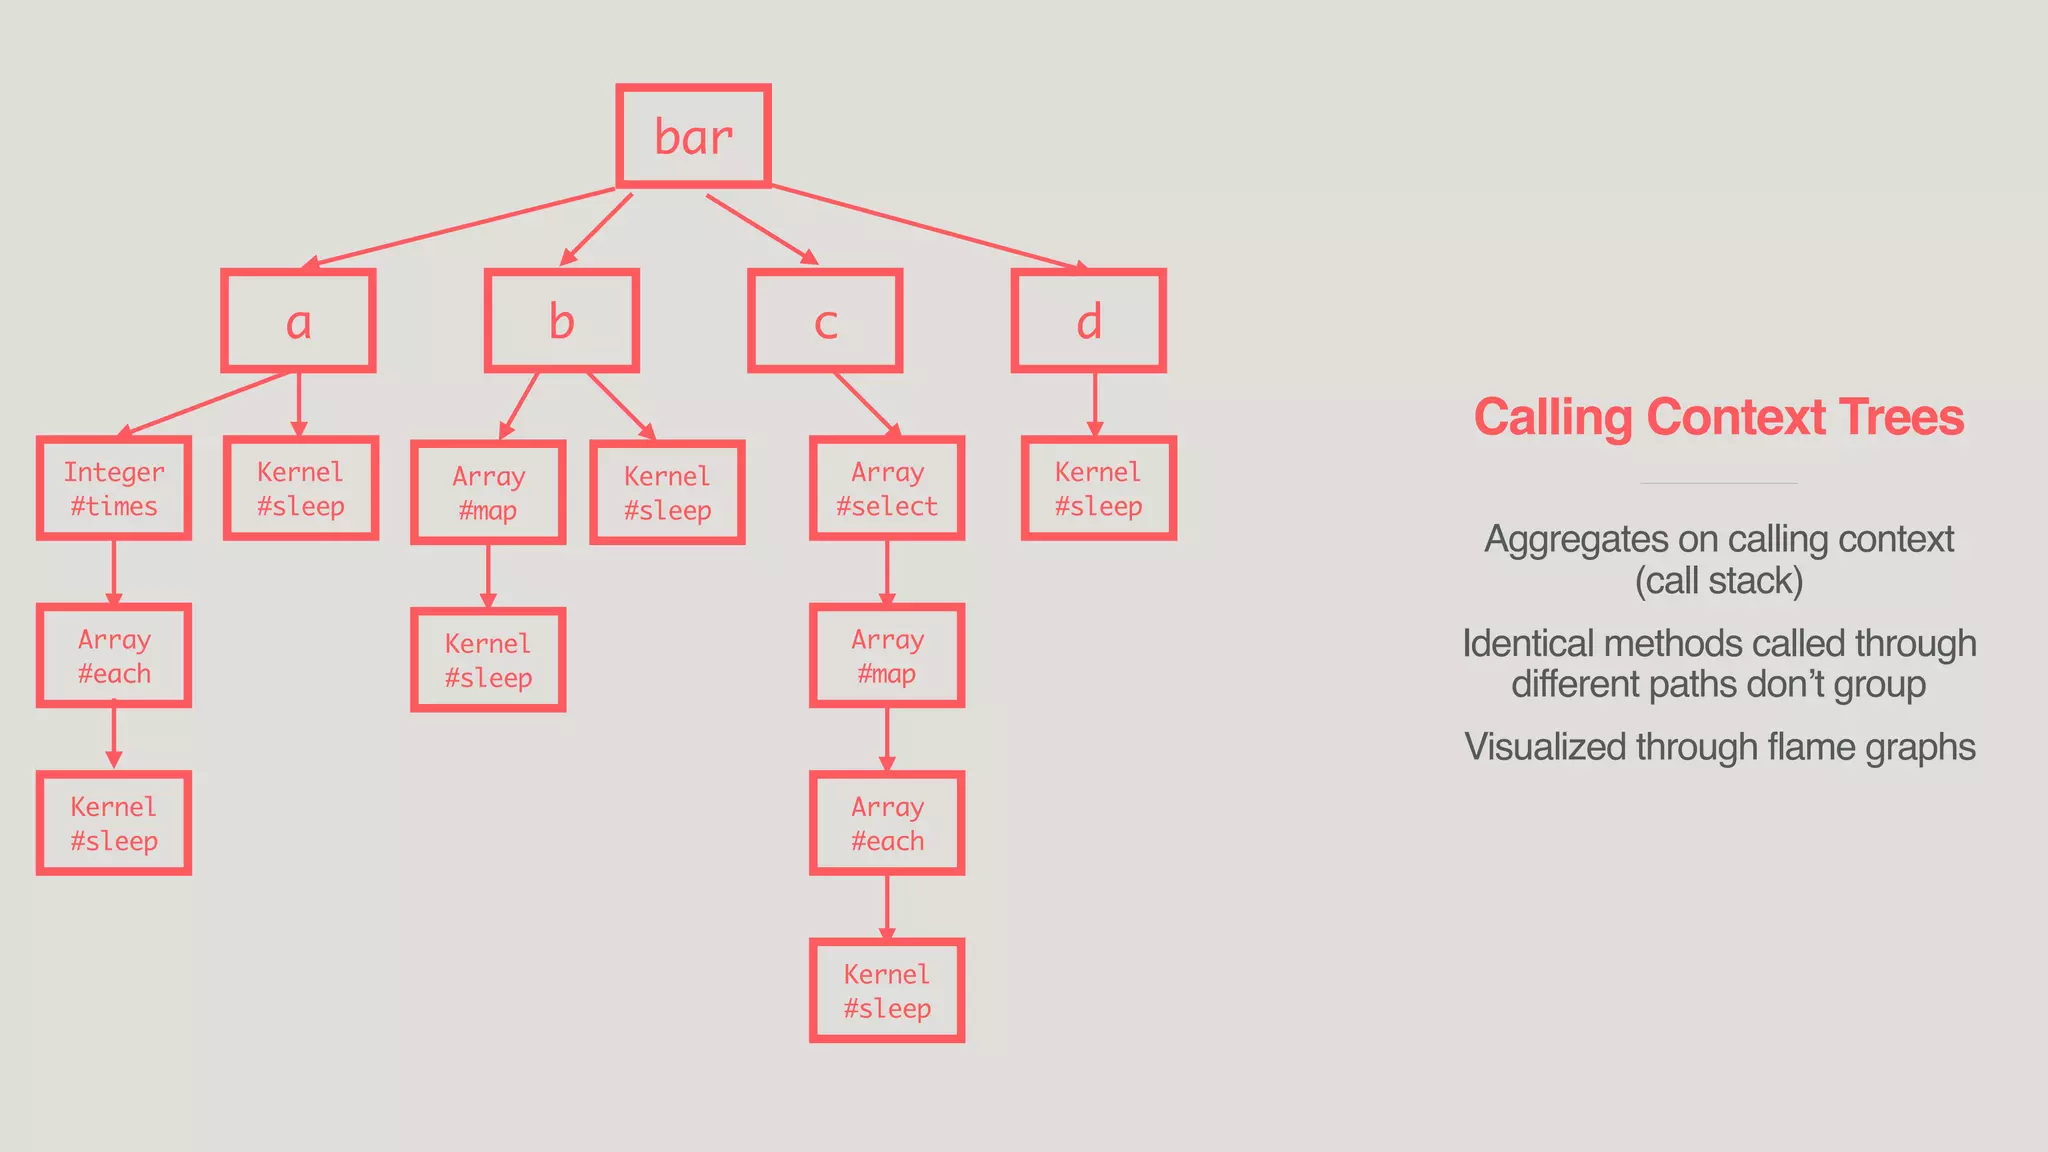
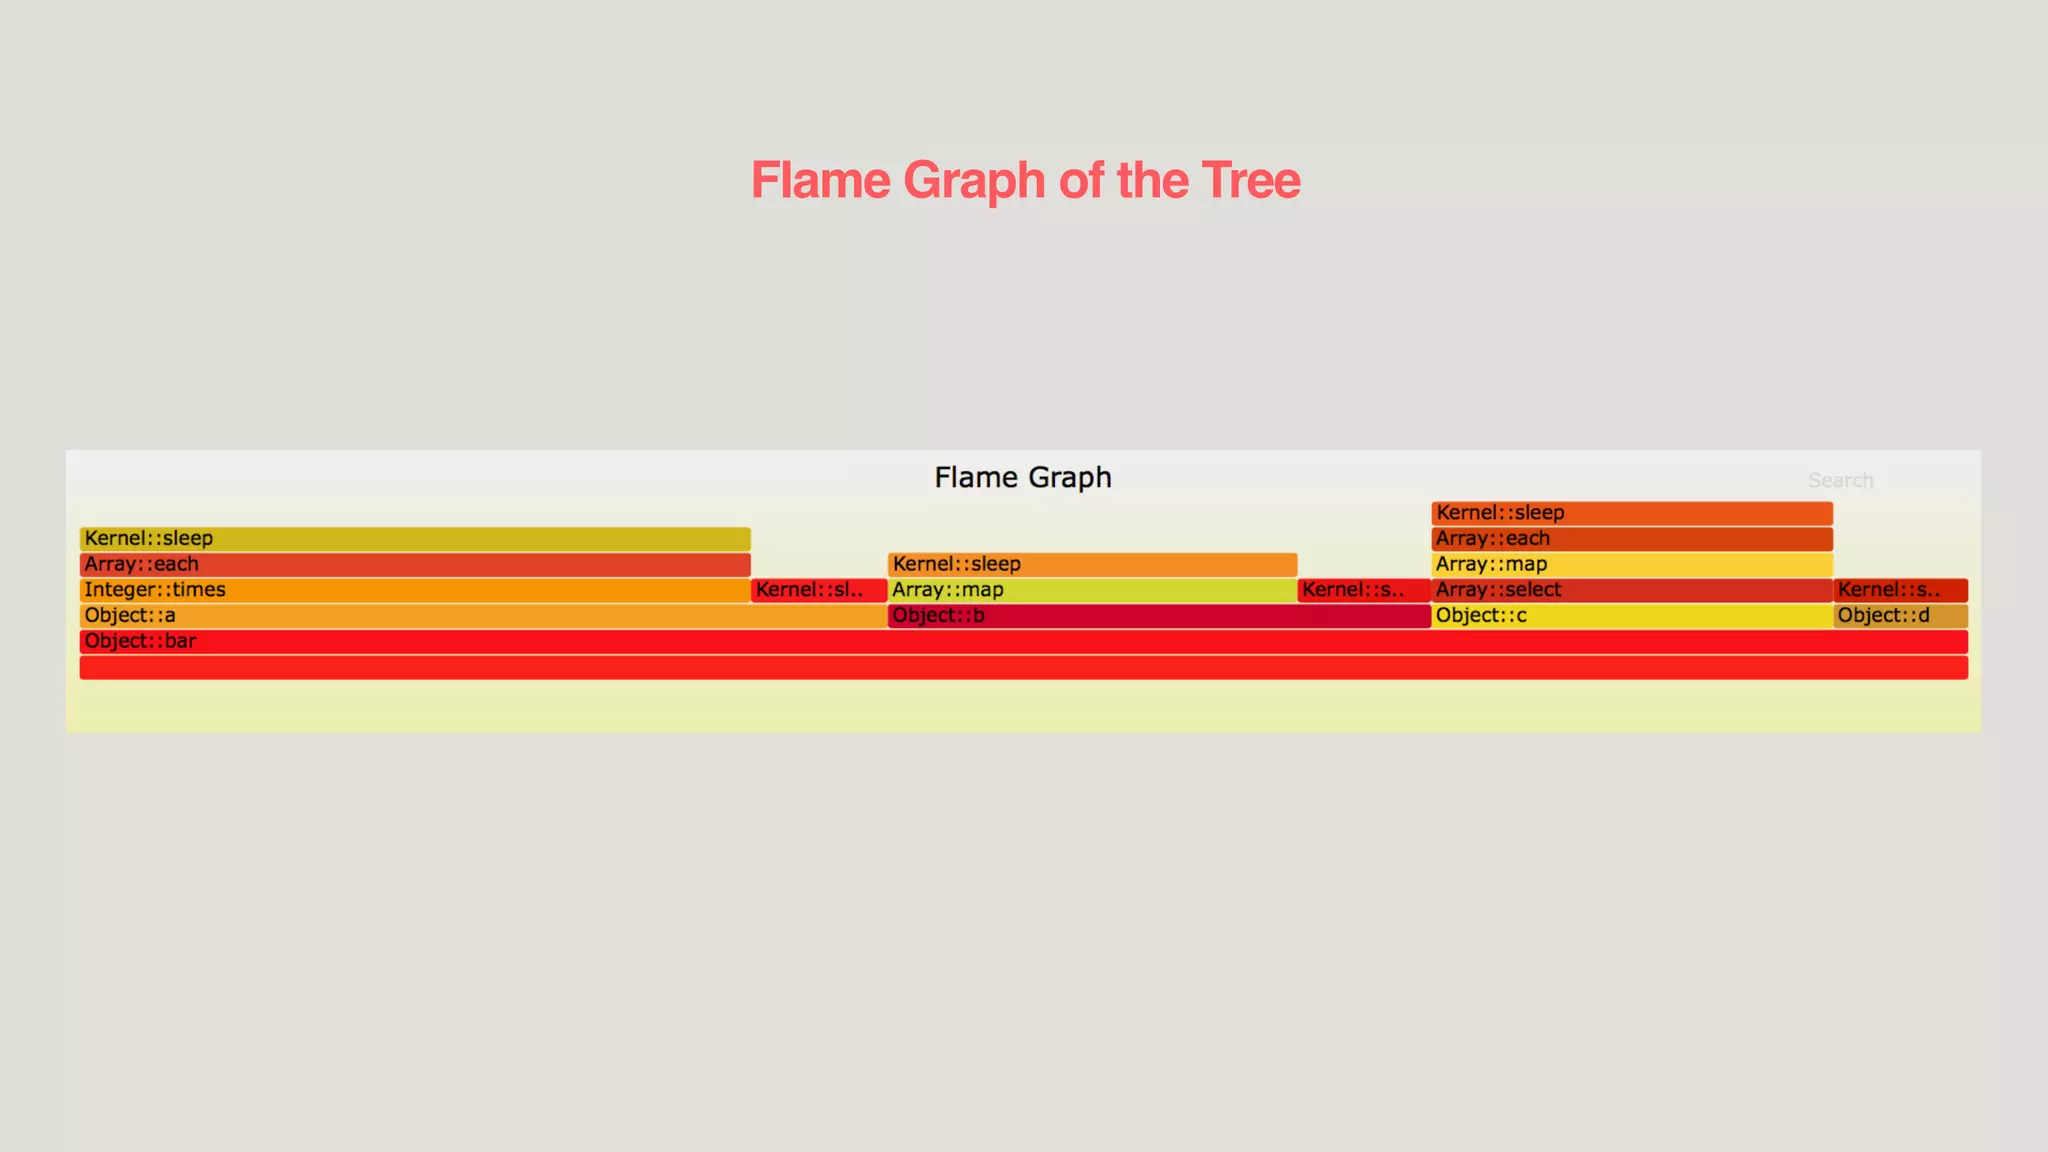
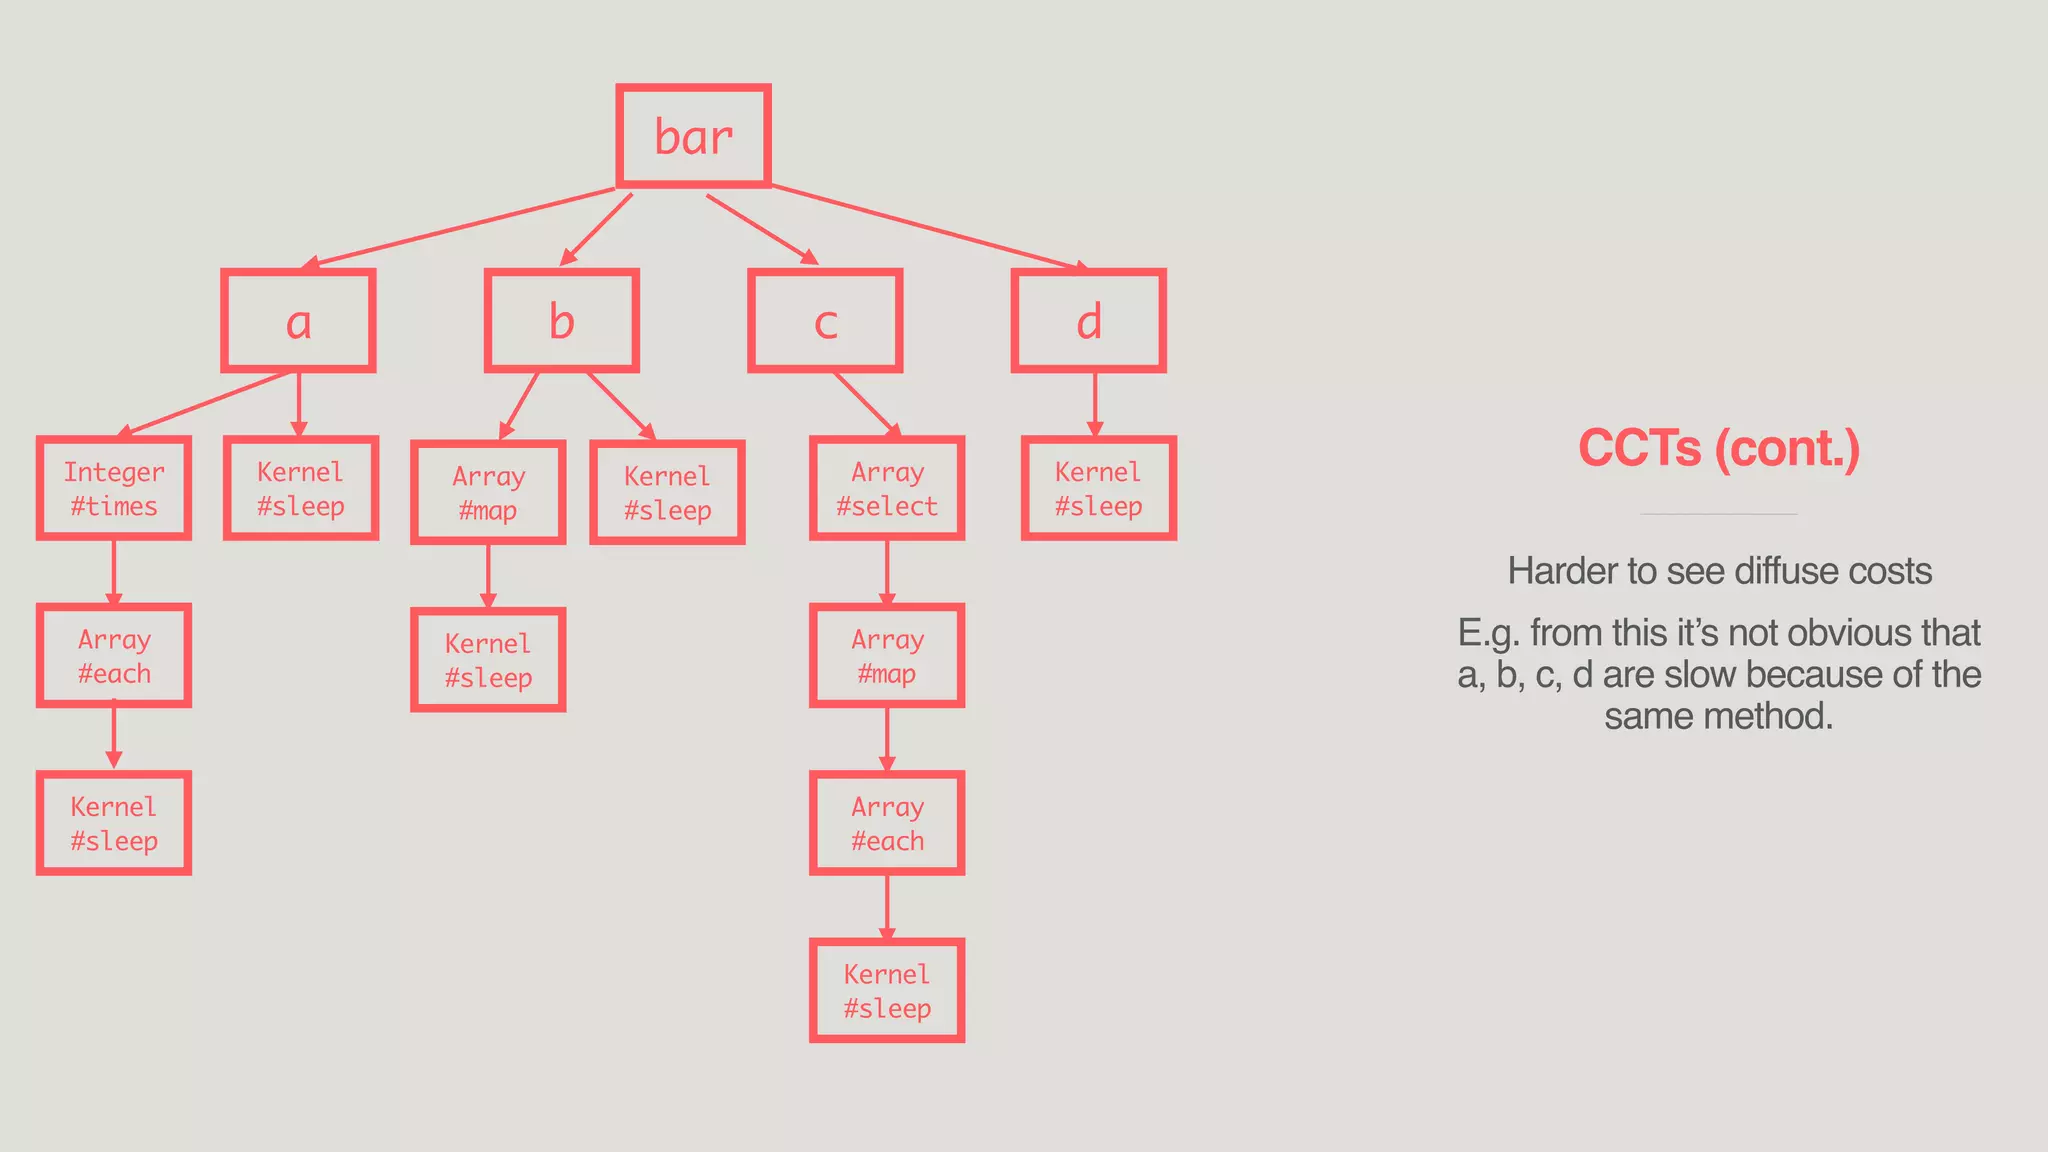
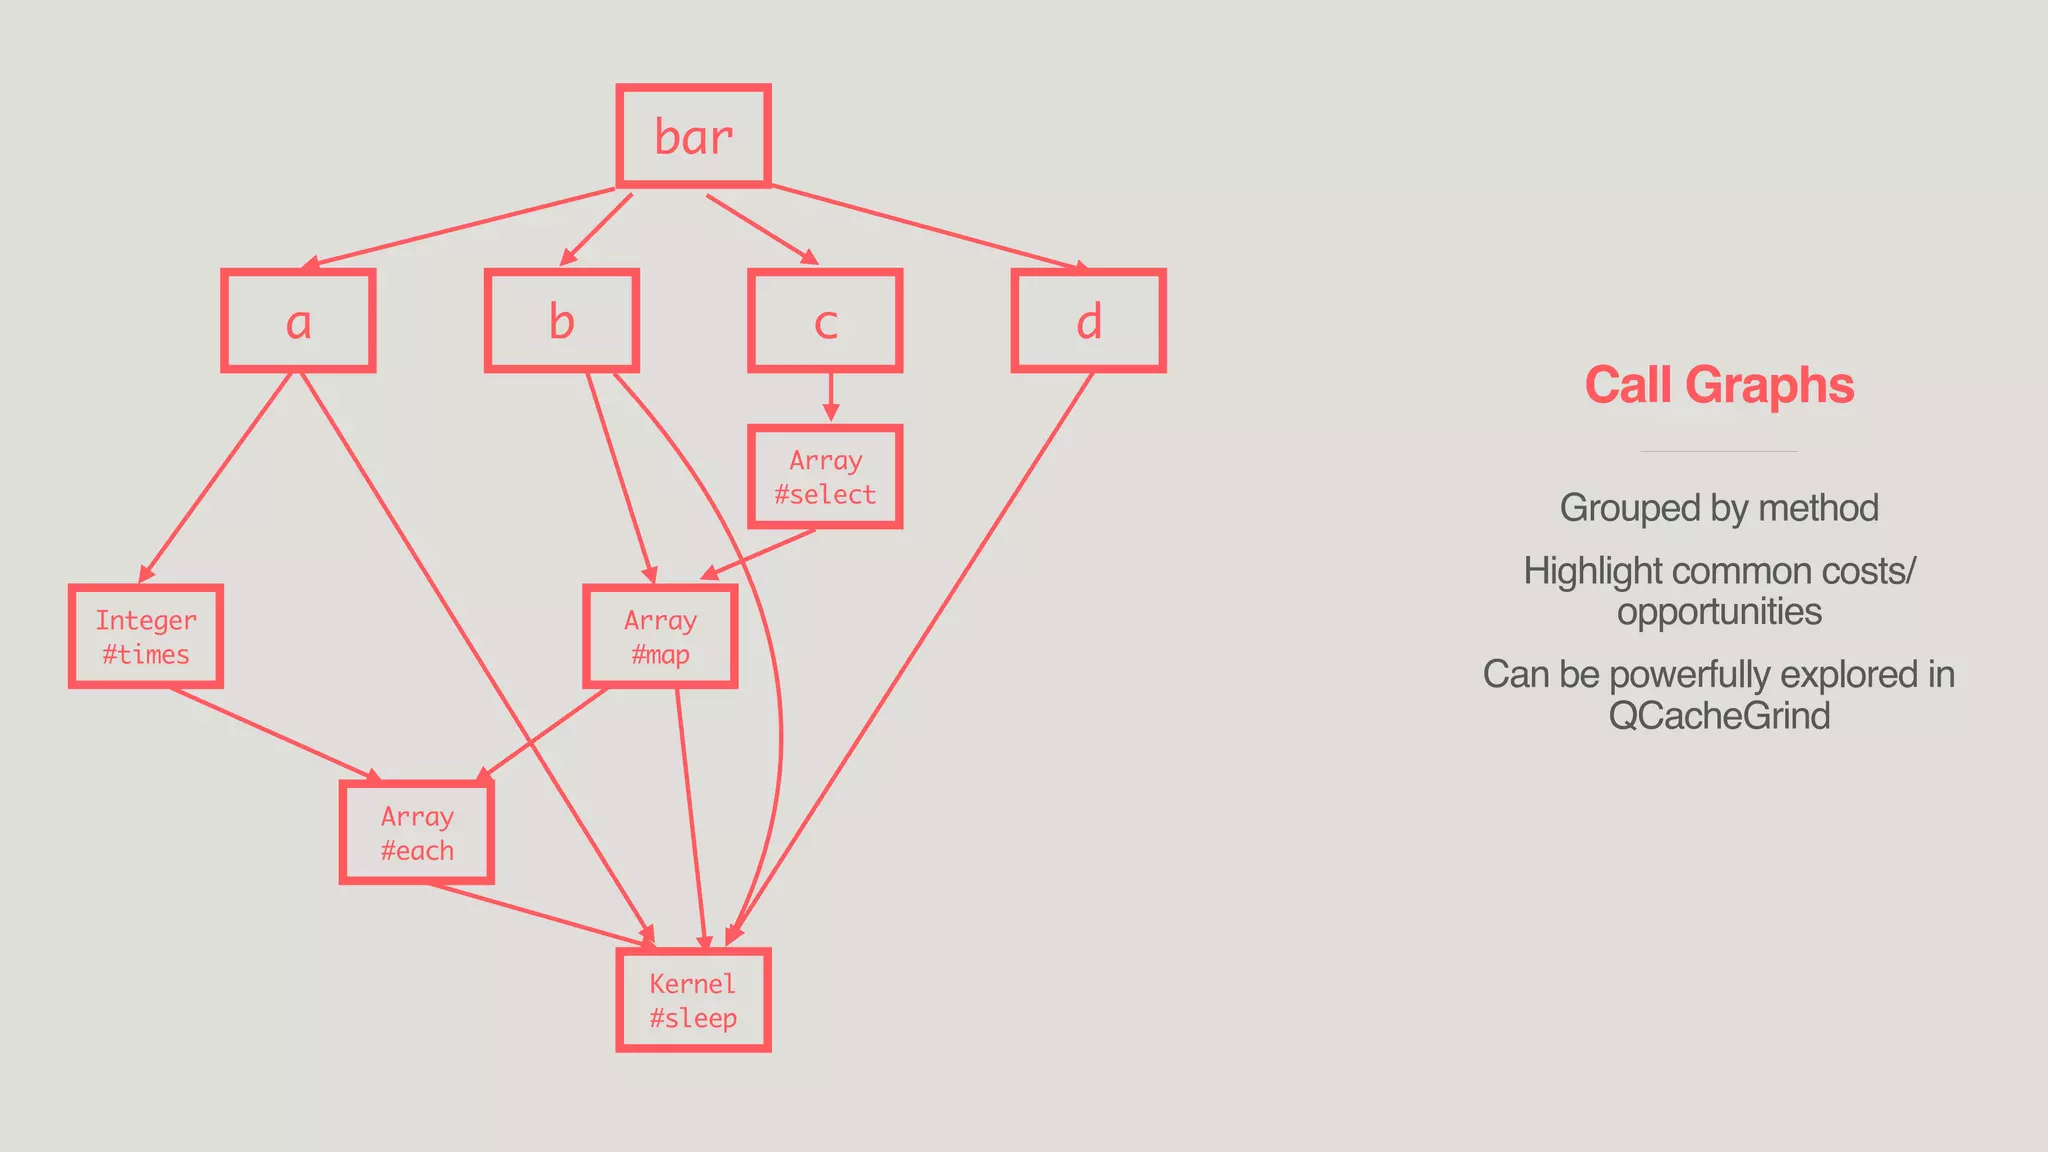
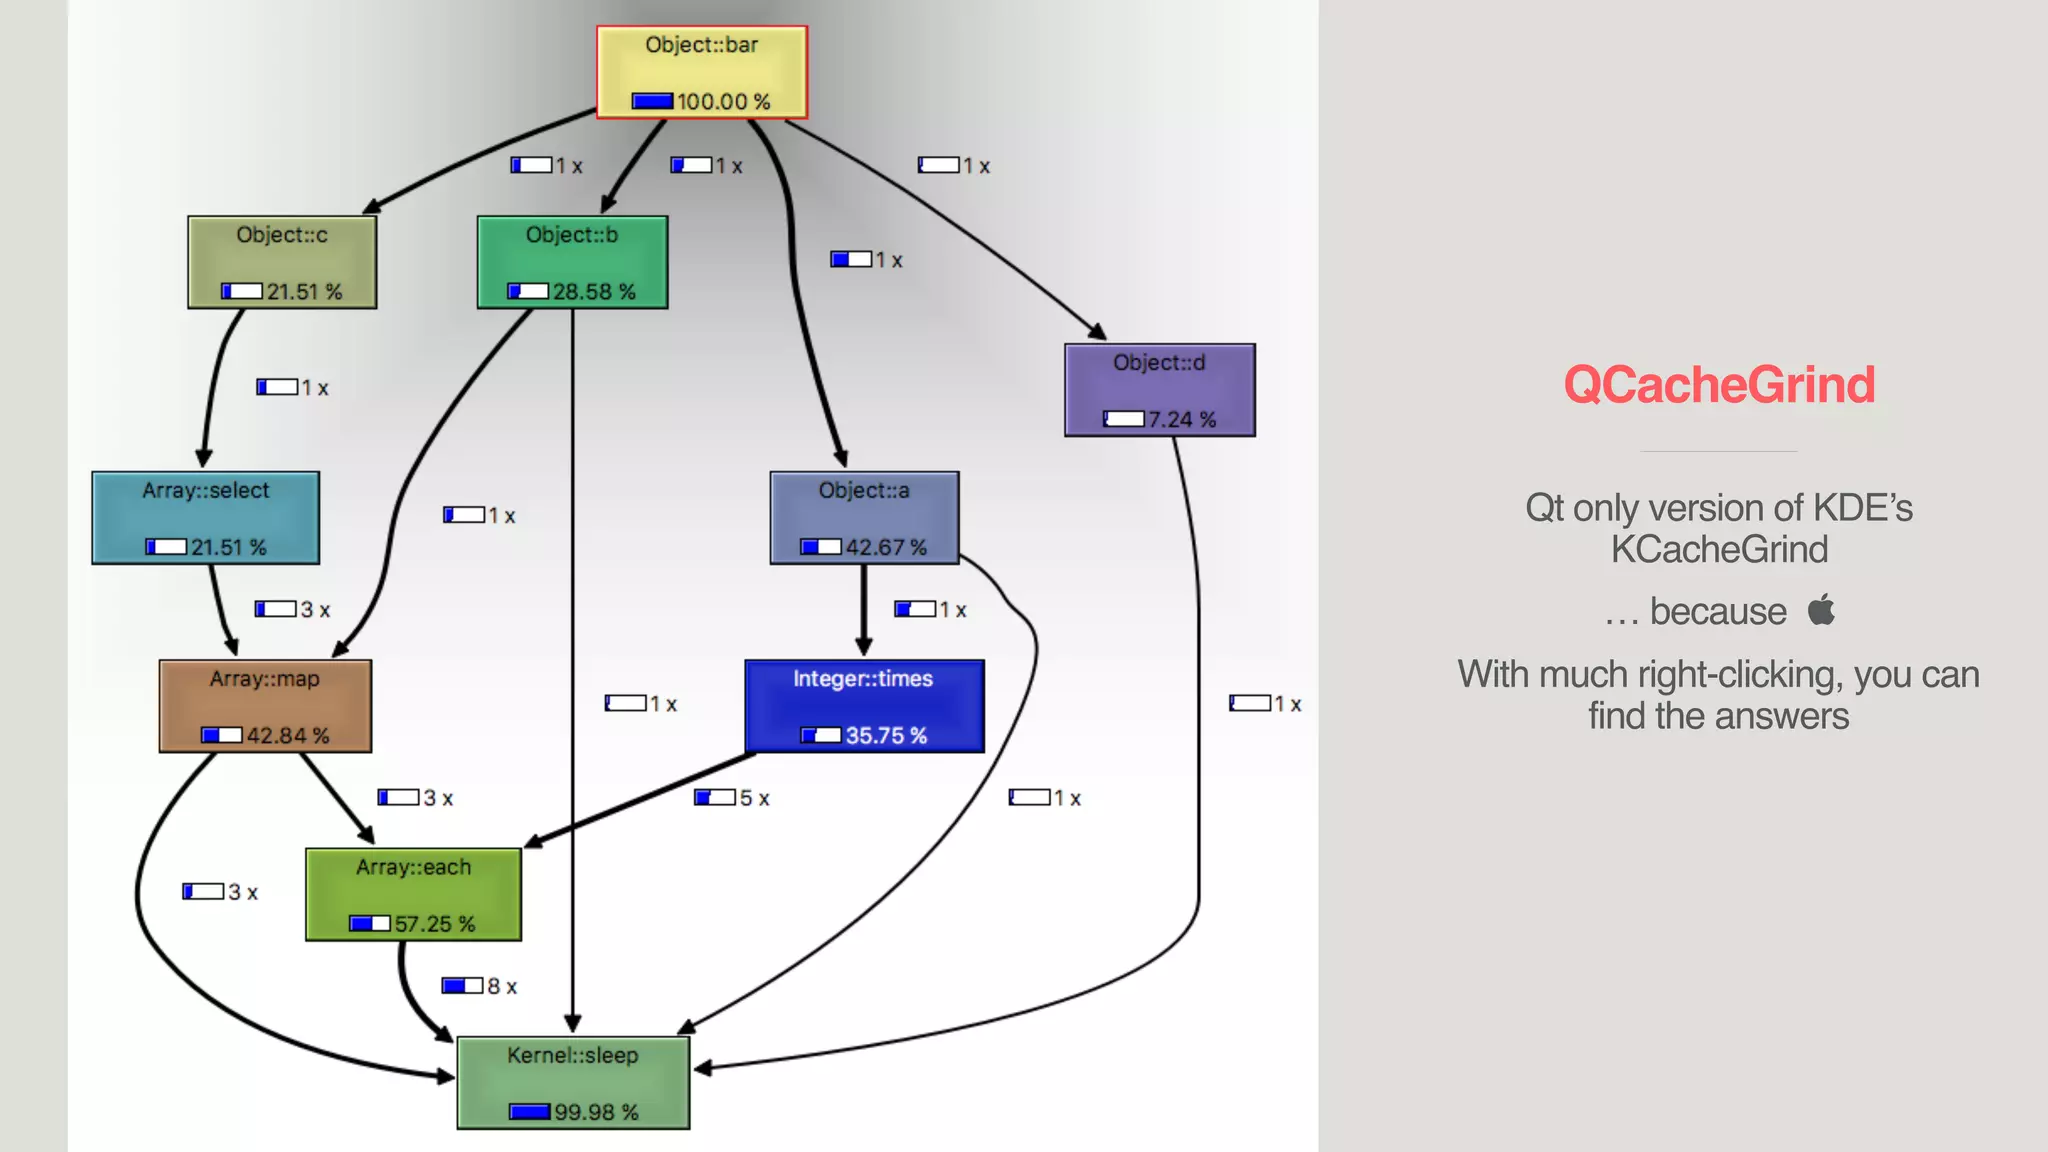
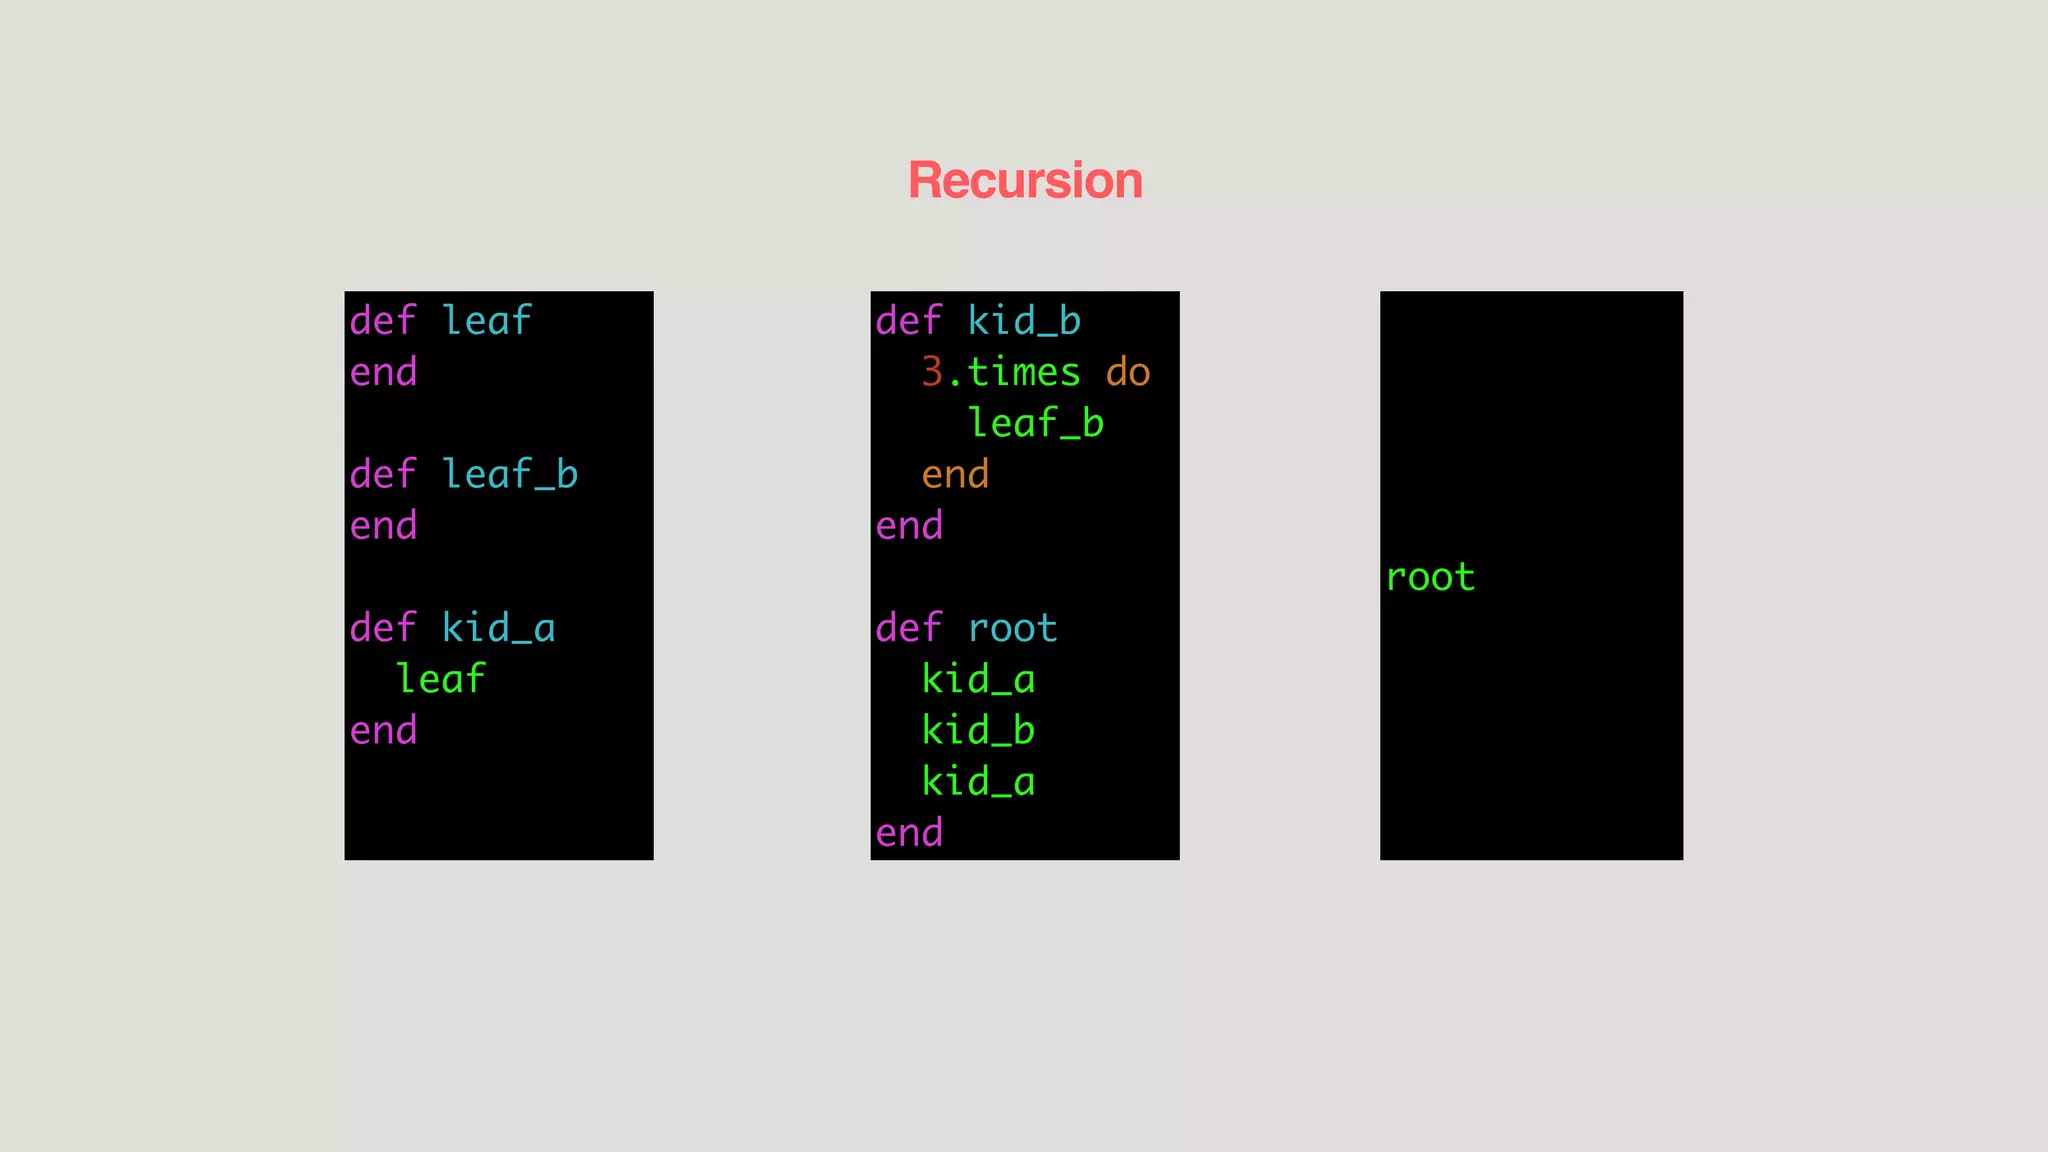
![Let’s trace some code
def a
5.times do
[0].each do
sleep(0.1)
end
end
sleep(0.1)
end
def b
[0,2,3].map do
sleep(0.1)
end
sleep(0.1)
end
def c
[1,2,3].select do
[0].map do
[0].each do
sleep(0.1)
end
end
false
end
end
def d
sleep(0.1)
end
def bar
a
b
c
d
end](https://image.slidesharecdn.com/scalingrailswithruby-prof-rubyconfkenya2017atbybenhughes1-170729072305/75/Scaling-Rails-with-Ruby-prof-Ruby-Conf-Kenya-2017-by-Ben-Hughes-38-2048.jpg)


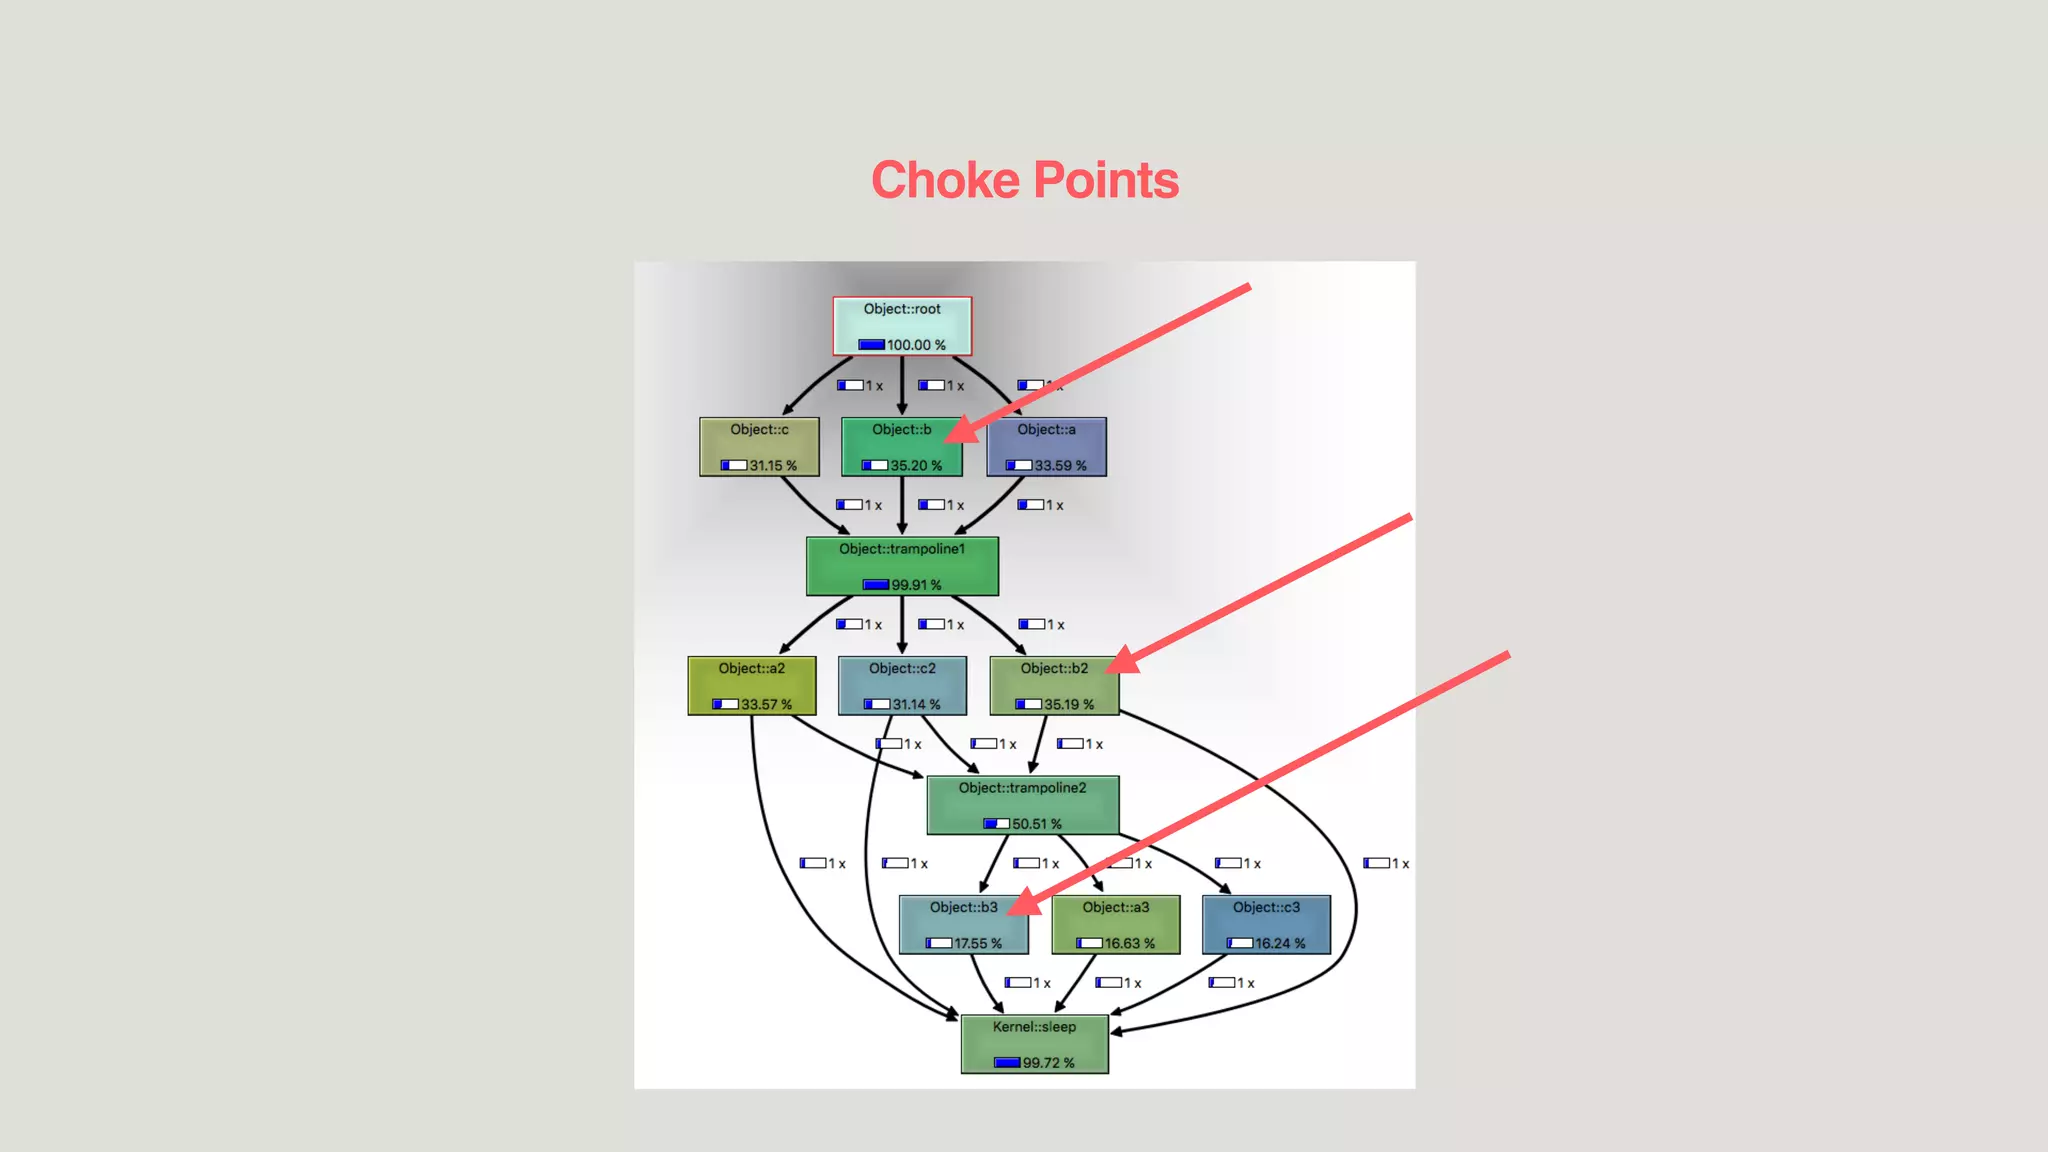
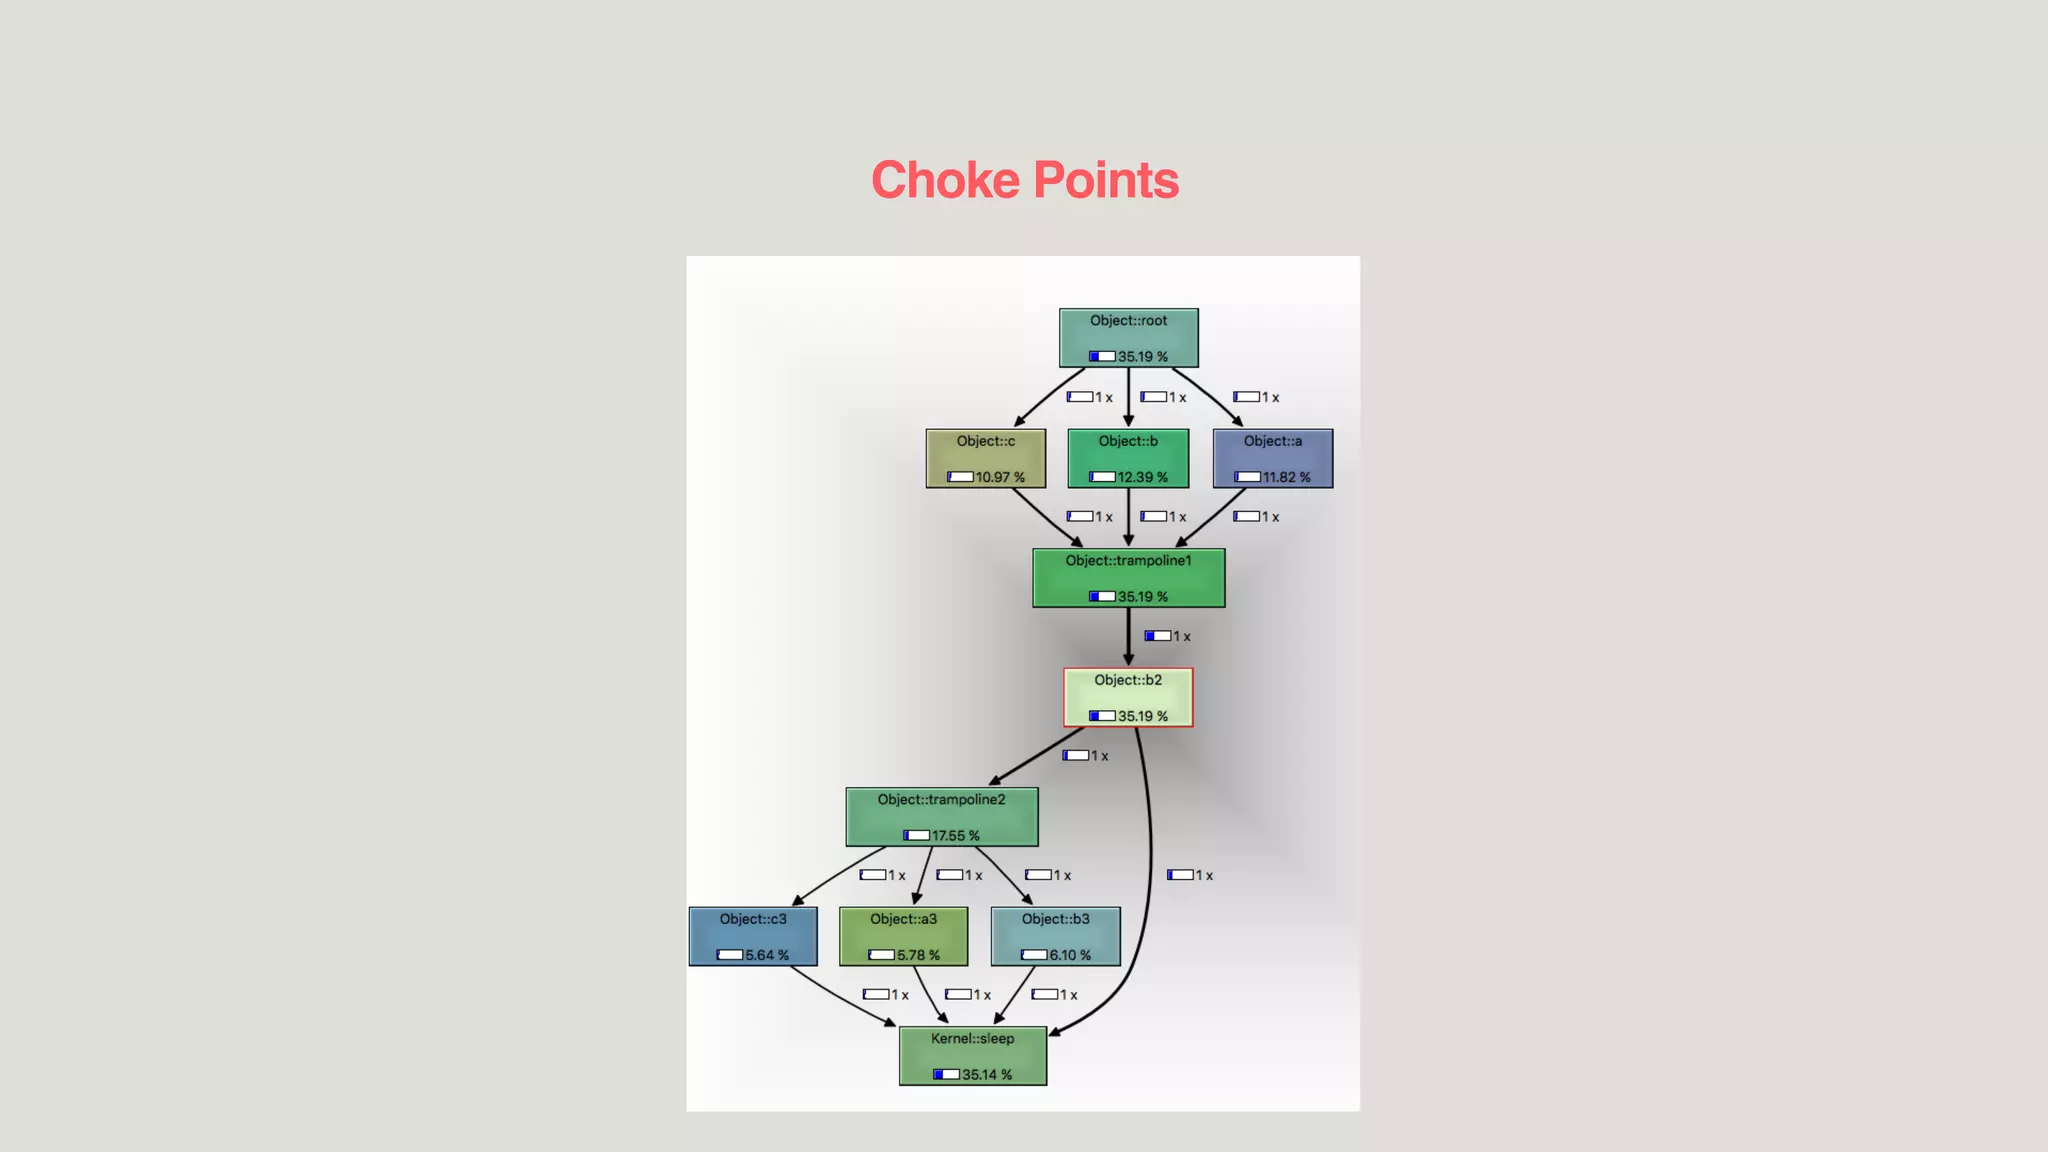
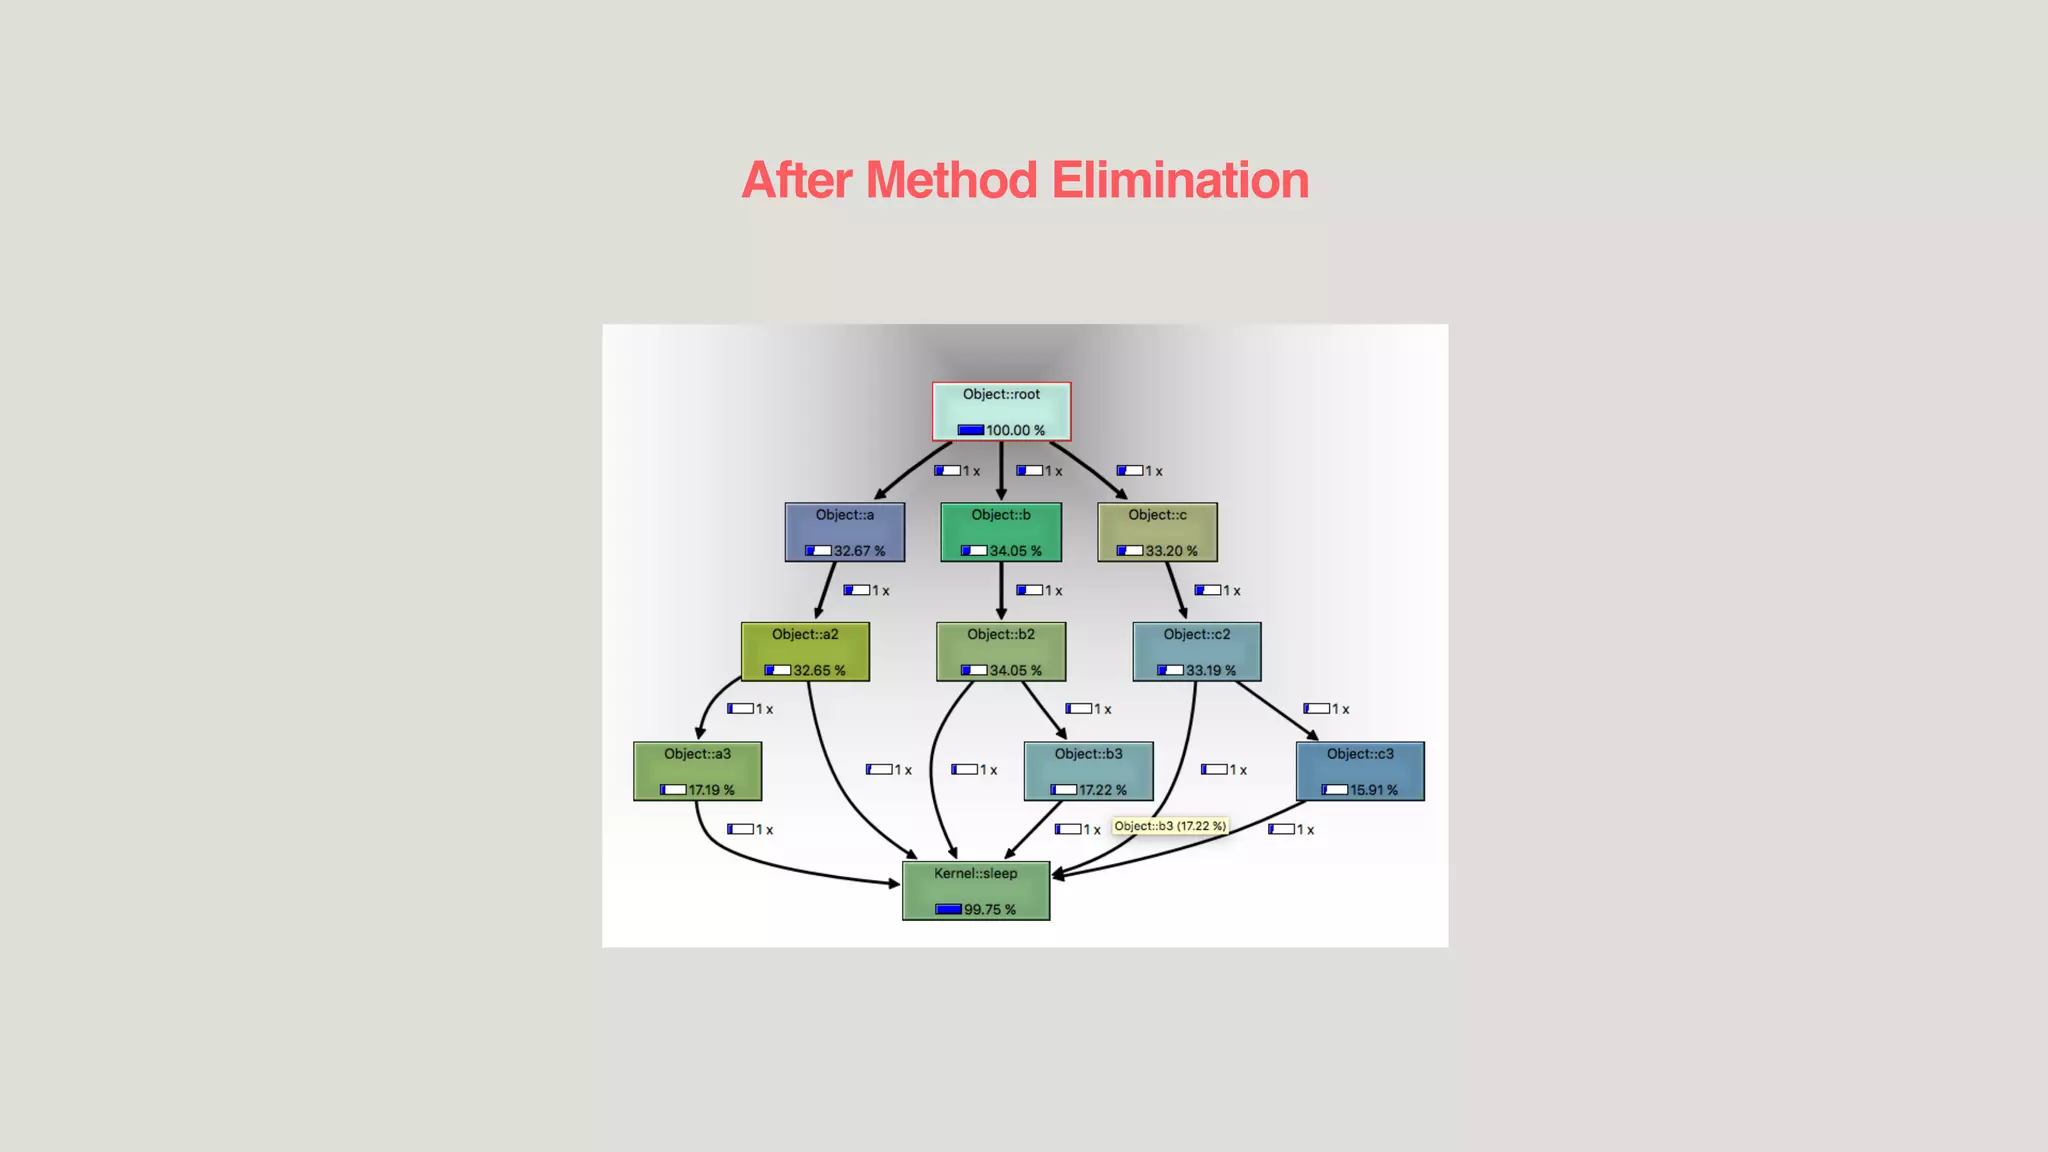
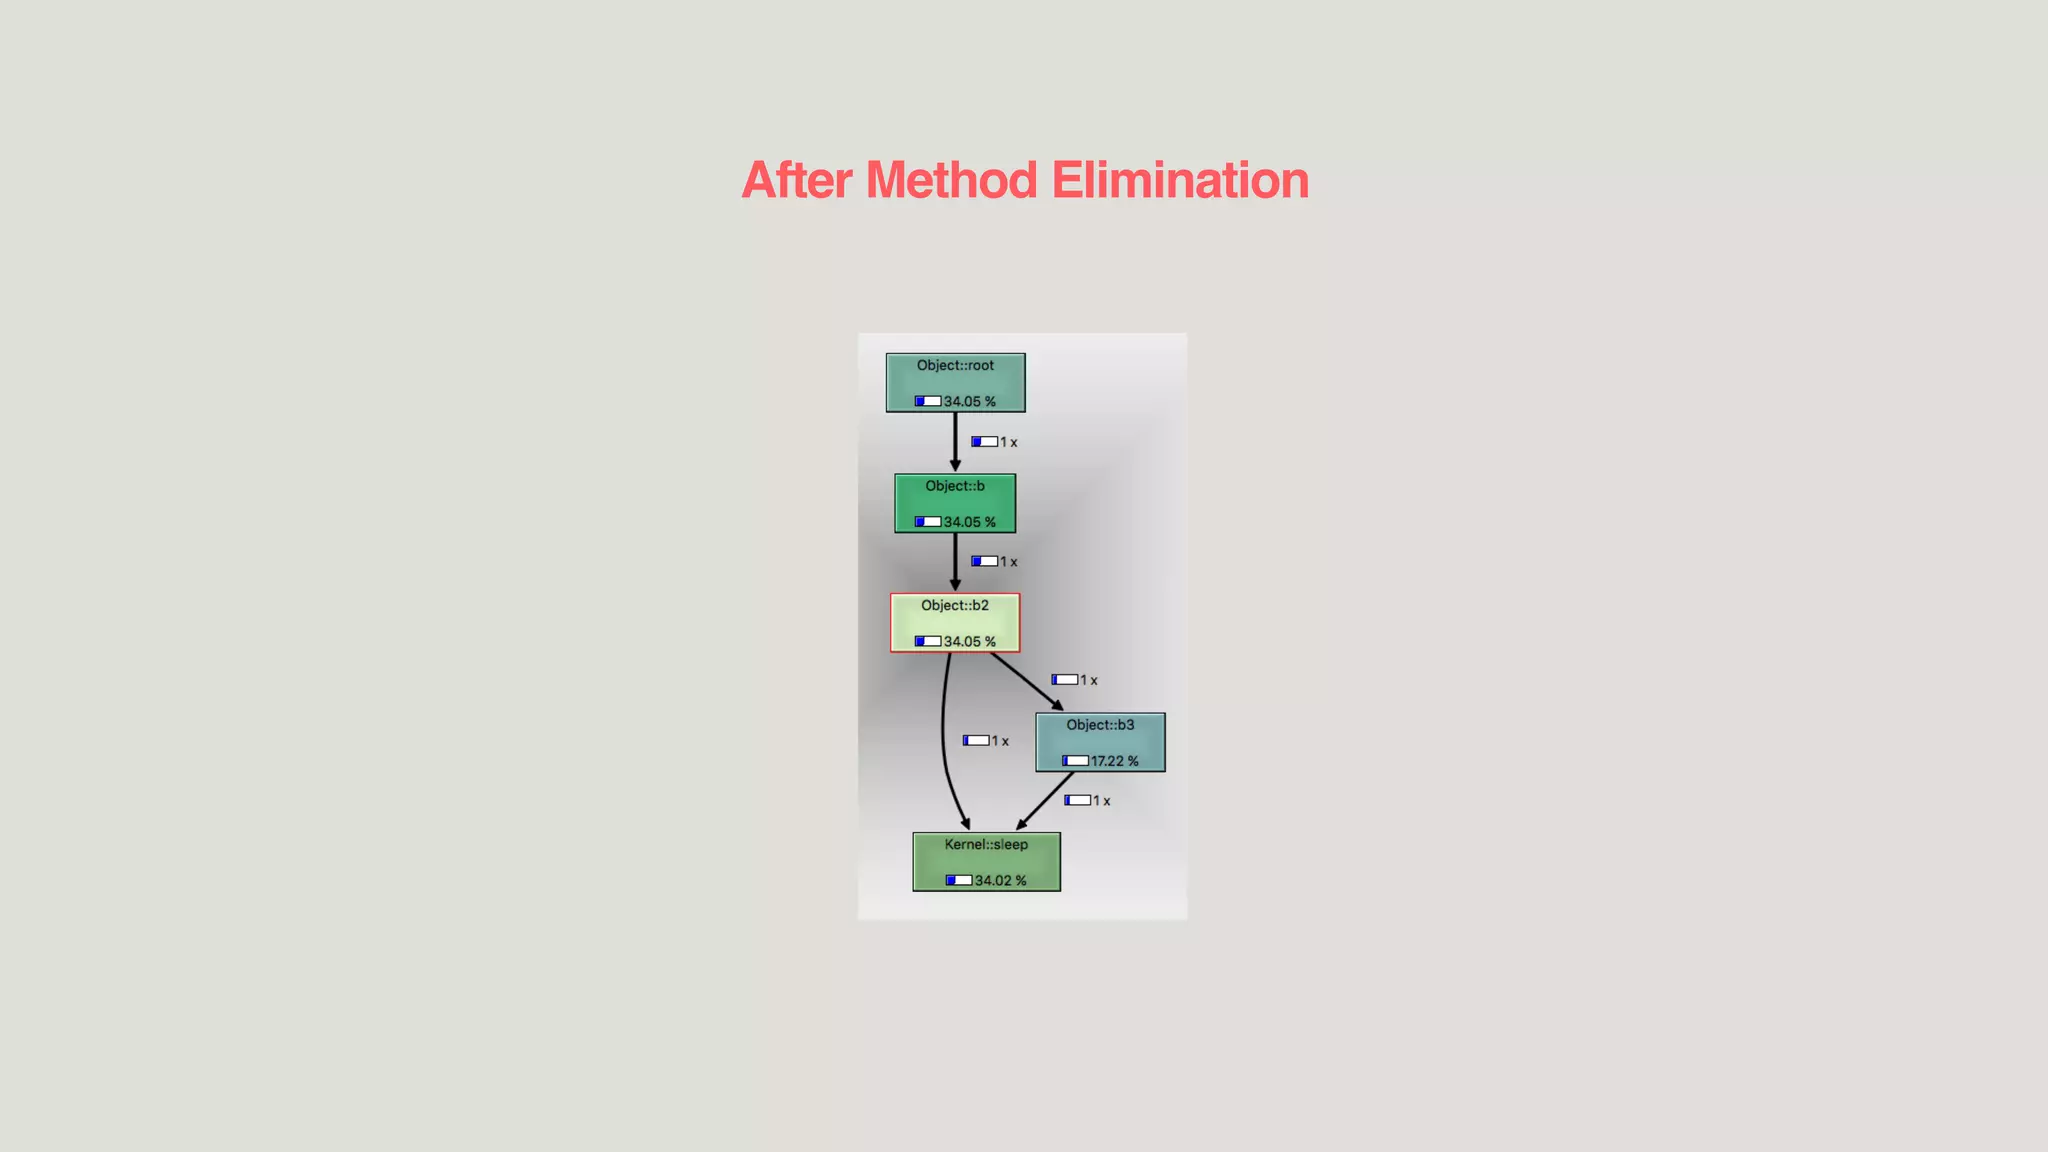
![Method Elimination
profile = RubyProf::Profile.new
profile.exclude_methods!(Object, [:trampoline1, :trampoline2])
Our addition/optimization
Exclude common methods
(could also be handled by expanding calling contexts)](https://image.slidesharecdn.com/scalingrailswithruby-prof-rubyconfkenya2017atbybenhughes1-170729072305/75/Scaling-Rails-with-Ruby-prof-Ruby-Conf-Kenya-2017-by-Ben-Hughes-59-2048.jpg)


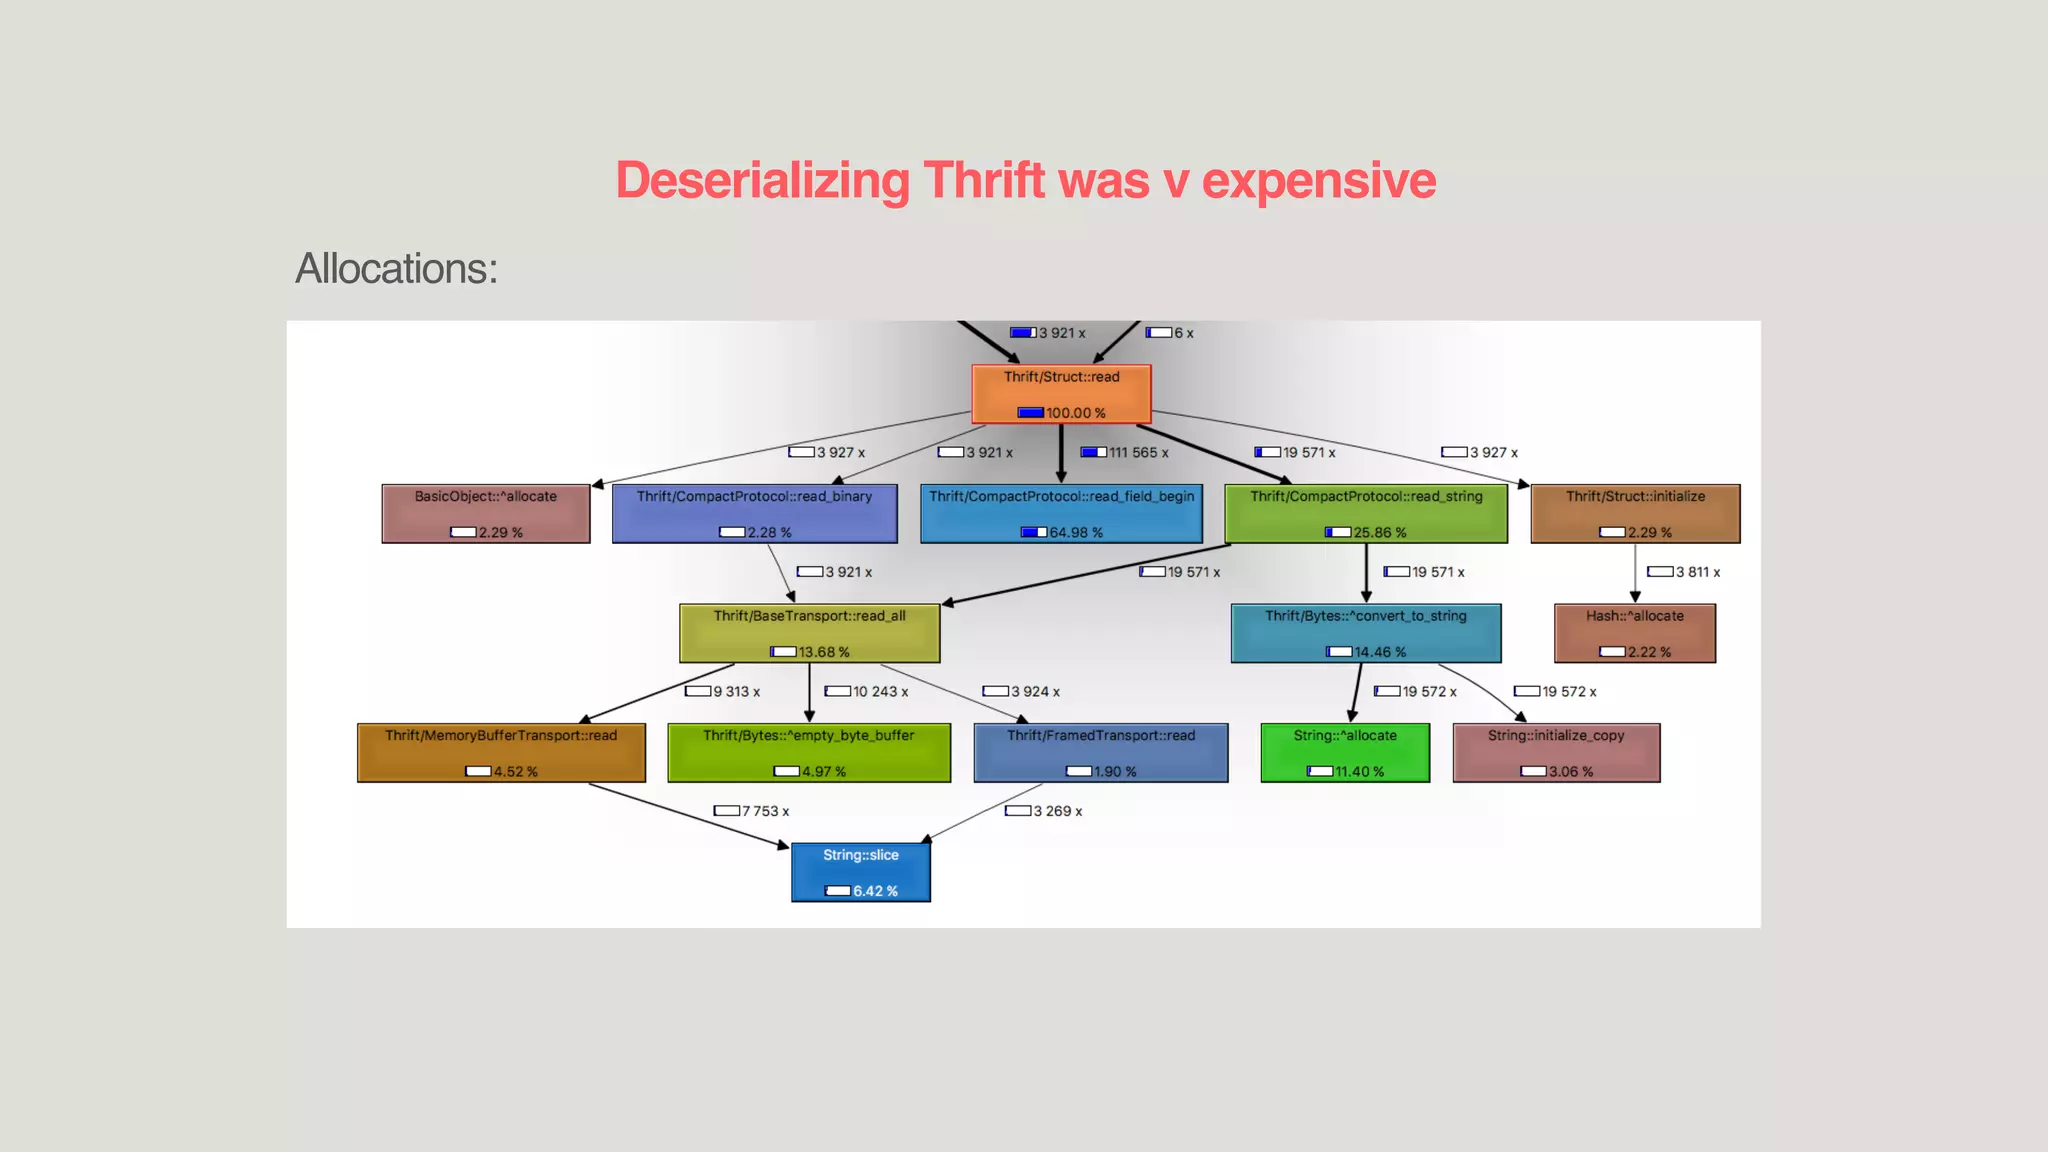
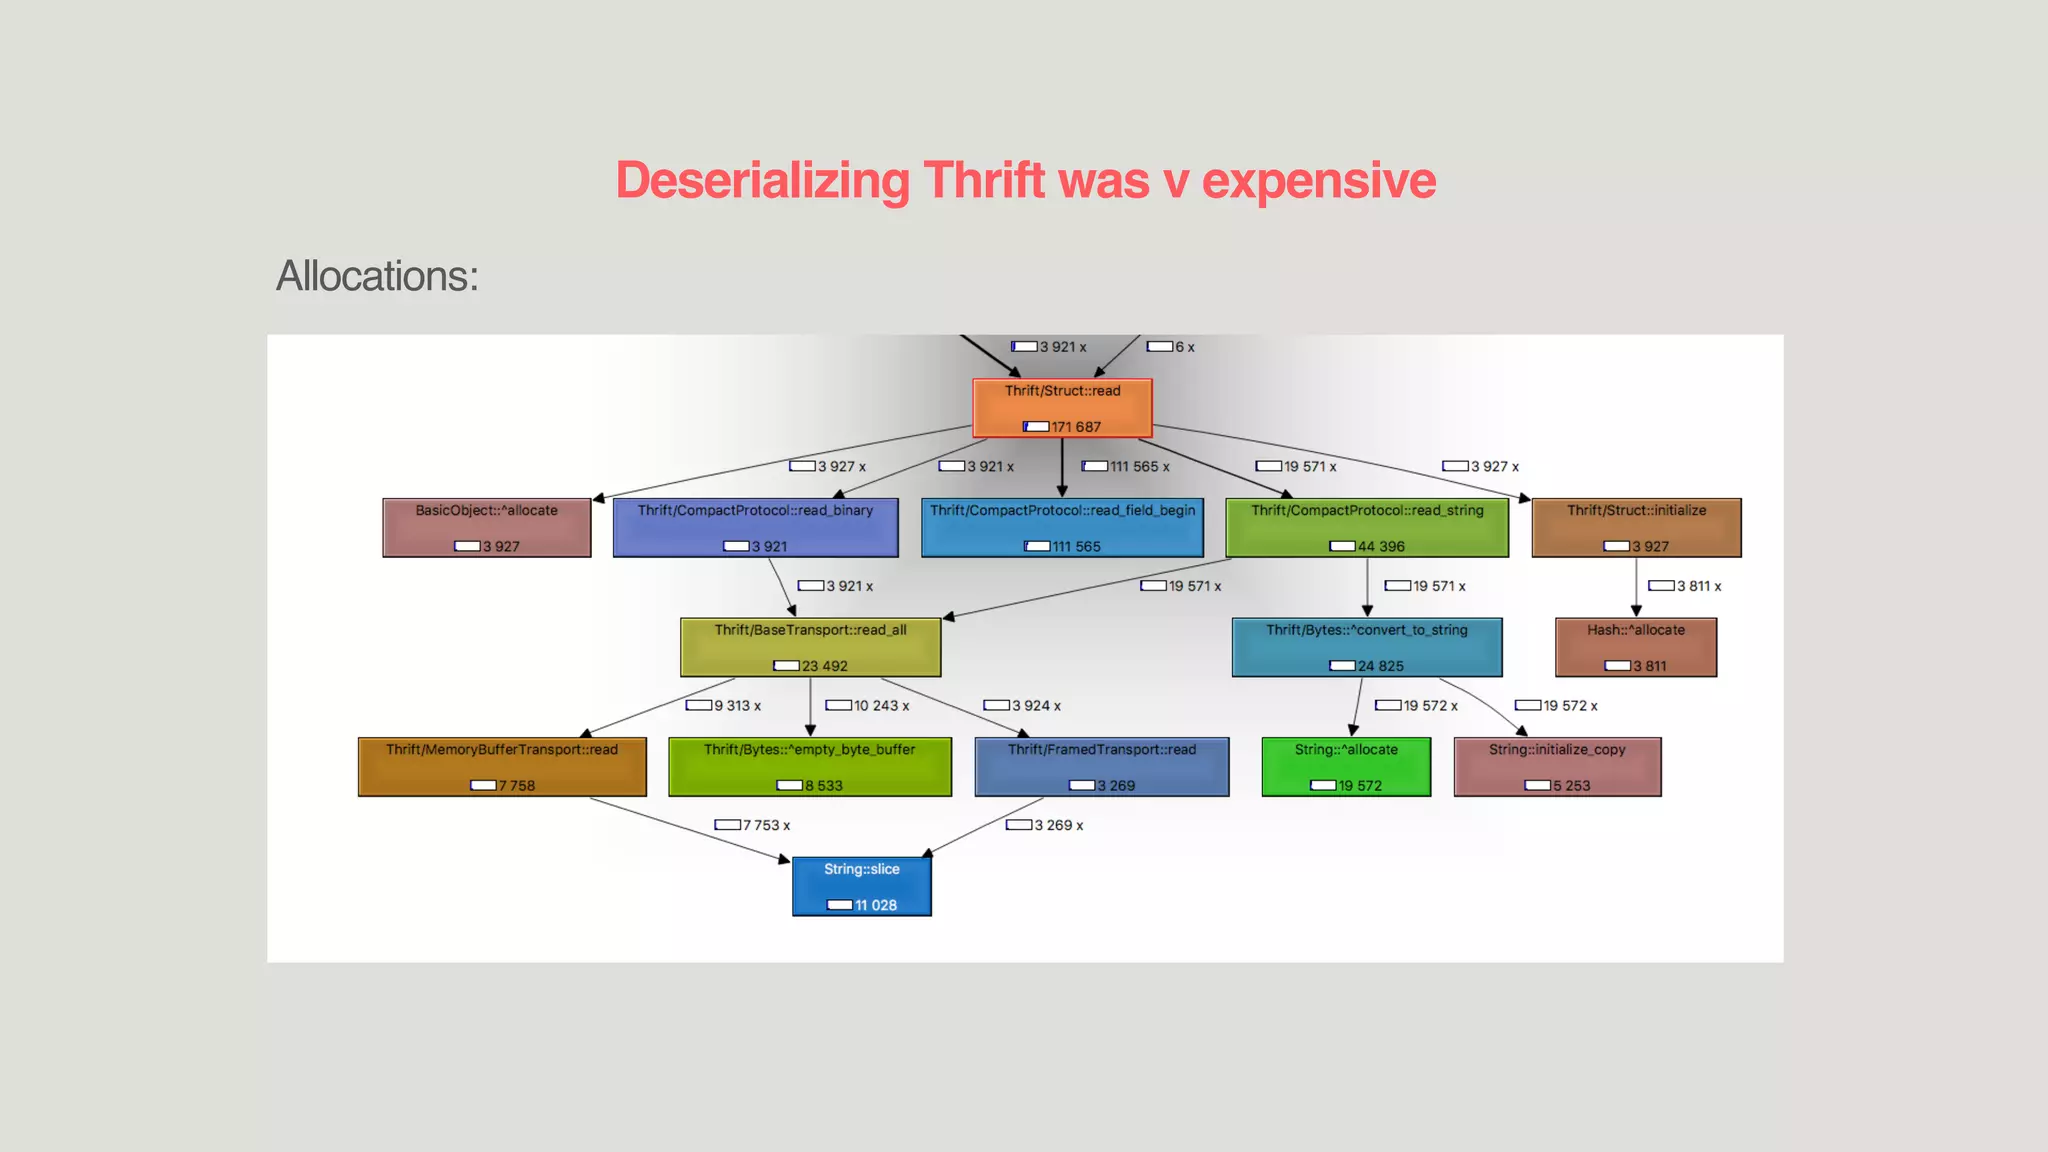

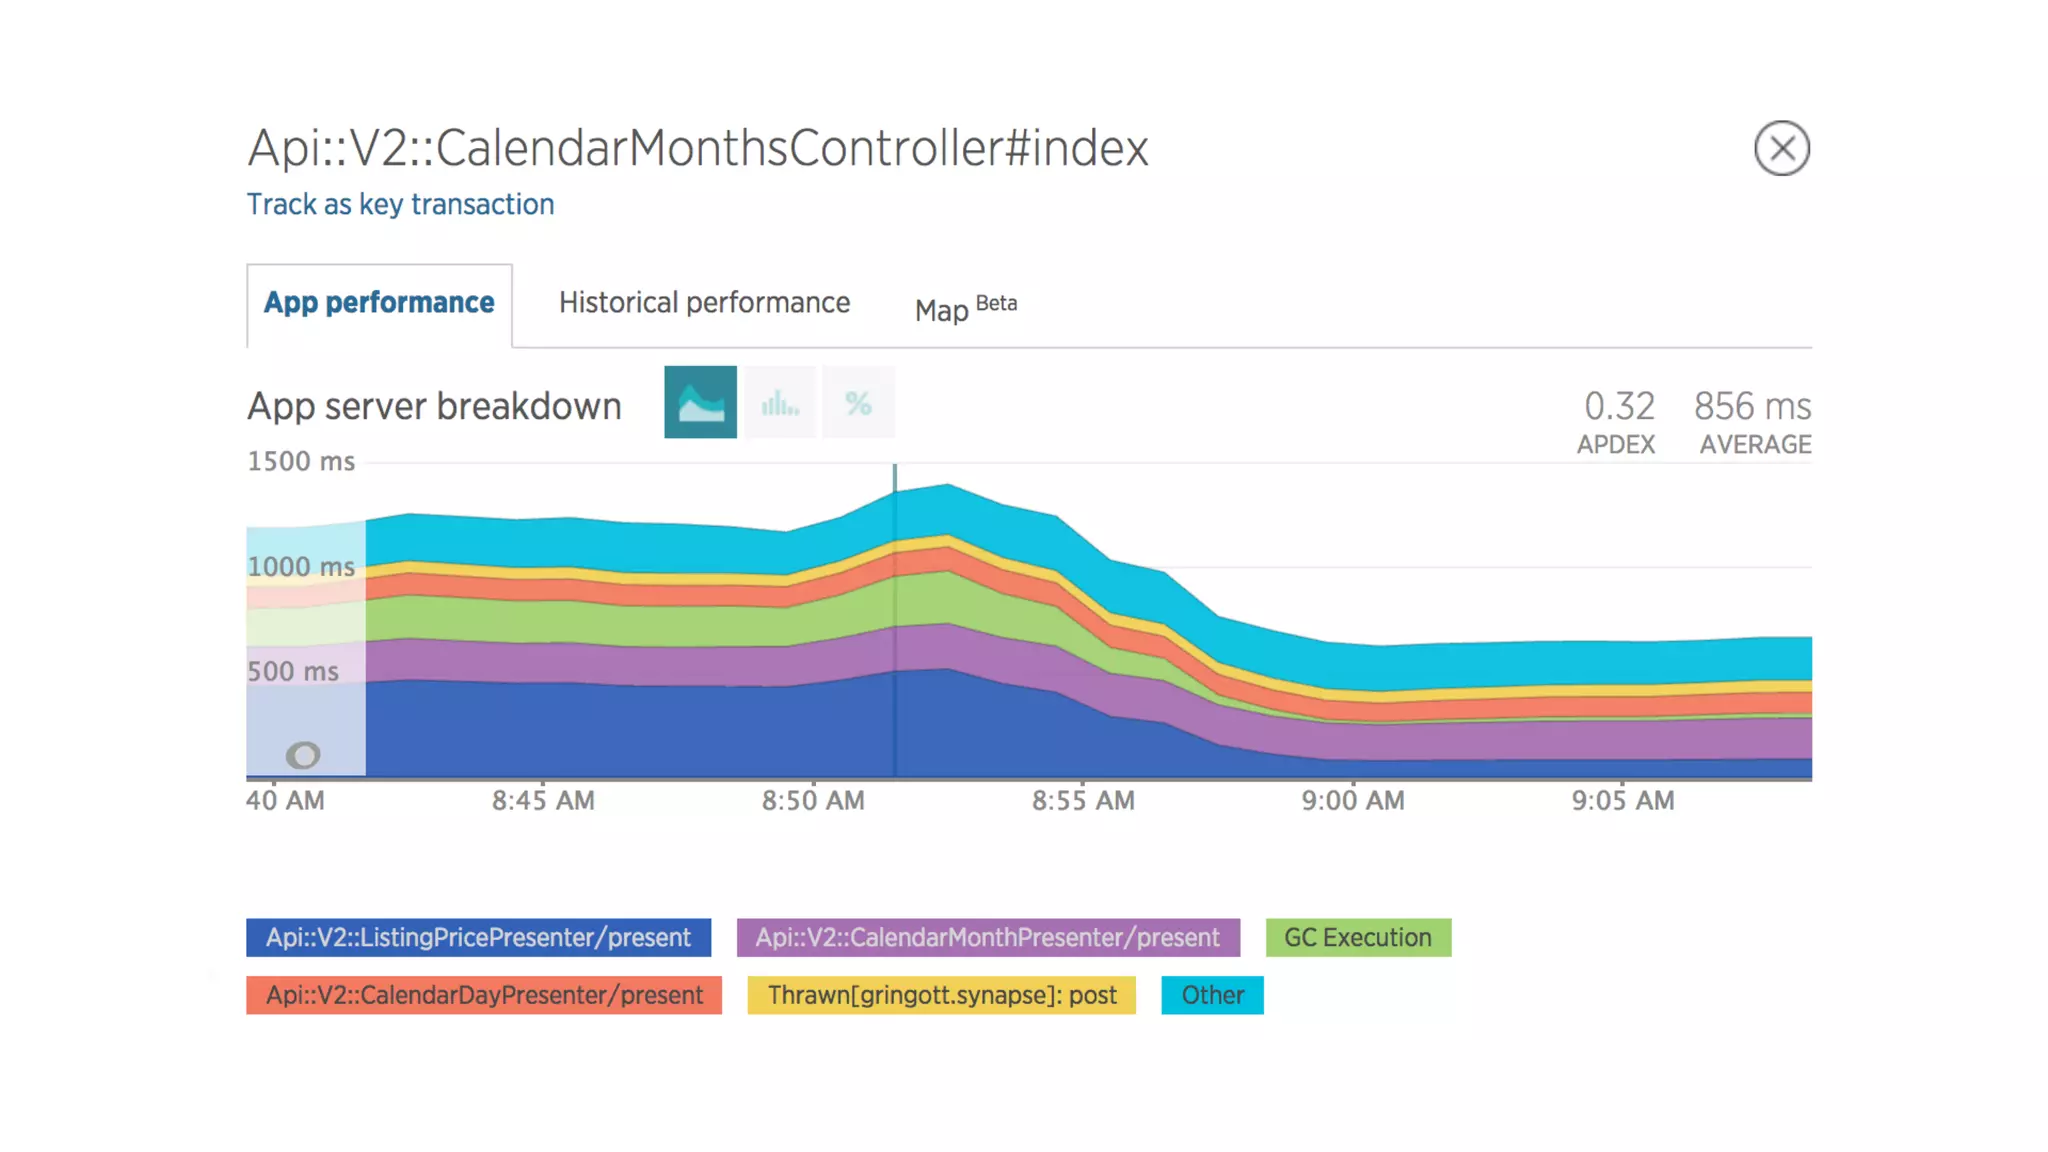


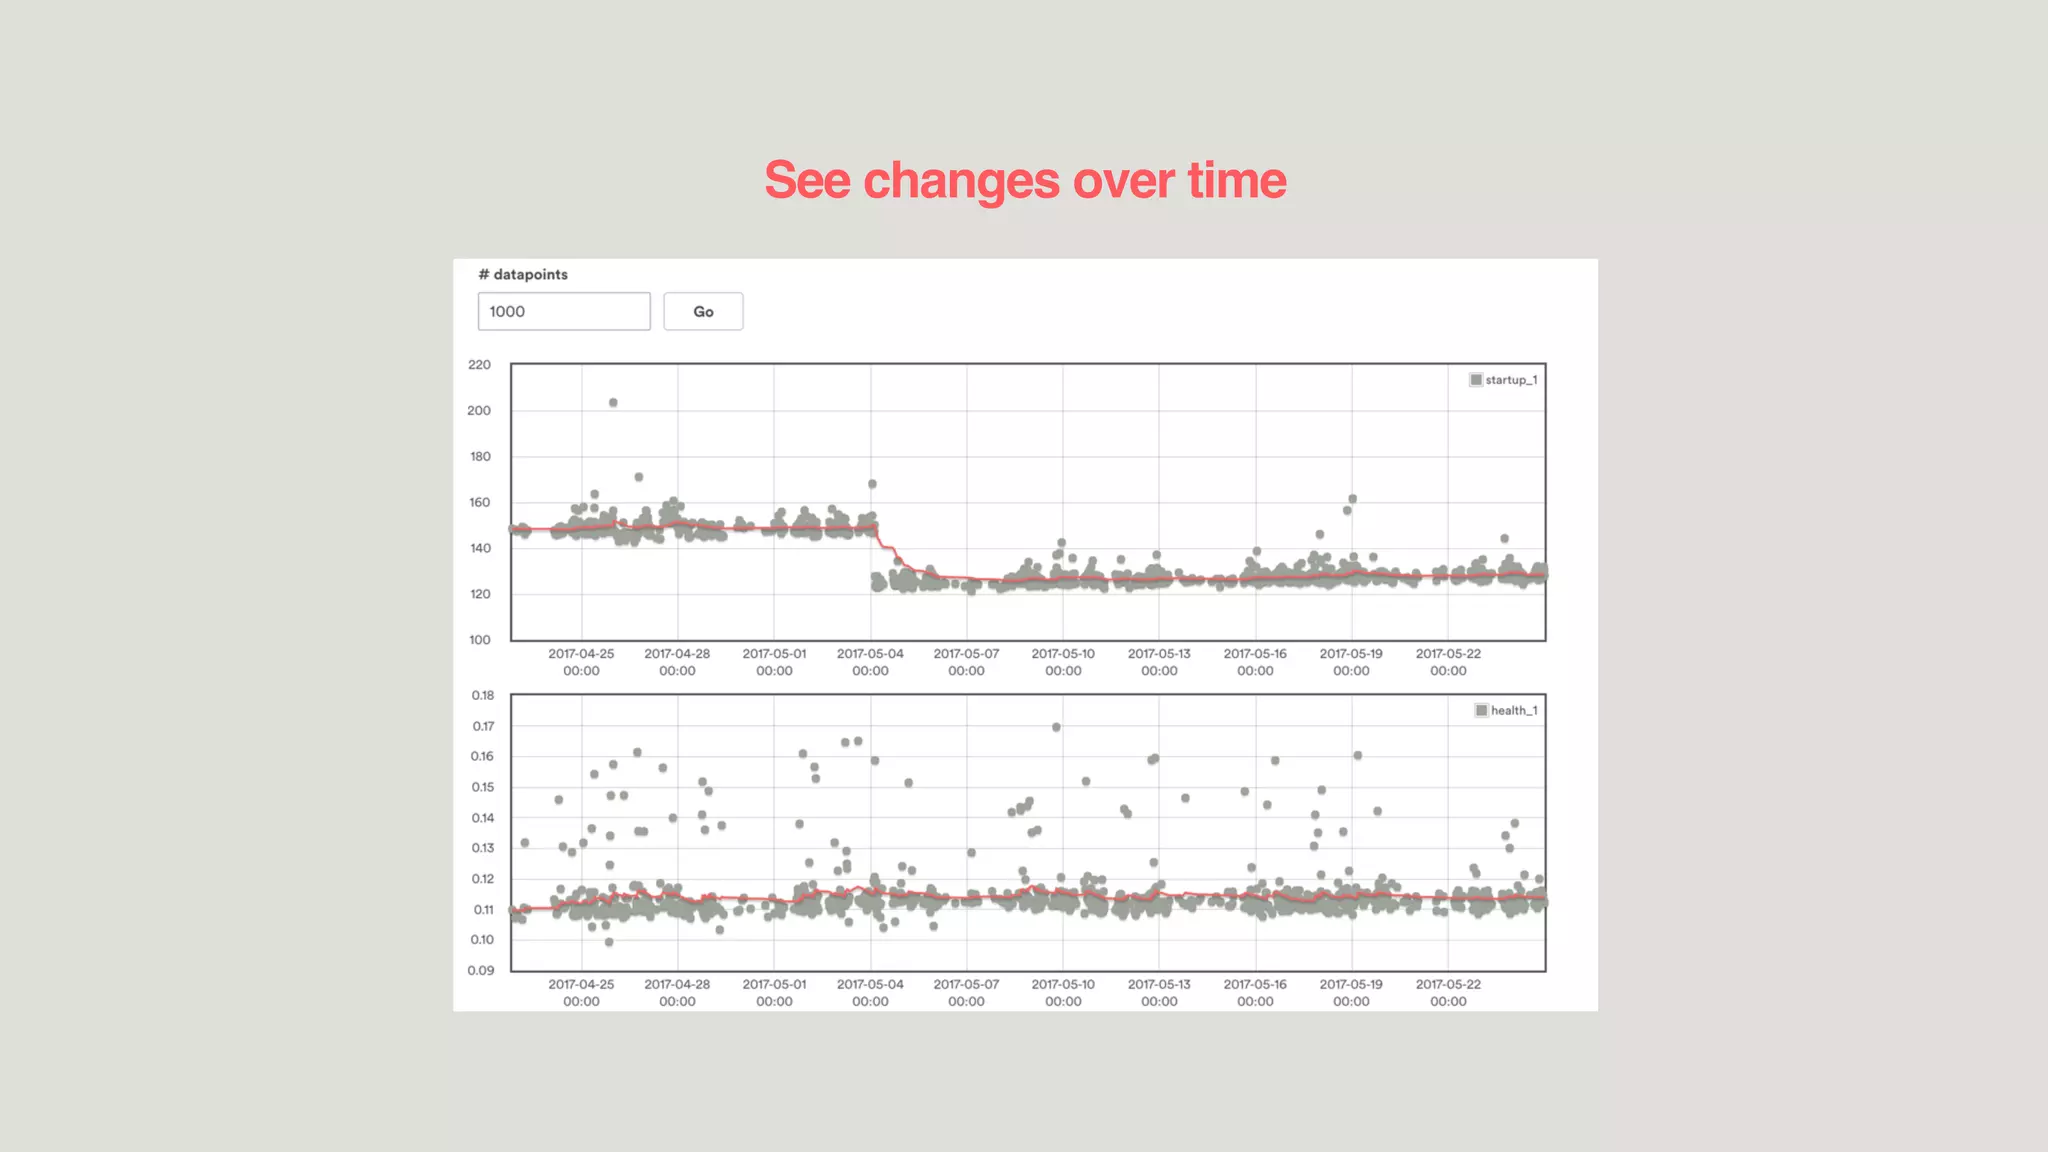
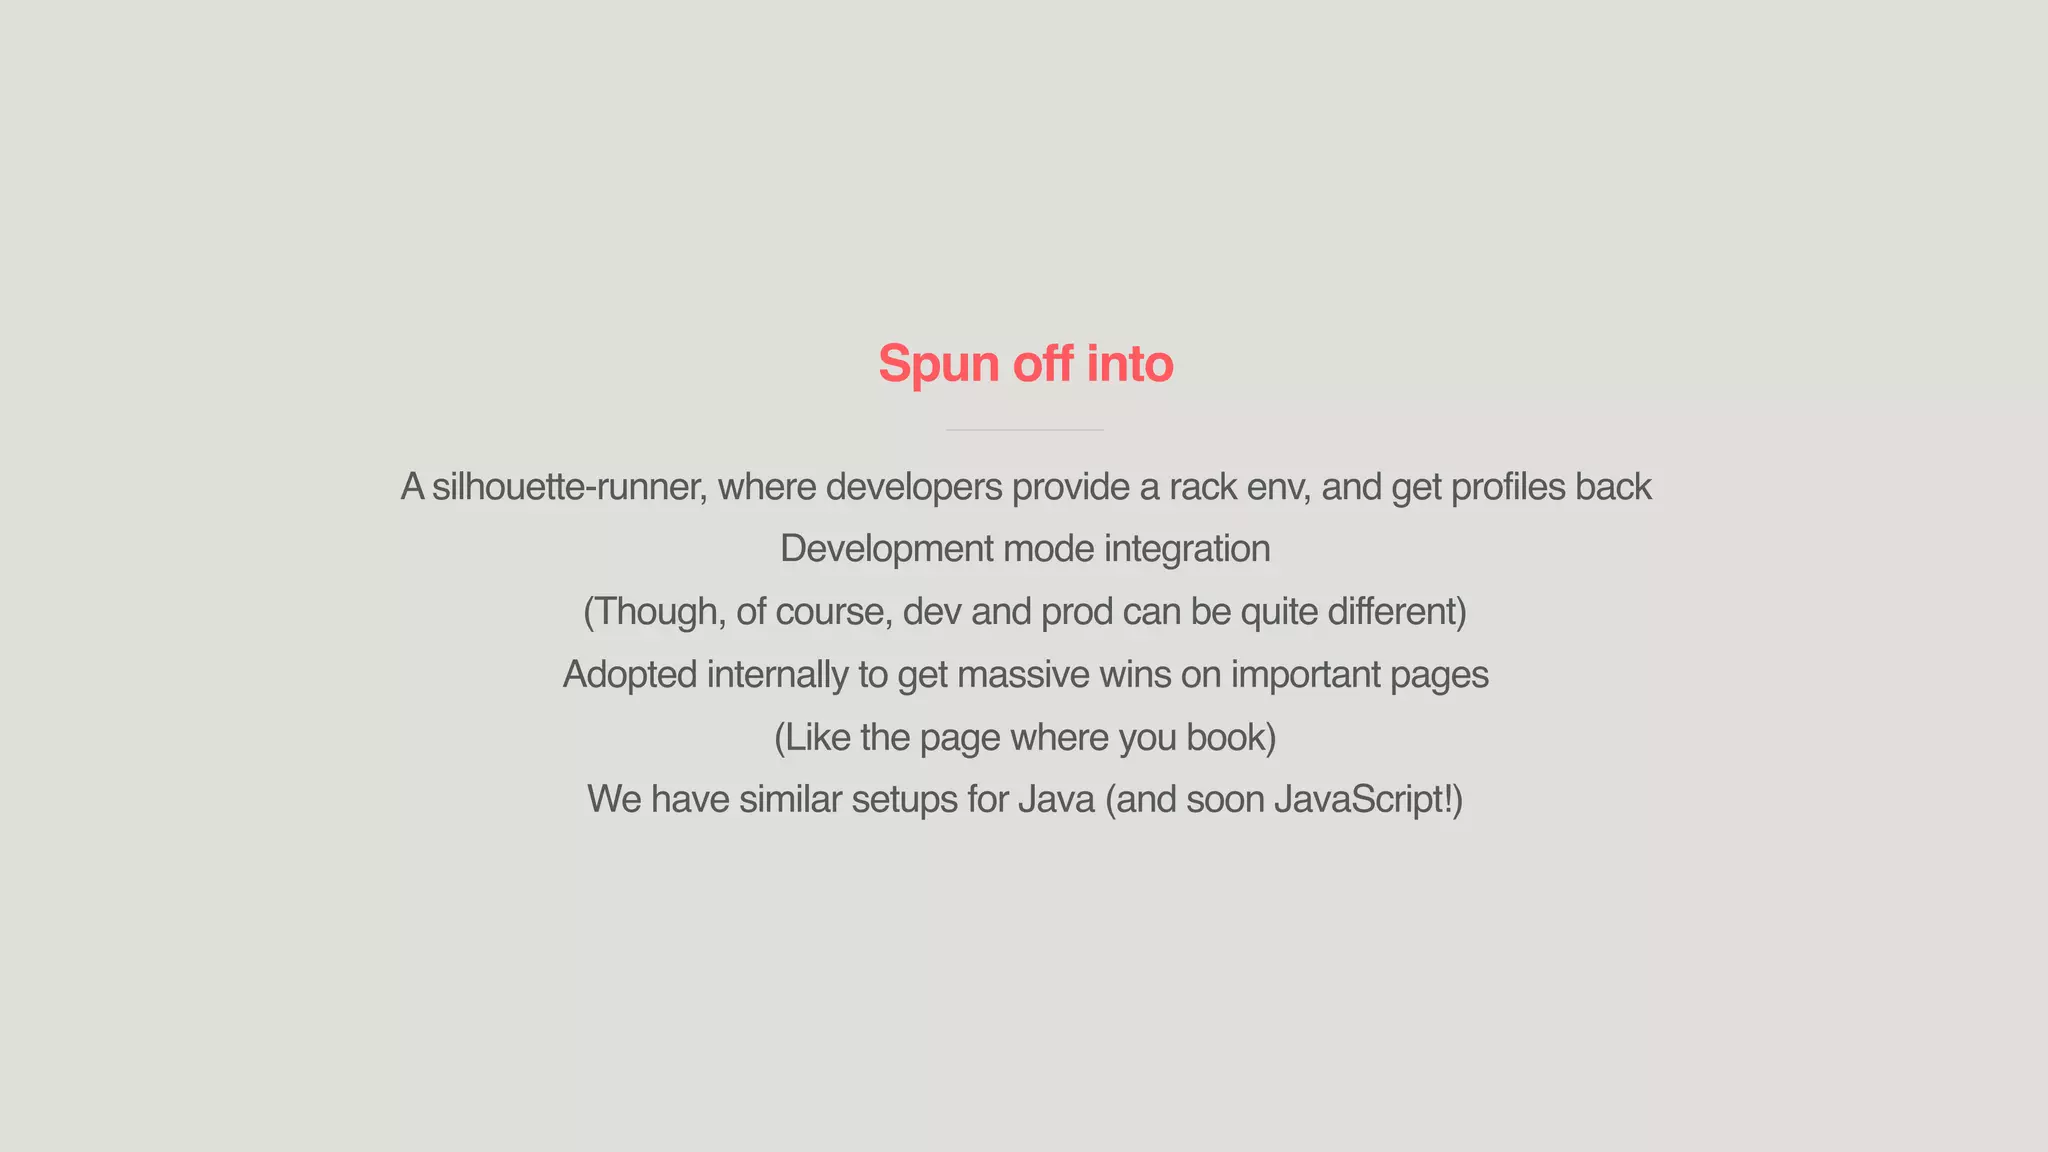


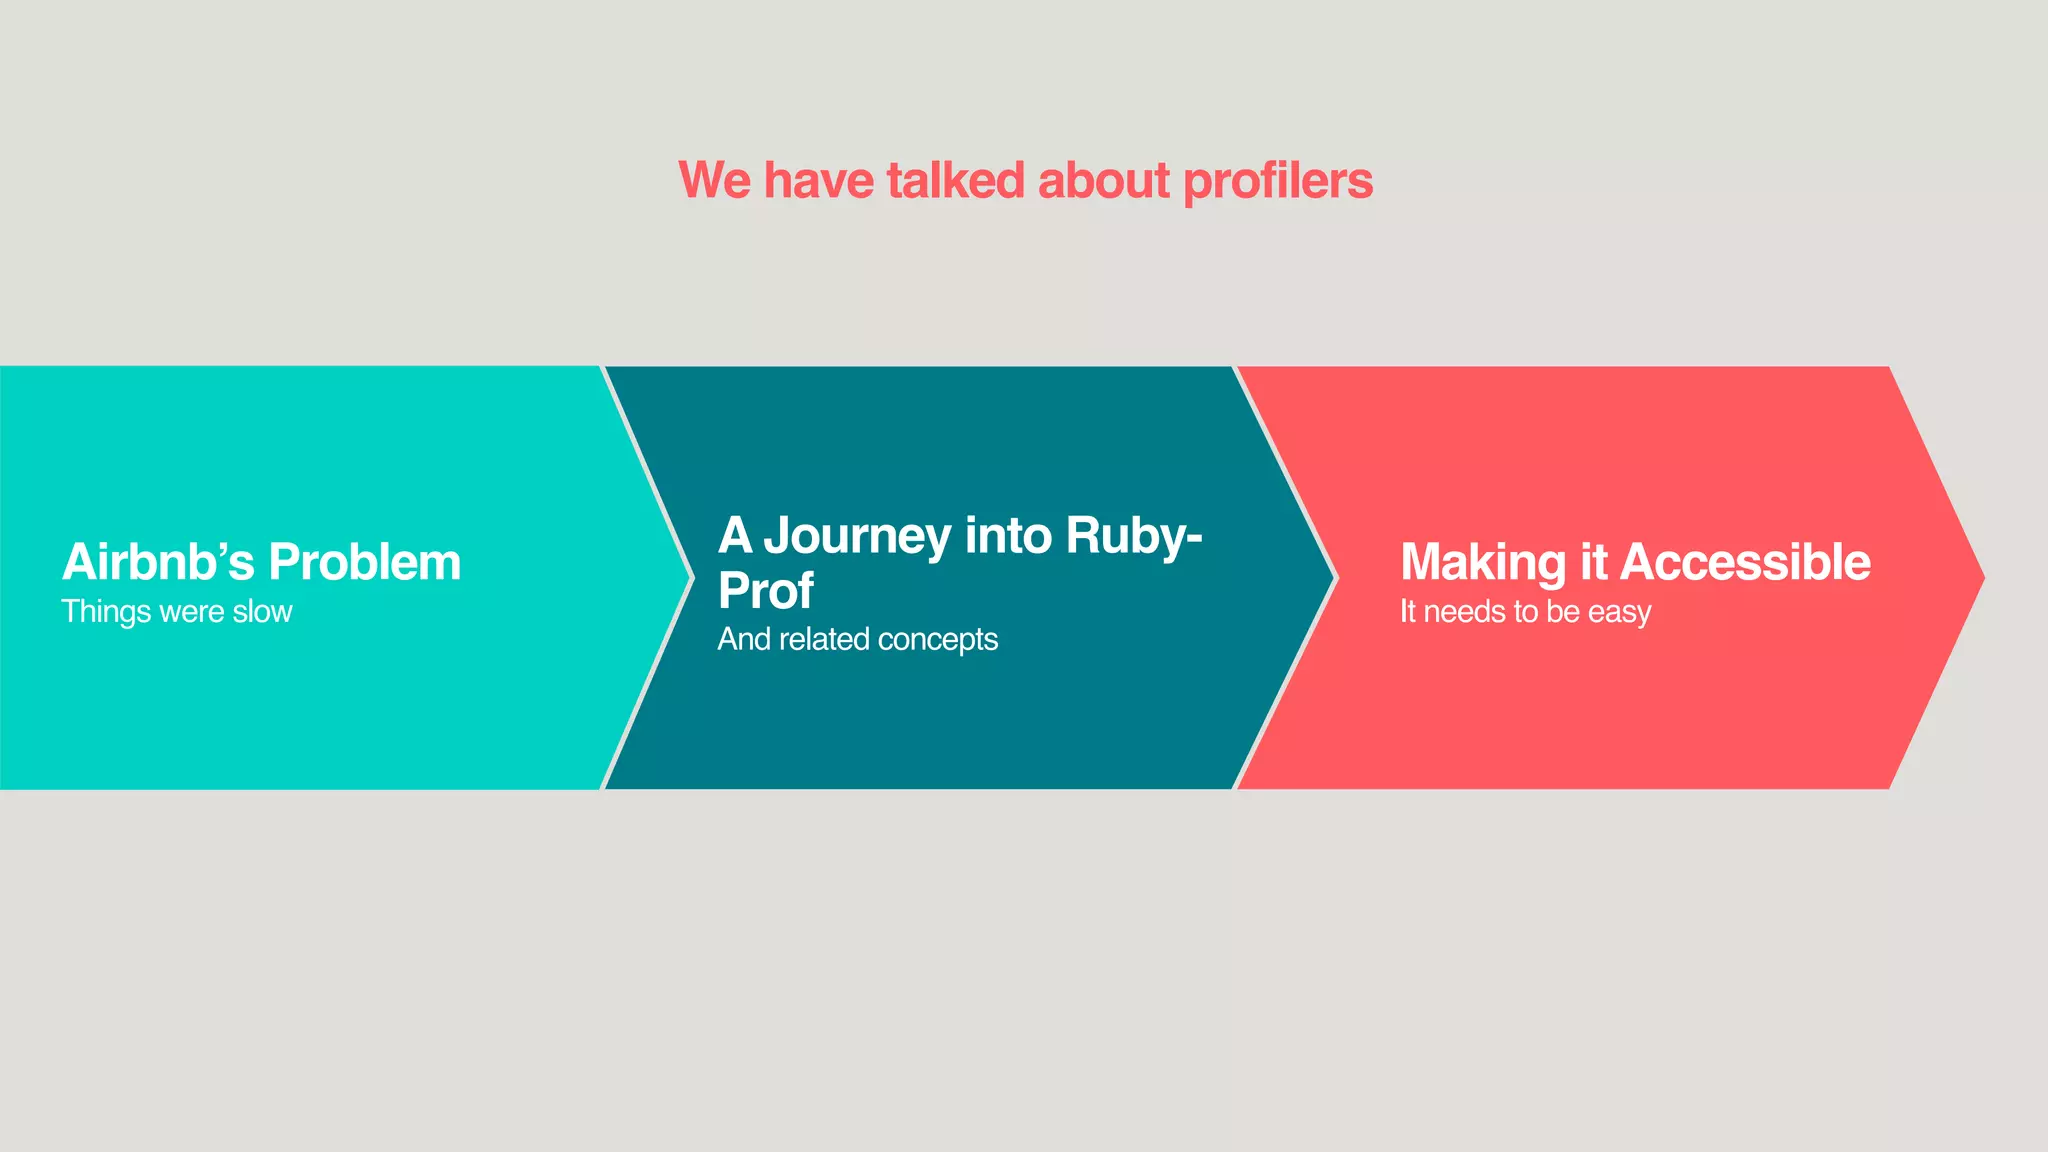


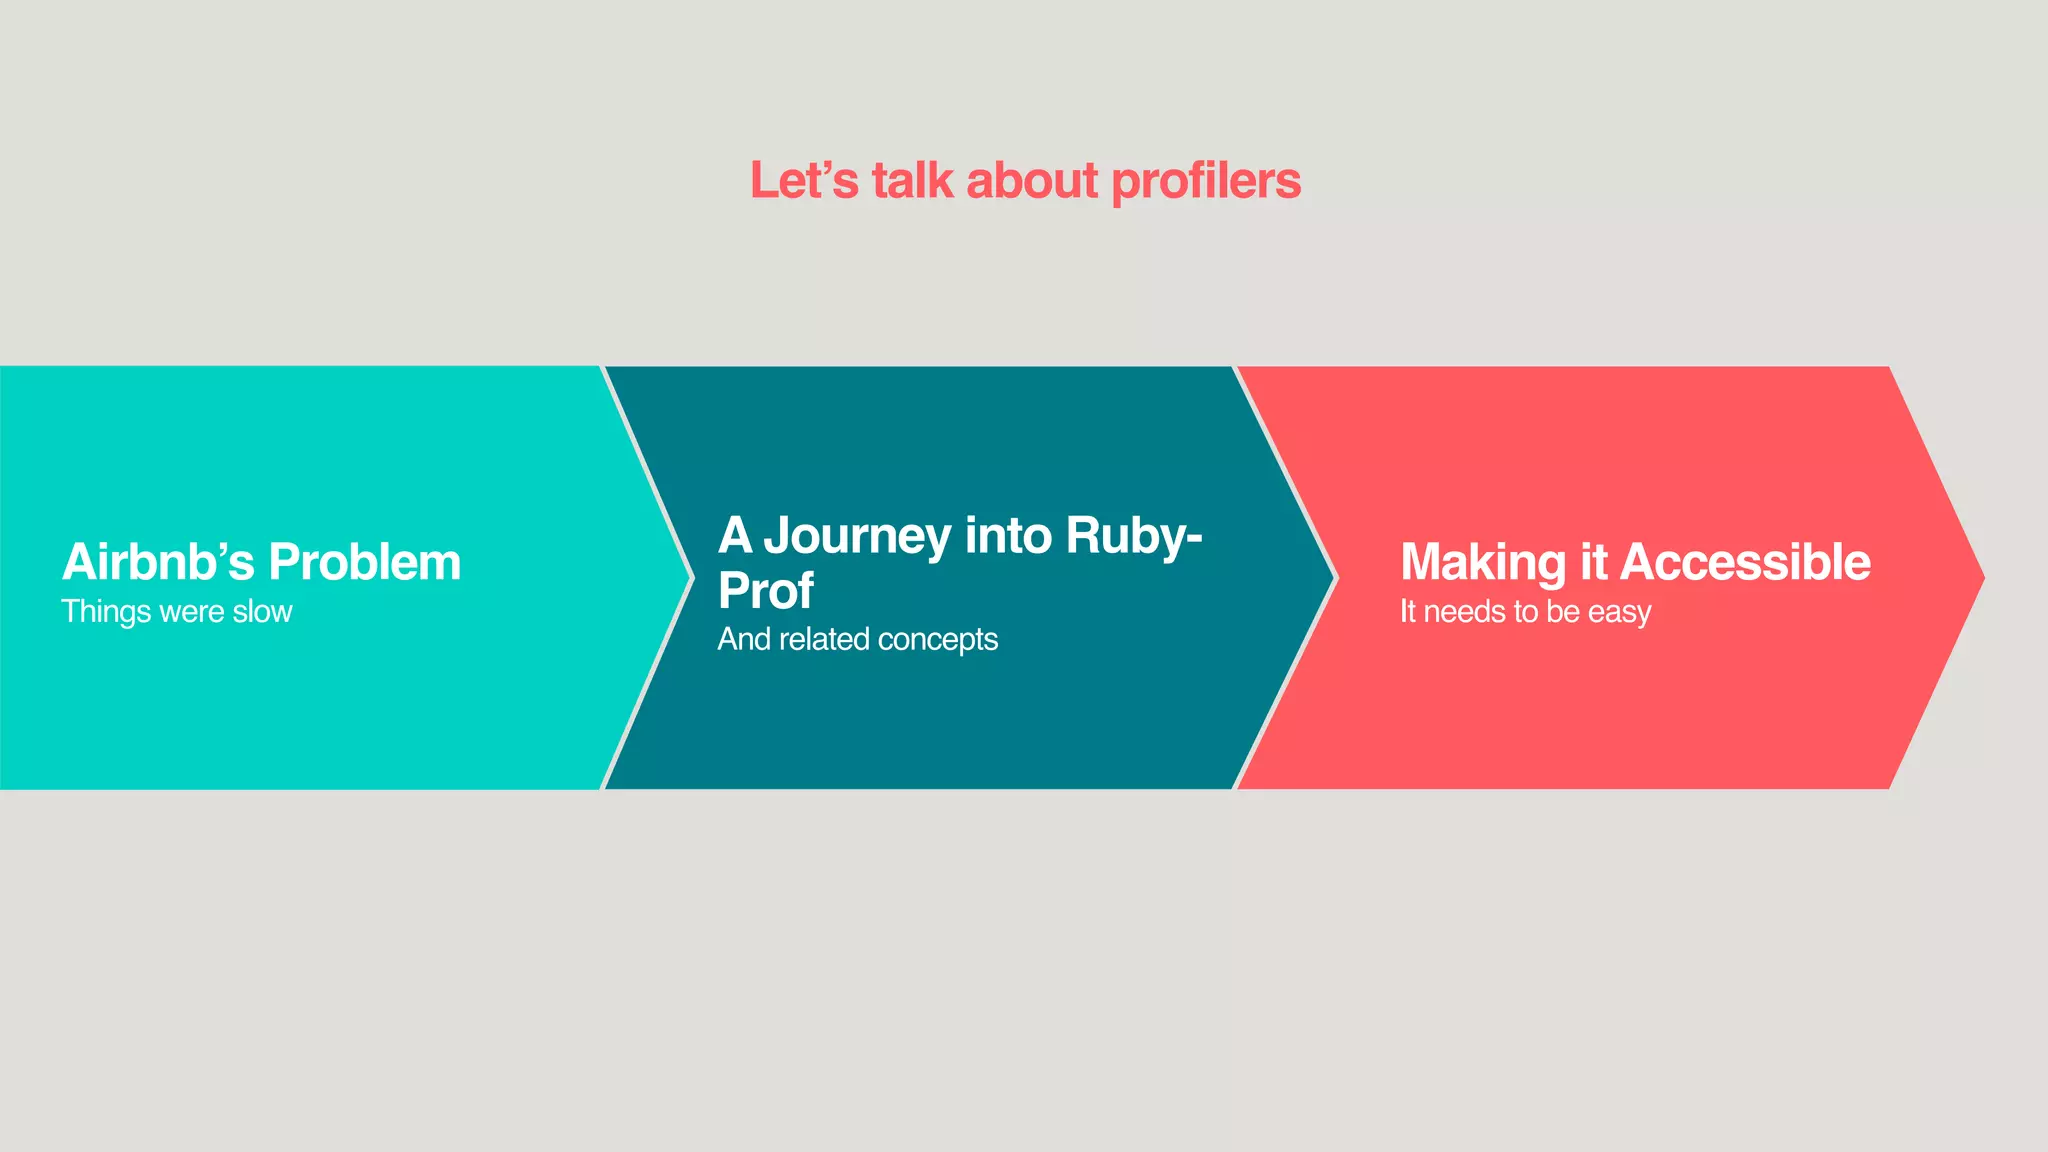
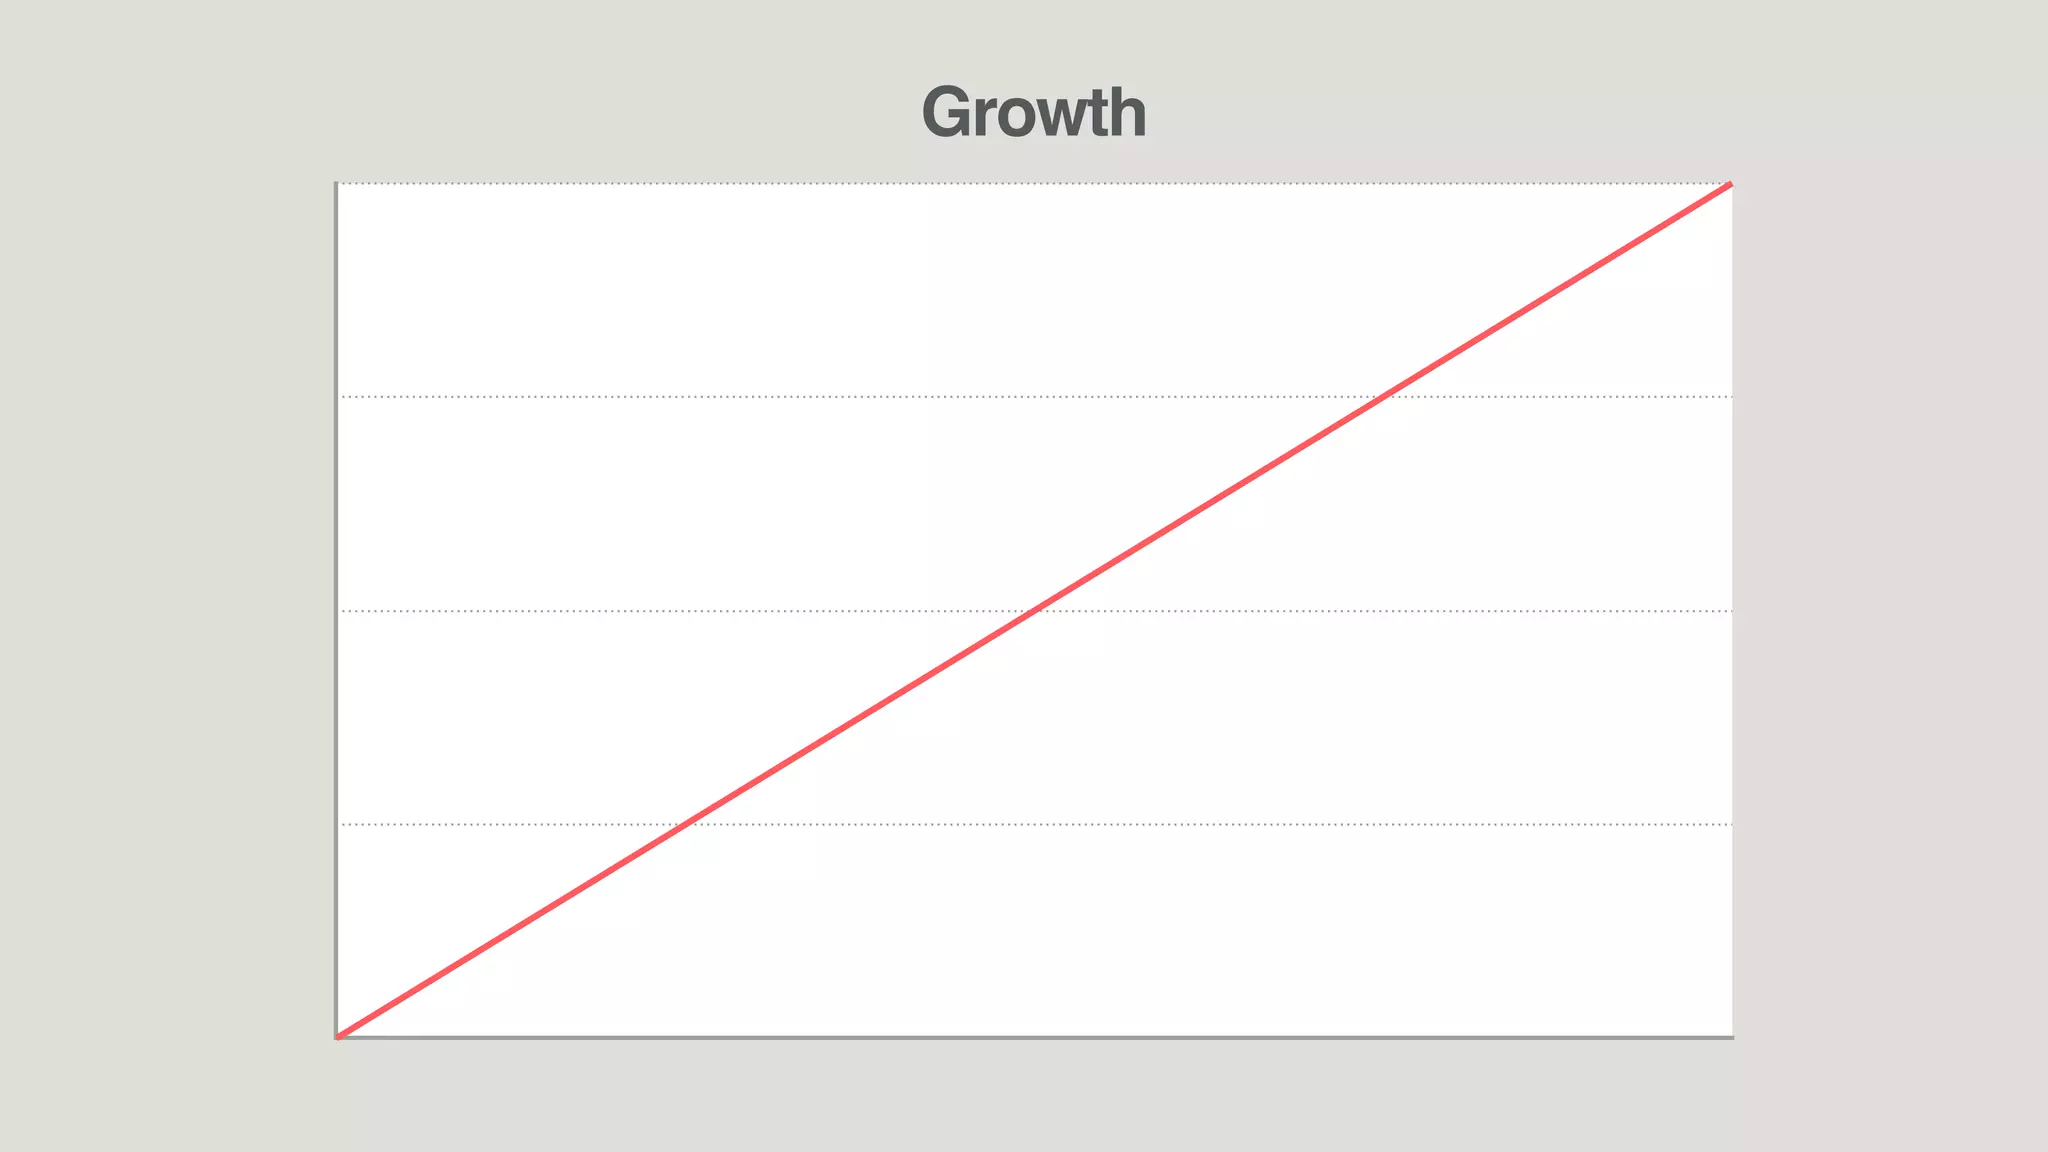
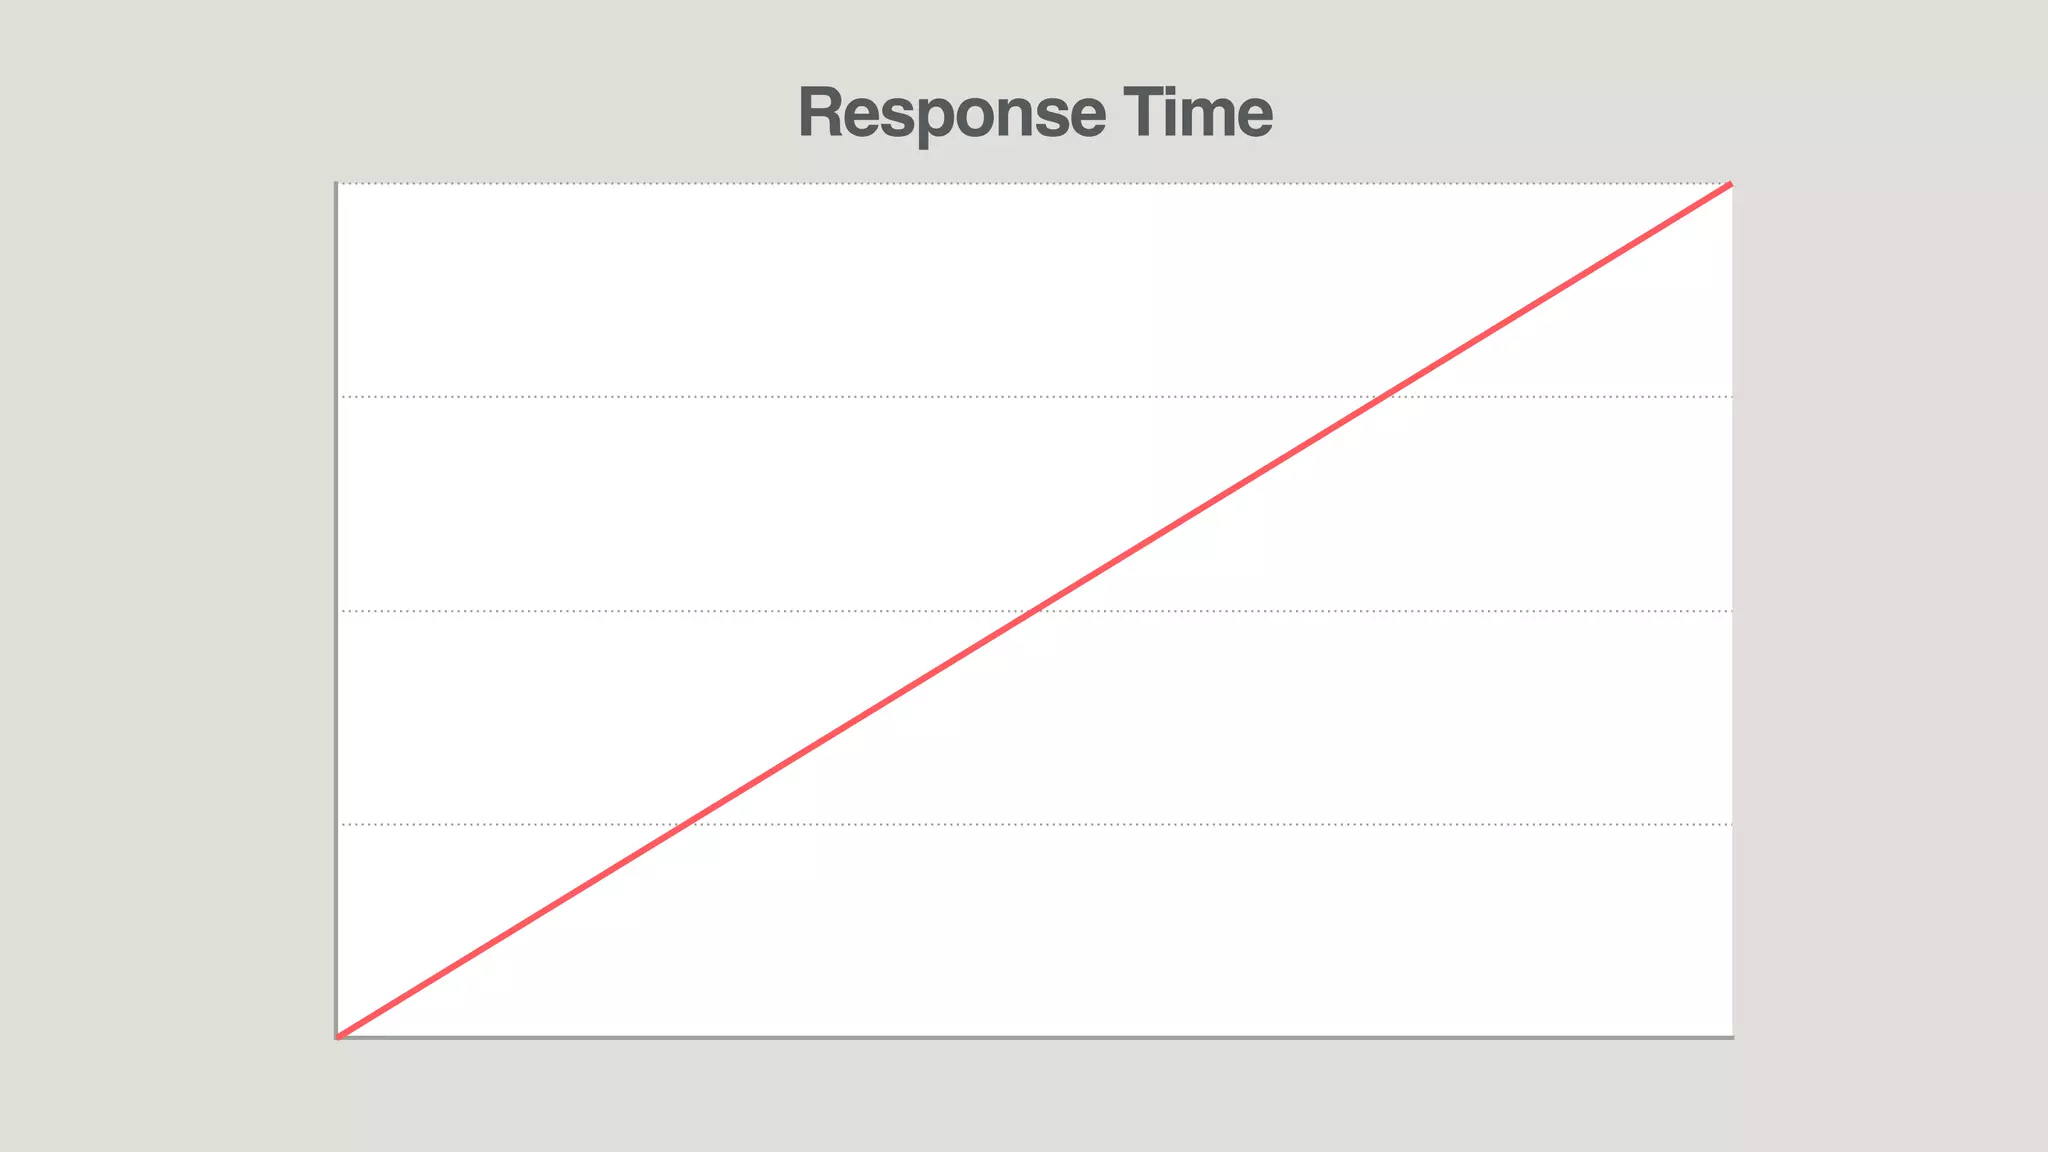
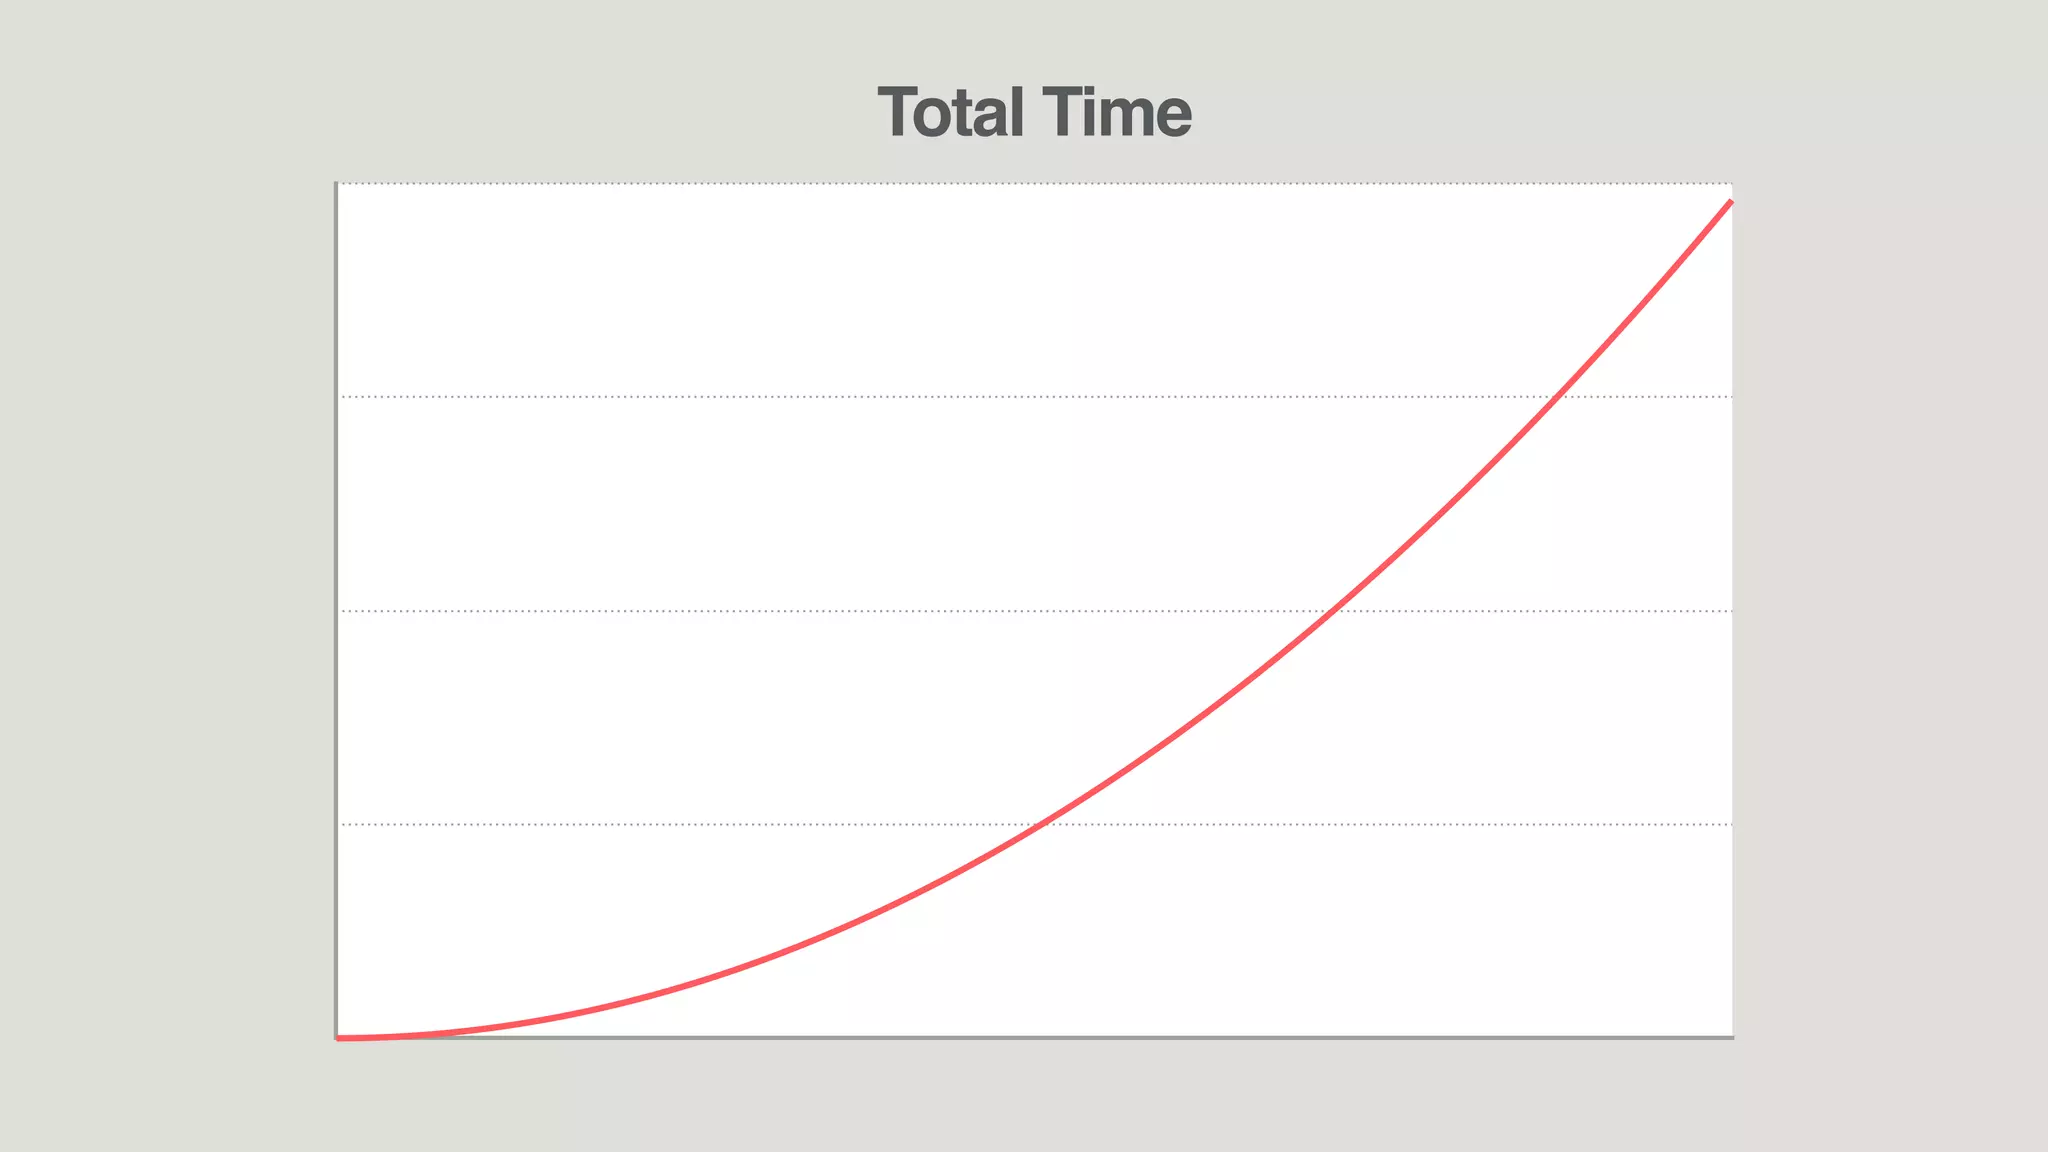
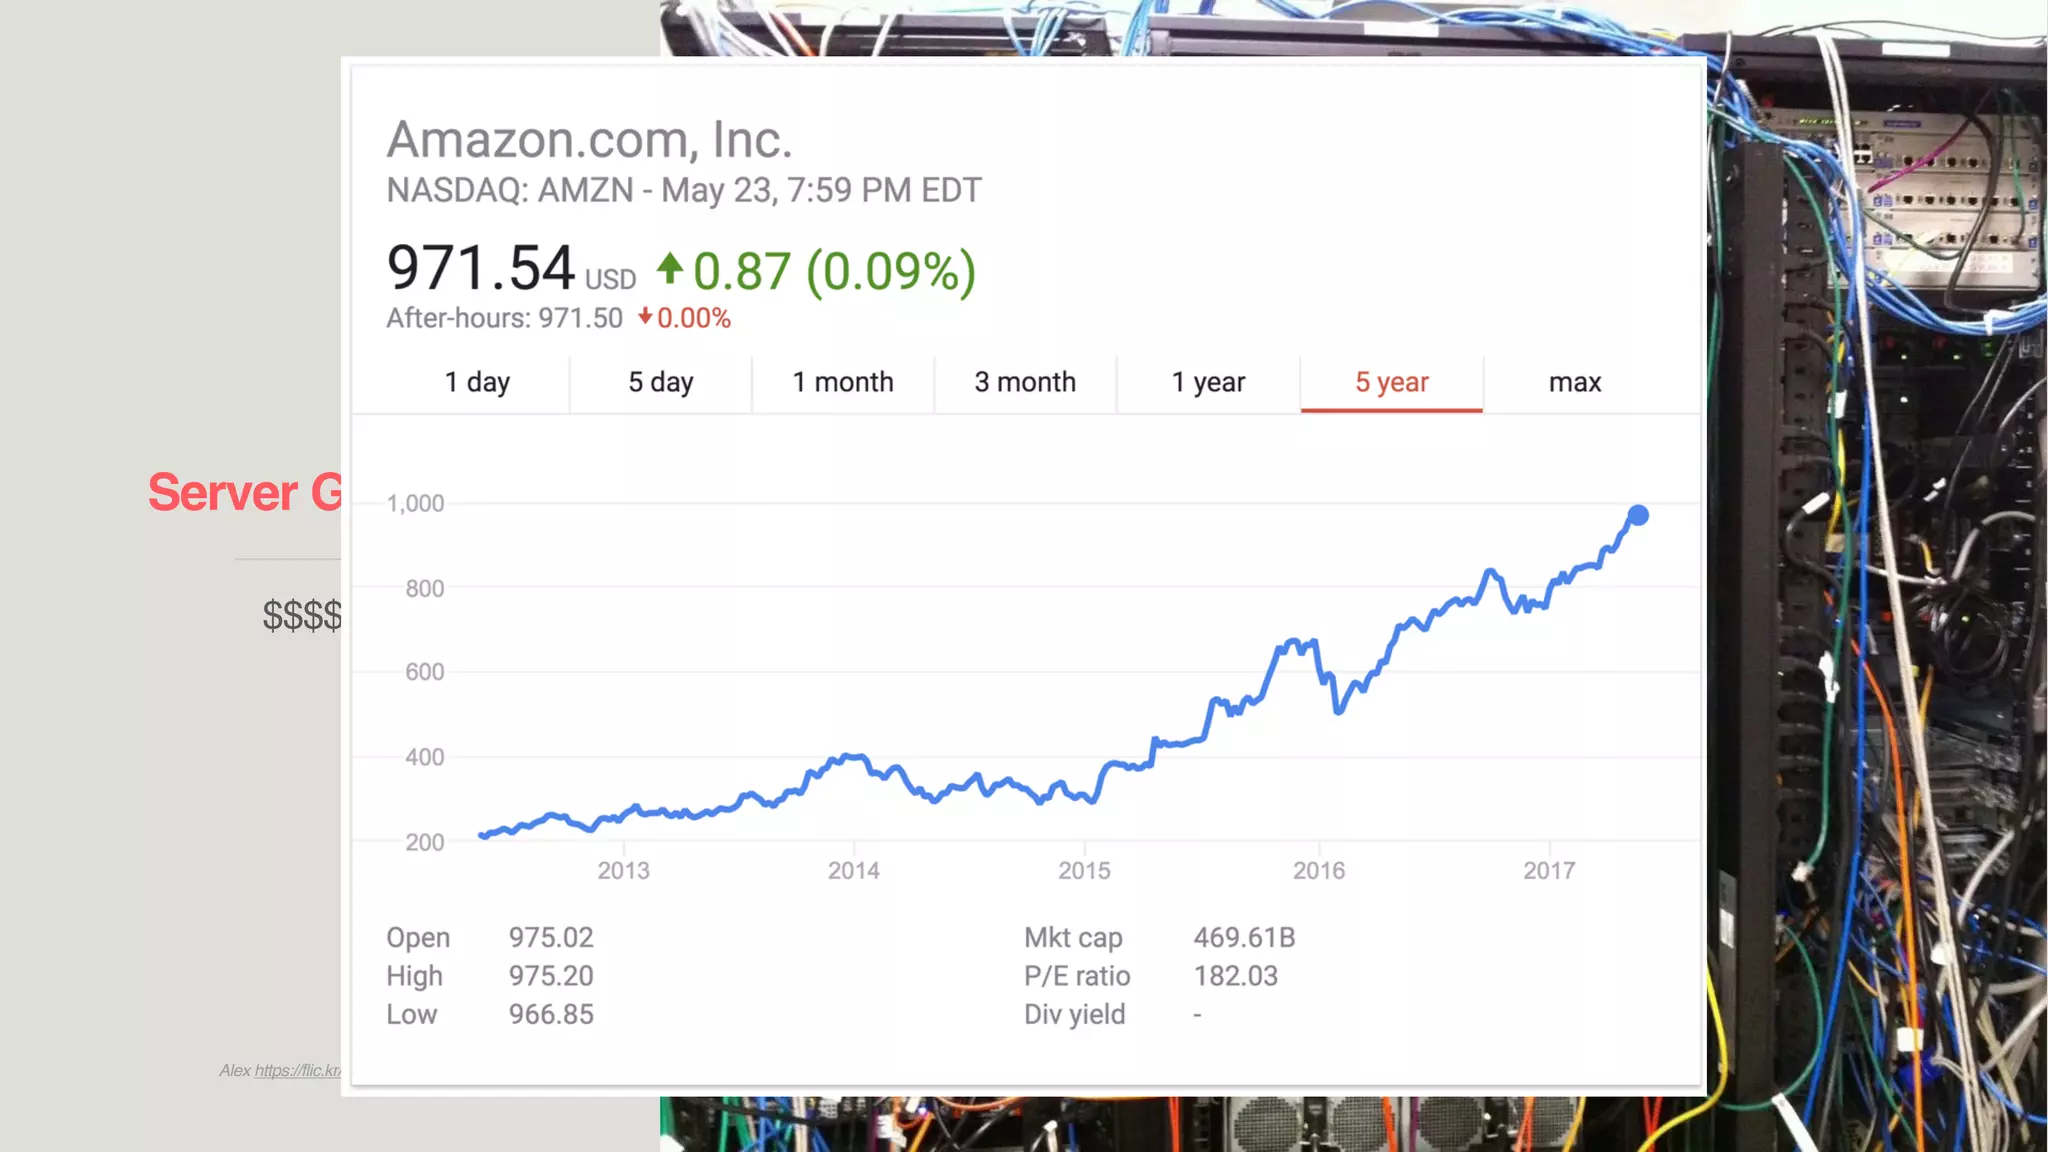
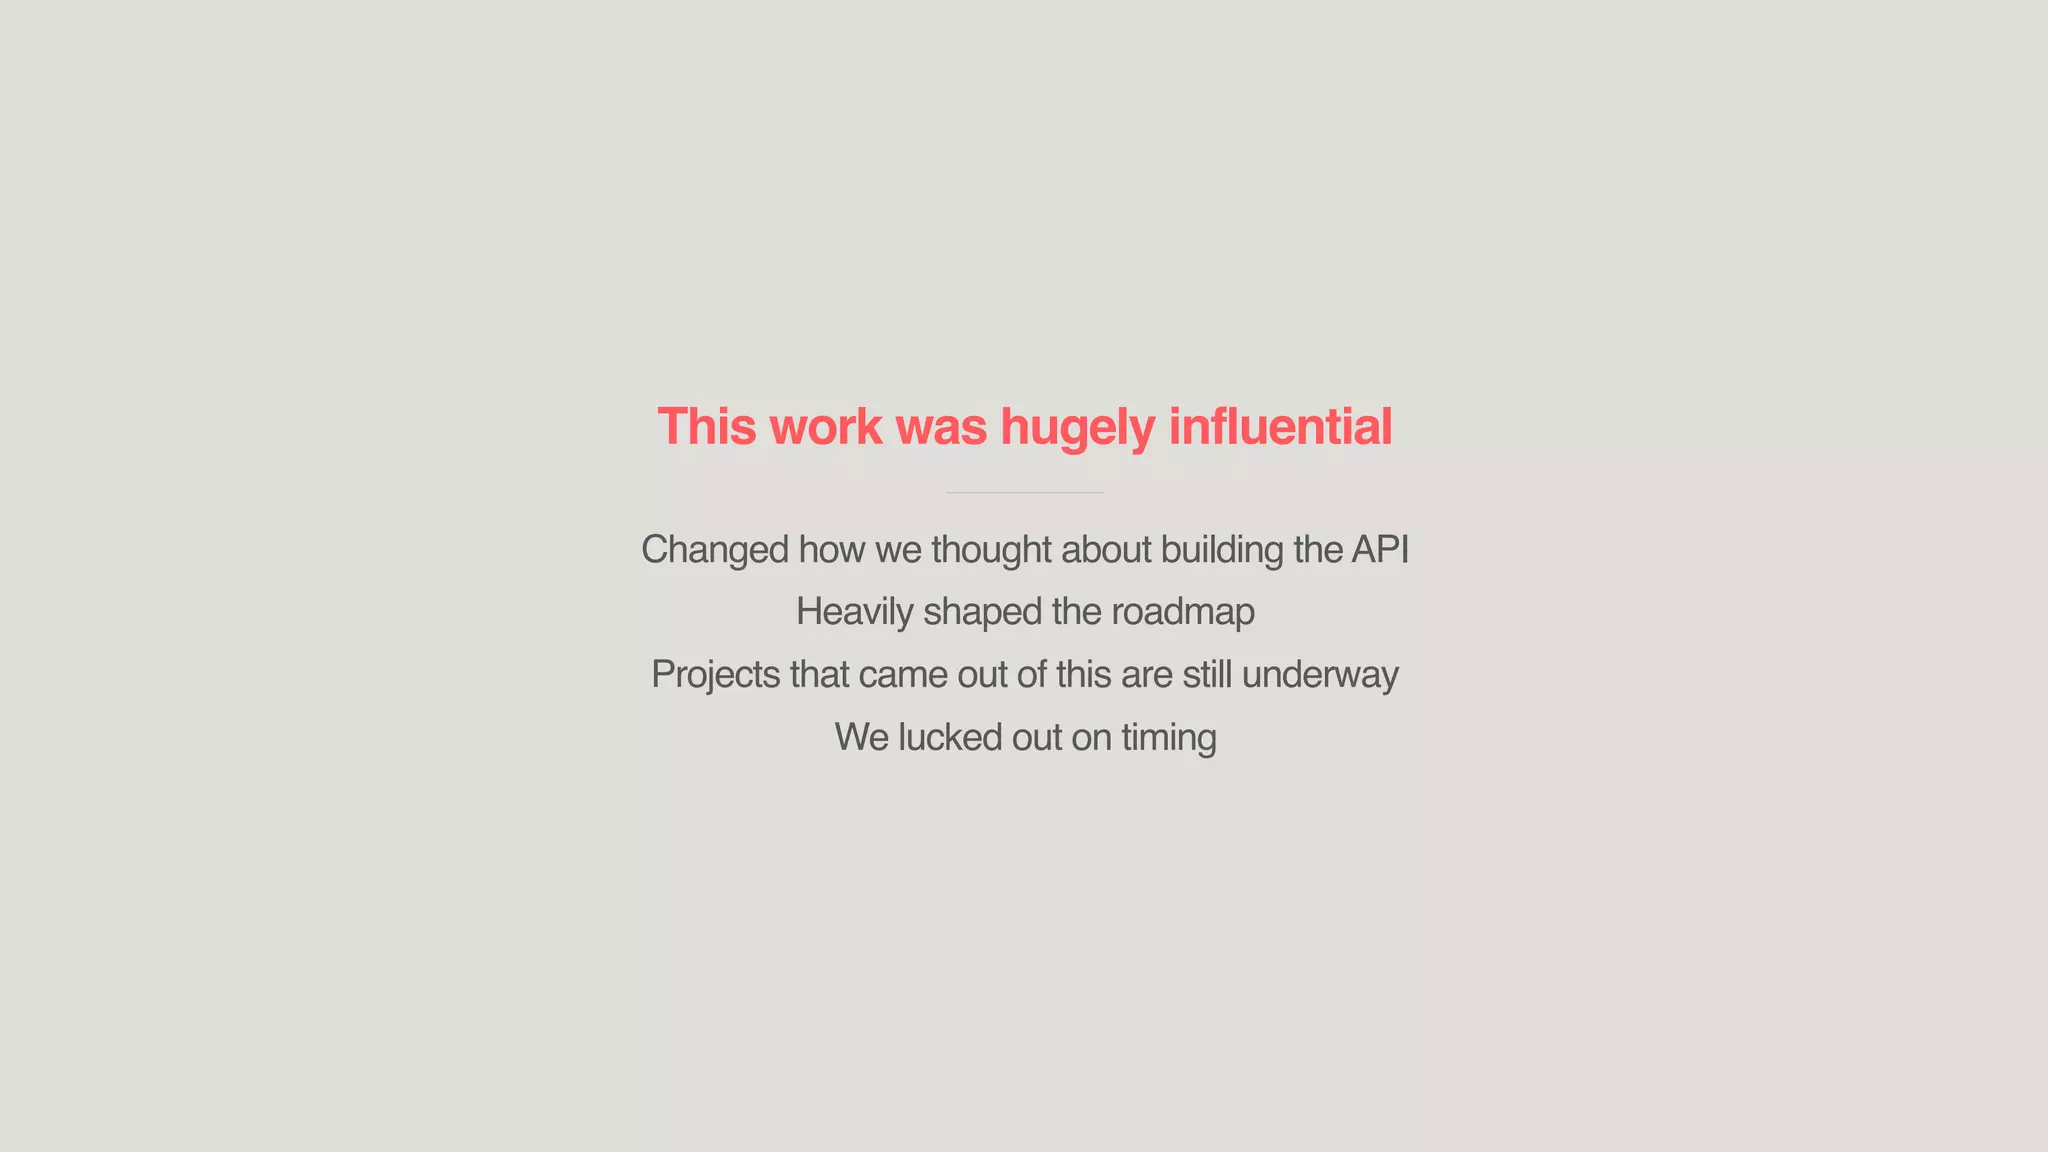
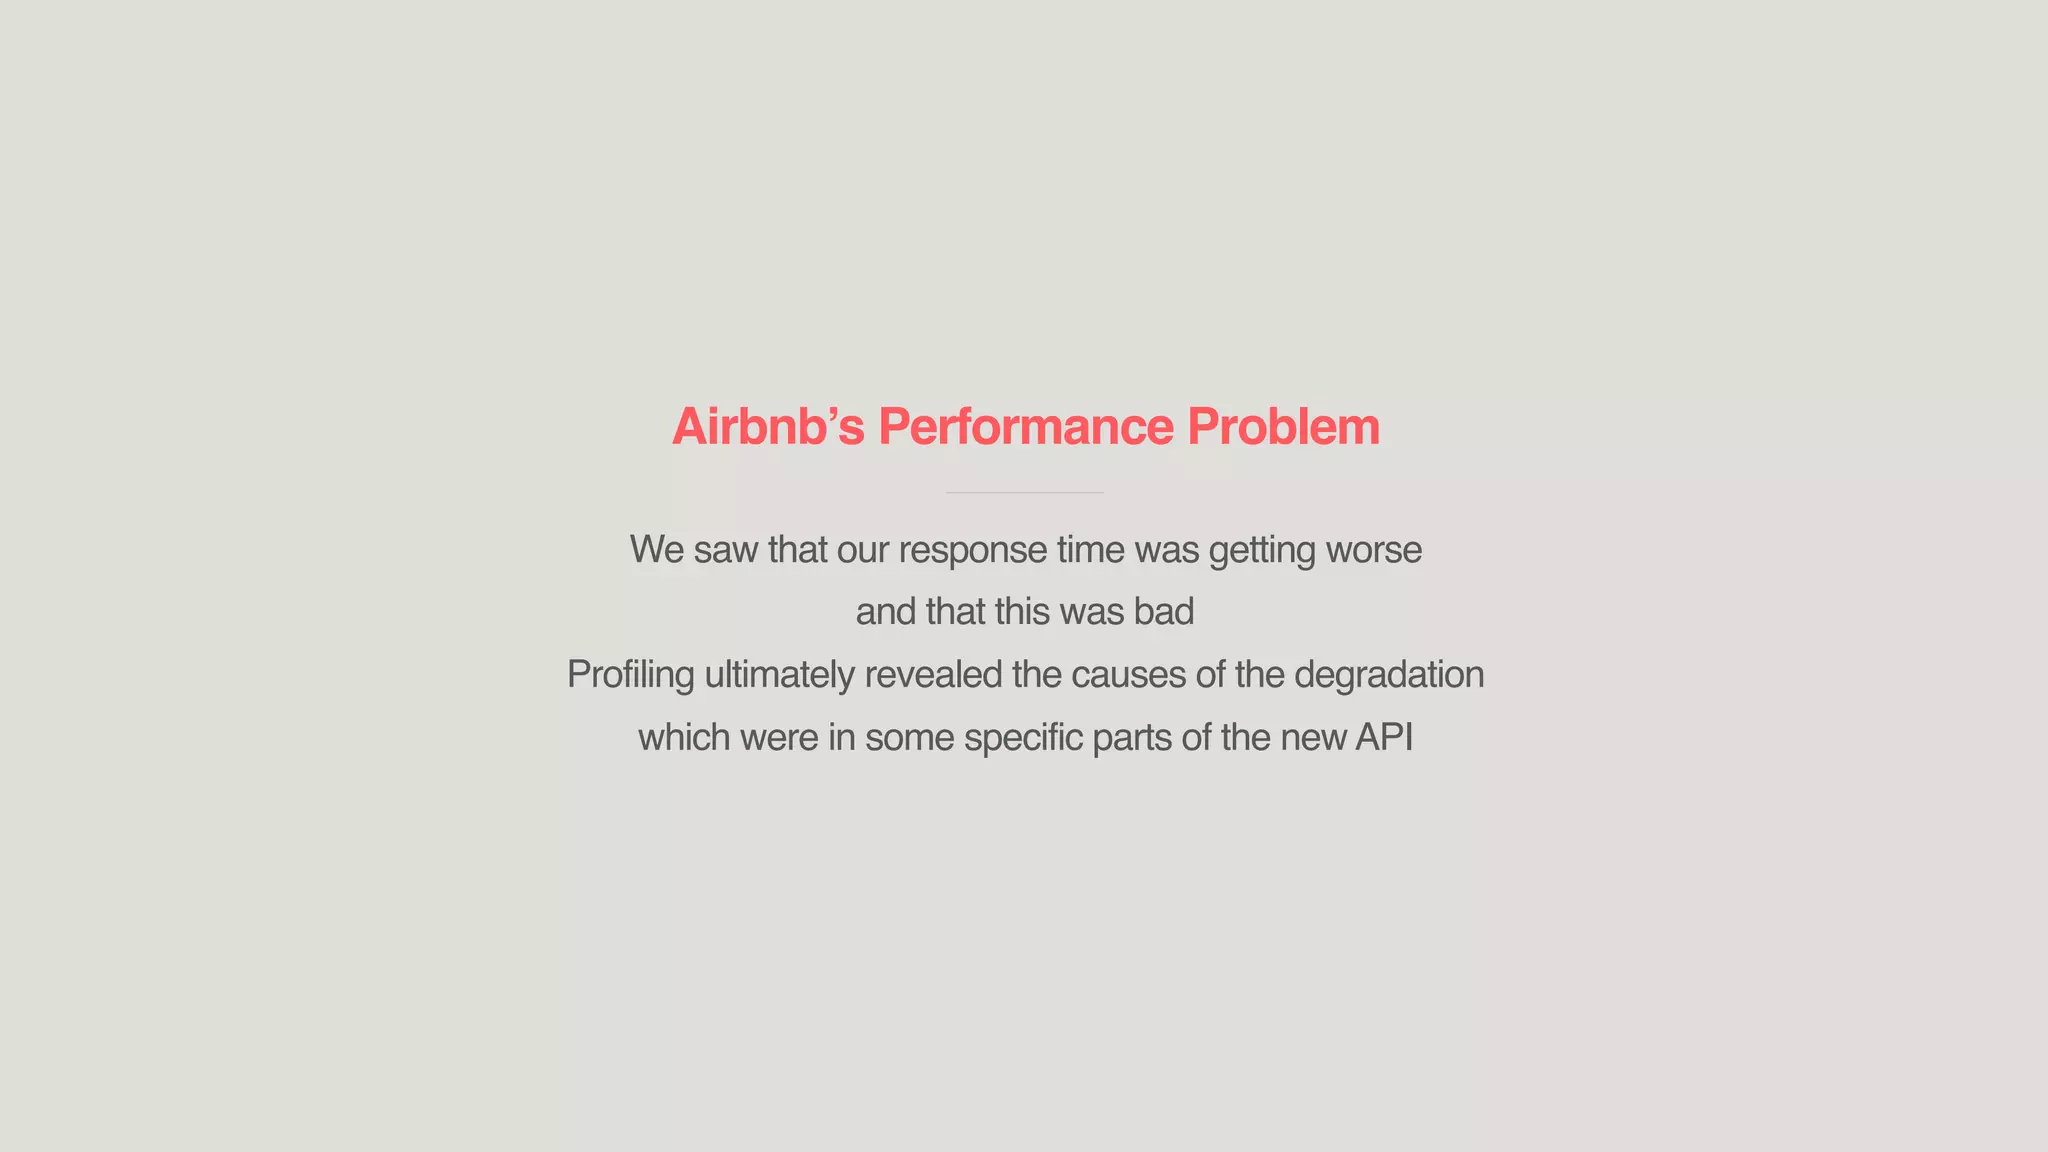
The document discusses Airbnb's performance challenges due to slow response times, highlighting the importance of profilers for addressing these issues. Ben Hughes explains the evolution of their approach to profiling using ruby-prof, a tracing profiler that helped identify specific slow areas within their API. The talk emphasizes making performance tools accessible to developers and illustrates methods for improving response times and overall user experience.