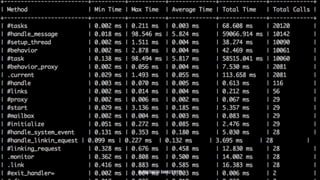
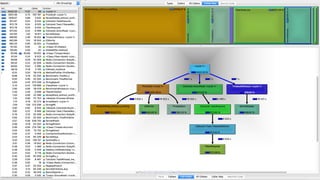
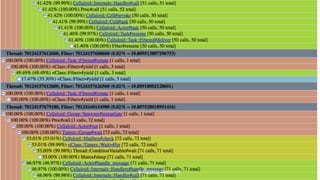
PERFORMANCE
OPTIMIZATION IN RUBYPRATHMESH RANAUT
© Prathmesh Ranaut, 2017
☃ -> "
© Prathmesh Ranaut, 2017
WHO AM I
> Computer Science Undergrad
> Helped ! of ruby apps improve
performance
© Prathmesh Ranaut, 2017
> Celluloid - Concurrent ruby framework
> Improved performance by 300%
© Prathmesh Ranaut, 2017
WHAT IS PERFORMANCE
OPTIMIZATION? !
© Prathmesh Ranaut, 2017
DOING
MOREWITH
LESS
© Prathmesh Ranaut, 2017
HOW?
© Prathmesh Ranaut, 2017
TIP #1
© Prathmesh Ranaut, 2017
ALWAYS HAVE A BENCHMARKING SUITE
© Prathmesh Ranaut, 2017
BECHMARK-IPS
© Prathmesh Ranaut, 2017
require "benchmark/ips"
Benchmark.ips do |ips|
ips.report("addition") { 1 + 2 }
end
© Prathmesh Ranaut, 2017
require "benchmark/ips"
Benchmark.ips do |ips|
ips.report("addition") { 1 + 2 }
end
Warming up --------------------------------------
addition 325.015k i/100ms
Calculating -------------------------------------
addition 12.544M (± 8.5%) i/s - 62.403M in 5.012765s
© Prathmesh Ranaut, 2017
class Worker
include Celluloid
def hashed(hash, key)
hash[key]
end
end
# Worker pool of different sizes
pool_10 = Worker.pool(size: 10)
pool_100 = Worker.pool(size: 100)
hash = {}
ENTRIES = 10_000
TESTS = 100_000
# Using a constant key, to derive consistent benchmarking results
KEY = 500
# Populate hash array
ENTRIES.times do |i|
hash[i] = i
end
Benchmark.bmbm do |ips|
puts "Finding the key : #{KEY}"
ips.report("pool - 10") do
TESTS.times do
pool_10.async.hashed(hash, KEY)
end
end
ips.report("pool - 100") do
TESTS.times do
pool_100.async.hashed(hash, KEY)
end
end
end
© Prathmesh Ranaut, 2017
TIP #2
© Prathmesh Ranaut, 2017
UPGRADE RUBY
© Prathmesh Ranaut, 2017
RUBY 1.9
> YARV
© Prathmesh Ranaut, 2017
RUBY 1.9
> YARV
RUBY 2.0
> Copy-on-Write
© Prathmesh Ranaut, 2017
RUBY 2.1
> Generation GC
RUBY 2.4
> Improves the speed to access an instance variable
© Prathmesh Ranaut, 2017
TIP #3
© Prathmesh Ranaut, 2017
TRY ANOTHER IMPLEMENTATION OF
RUBY
© Prathmesh Ranaut, 2017
RUBY 2.3 VS JRUBY
RUBY 2.3
Calculating -------------------------------------
addition 12.544M (± 8.5%) i/s - 62.403M
JRUBY
Calculating -------------------------------------
addition 22.929M (± 9.3%) i/s - 113.127M
© Prathmesh Ranaut, 2017
TIP #4
© Prathmesh Ranaut, 2017
PROFILE YOUR METHODS
© Prathmesh Ranaut, 2017
TIP #5
© Prathmesh Ranaut, 2017
FIGURE OUT THE BOTTLENECK
I/O OR CPU OR MEMORY
© Prathmesh Ranaut, 2017
TIP #6
© Prathmesh Ranaut, 2017
SWITCH TO ELIXIR
© Prathmesh Ranaut, 2017
TRY MULTITHREADING
© Prathmesh Ranaut, 2017
TOOLS
THAT MAKE MY LIFE EASIER
© Prathmesh Ranaut, 2017
METHOD PROFILER
HTTPS://GITHUB.COM/CHANGE/METHOD_PROFILER
© Prathmesh Ranaut, 2017
profiler = MethodProfiler.observe(BazingaClass)
# Do stuff with the BazingaClass
puts profiler.report
© Prathmesh Ranaut, 2017
KCACHEGRIND
HTTPS://KCACHEGRIND.GITHUB.IO/
© Prathmesh Ranaut, 2017
RUBYPROF
HTTPS://GITHUB.COM/RUBY-PROF/RUBY-PROF
© Prathmesh Ranaut, 2017
require 'ruby-prof'
# profile the code
result = RubyProf.profile do
# ... code to profile ...
end
# print a graph profile to text
printer = RubyProf::GraphPrinter.new(result)
printer.print(STDOUT, {})
© Prathmesh Ranaut, 2017
ObjectSpace.count_objects
© Prathmesh Ranaut, 2017
{
:TOTAL=>30165,
:FREE=>2216,
:T_OBJECT=>928,
:T_CLASS=>574,
:T_MODULE=>38,
:T_FLOAT=>4,
:T_STRING=>13182,
:T_REGEXP=>77,
:T_ARRAY=>2715,
:T_HASH=>88,
:T_STRUCT=>3,
:T_BIGNUM=>2,
:T_FILE=>30,
:T_DATA=>363,
:T_MATCH=>233,
:T_COMPLEX=>1,
:T_SYMBOL=>6,
:T_IMEMO=>4530,
:T_NODE=>5138,
:T_ICLASS=>37
}
© Prathmesh Ranaut, 2017
DTRACE
© Prathmesh Ranaut, 2017
THANK YOU
&
QUESTIONSHELLO@PRATHMESHRANAUT.COM
HTTPS://TWITTER.COM/PRATHMESHRANAUT
© Prathmesh Ranaut, 2017

Performance Optimization in Ruby