Download to read offline
![Ring Documentation, Release 1.5.4
==========================================
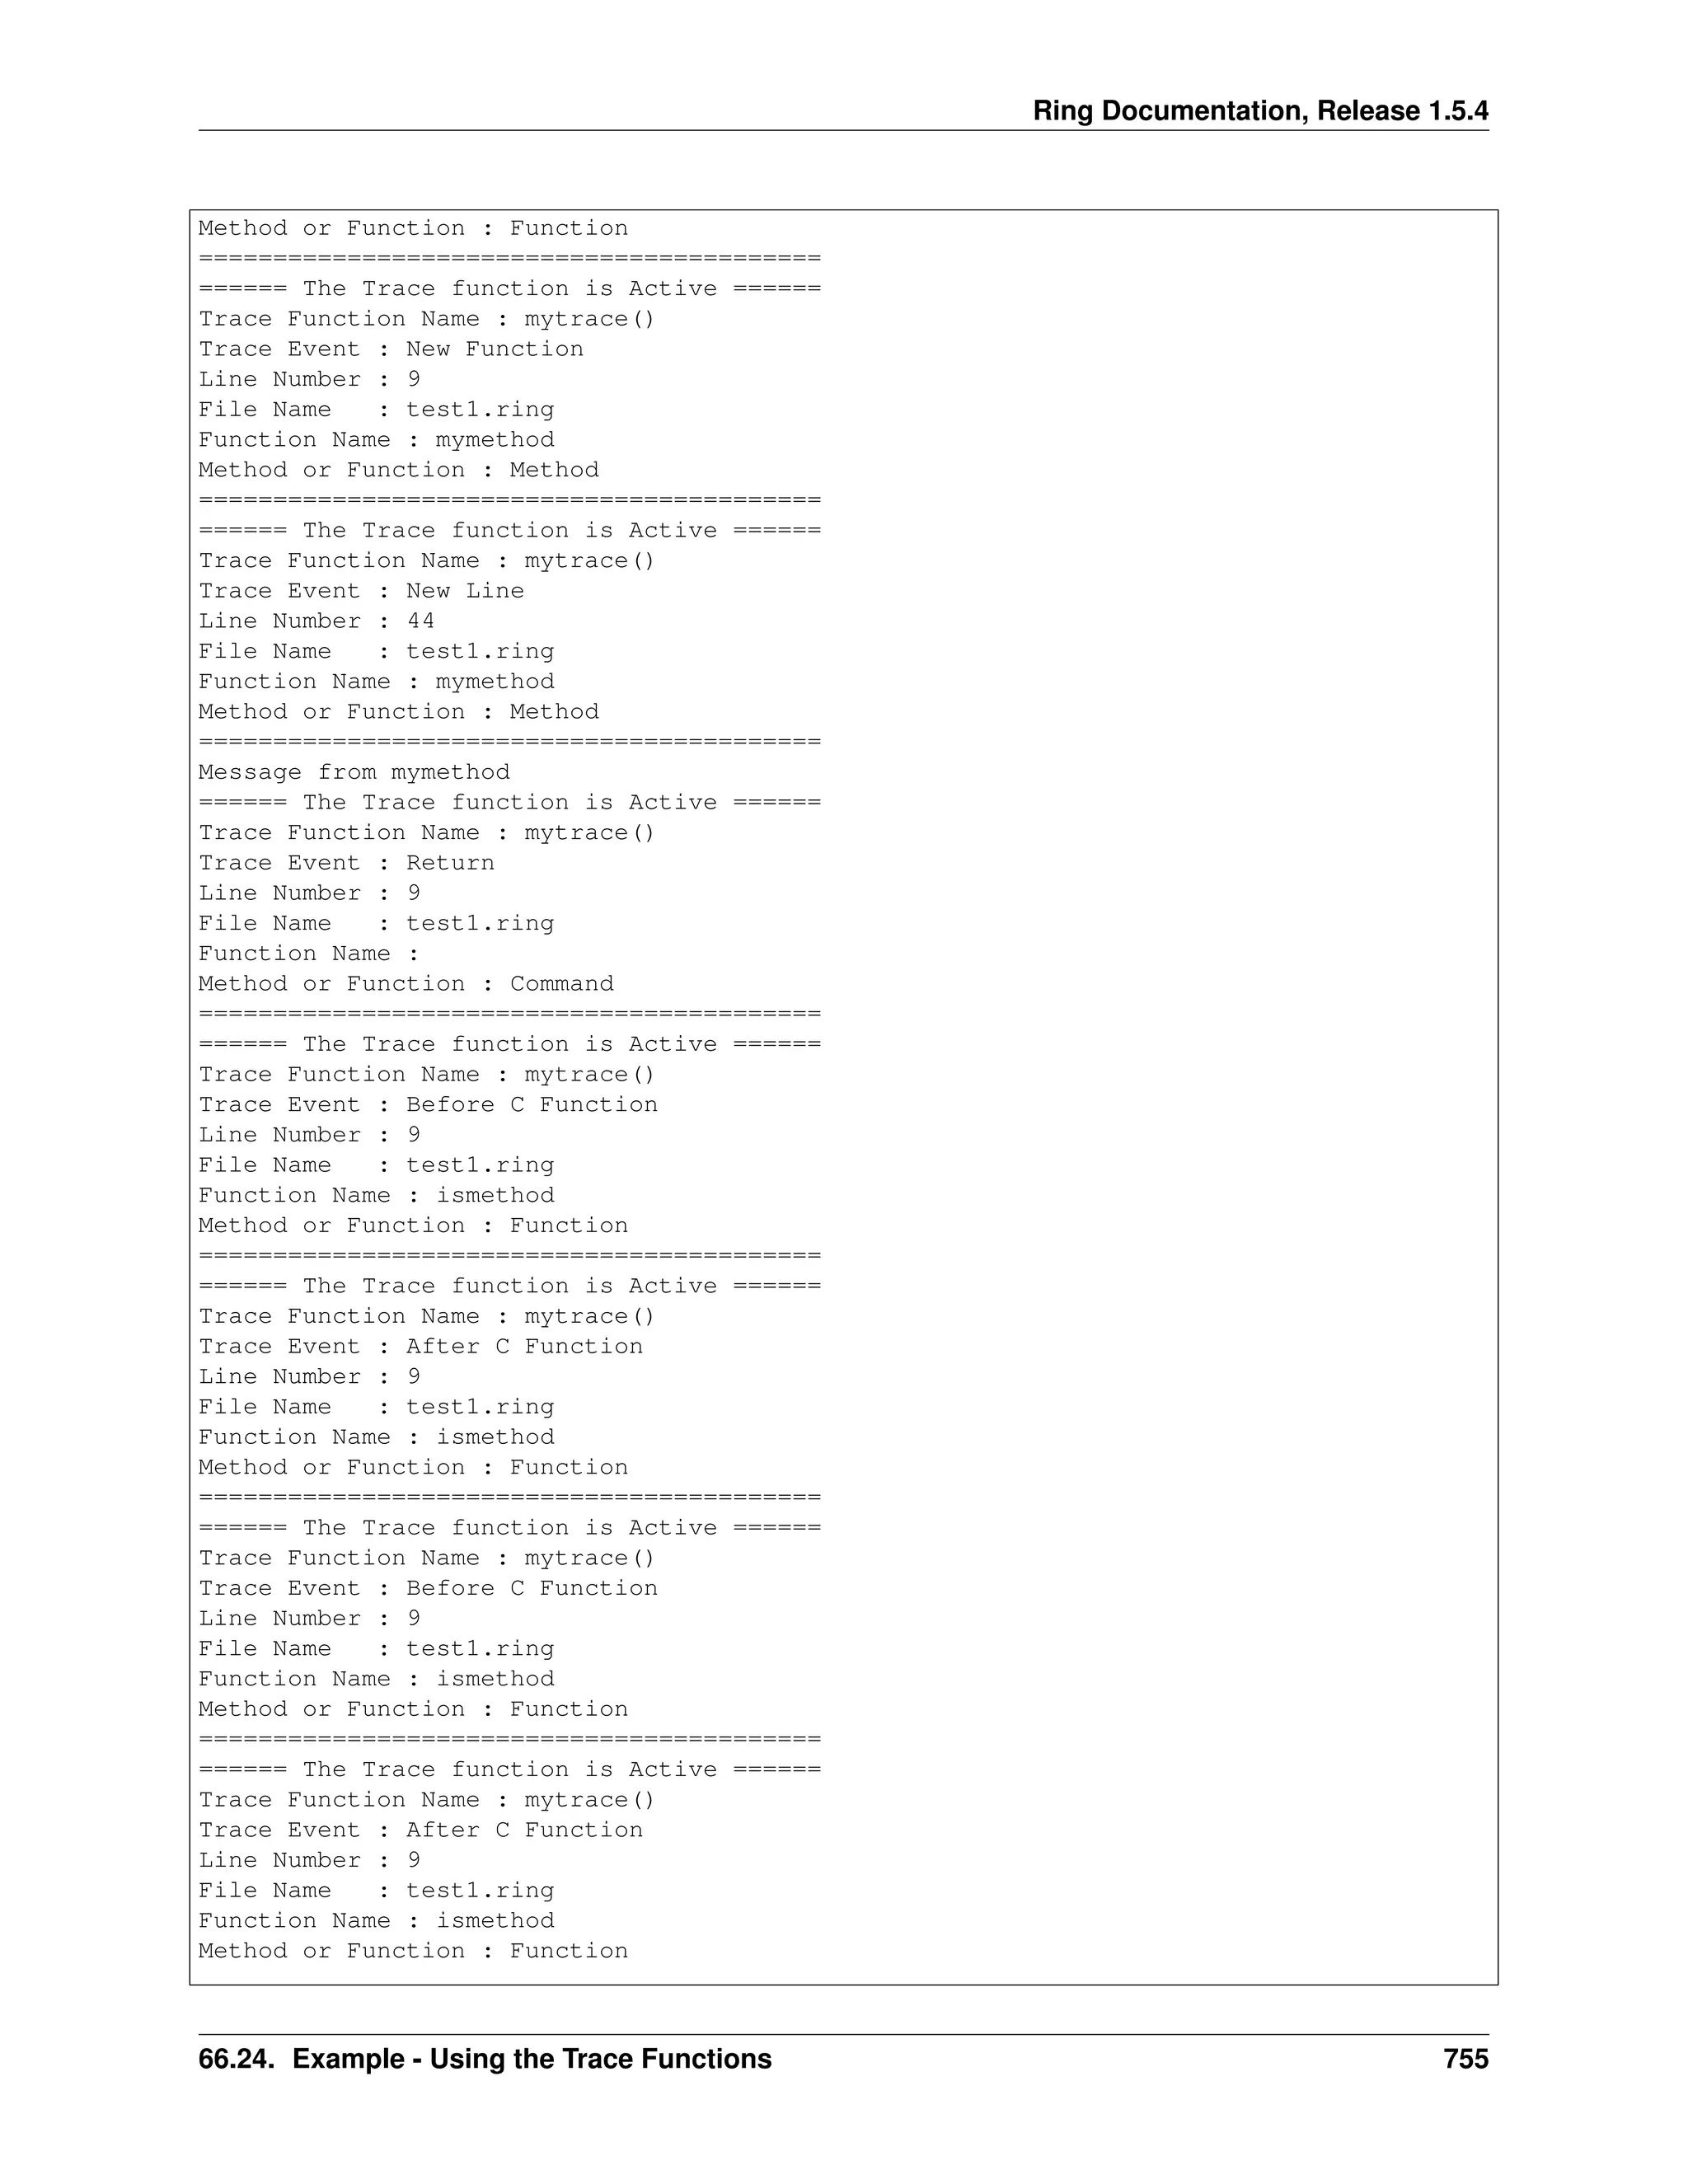
====== The Trace function is Active ======
Trace Function Name : mytrace()
Trace Event : New Line
Line Number : 11
File Name : test1.ring
Function Name :
Method or Function : Command
==========================================
66.25 Example - The Trace Library
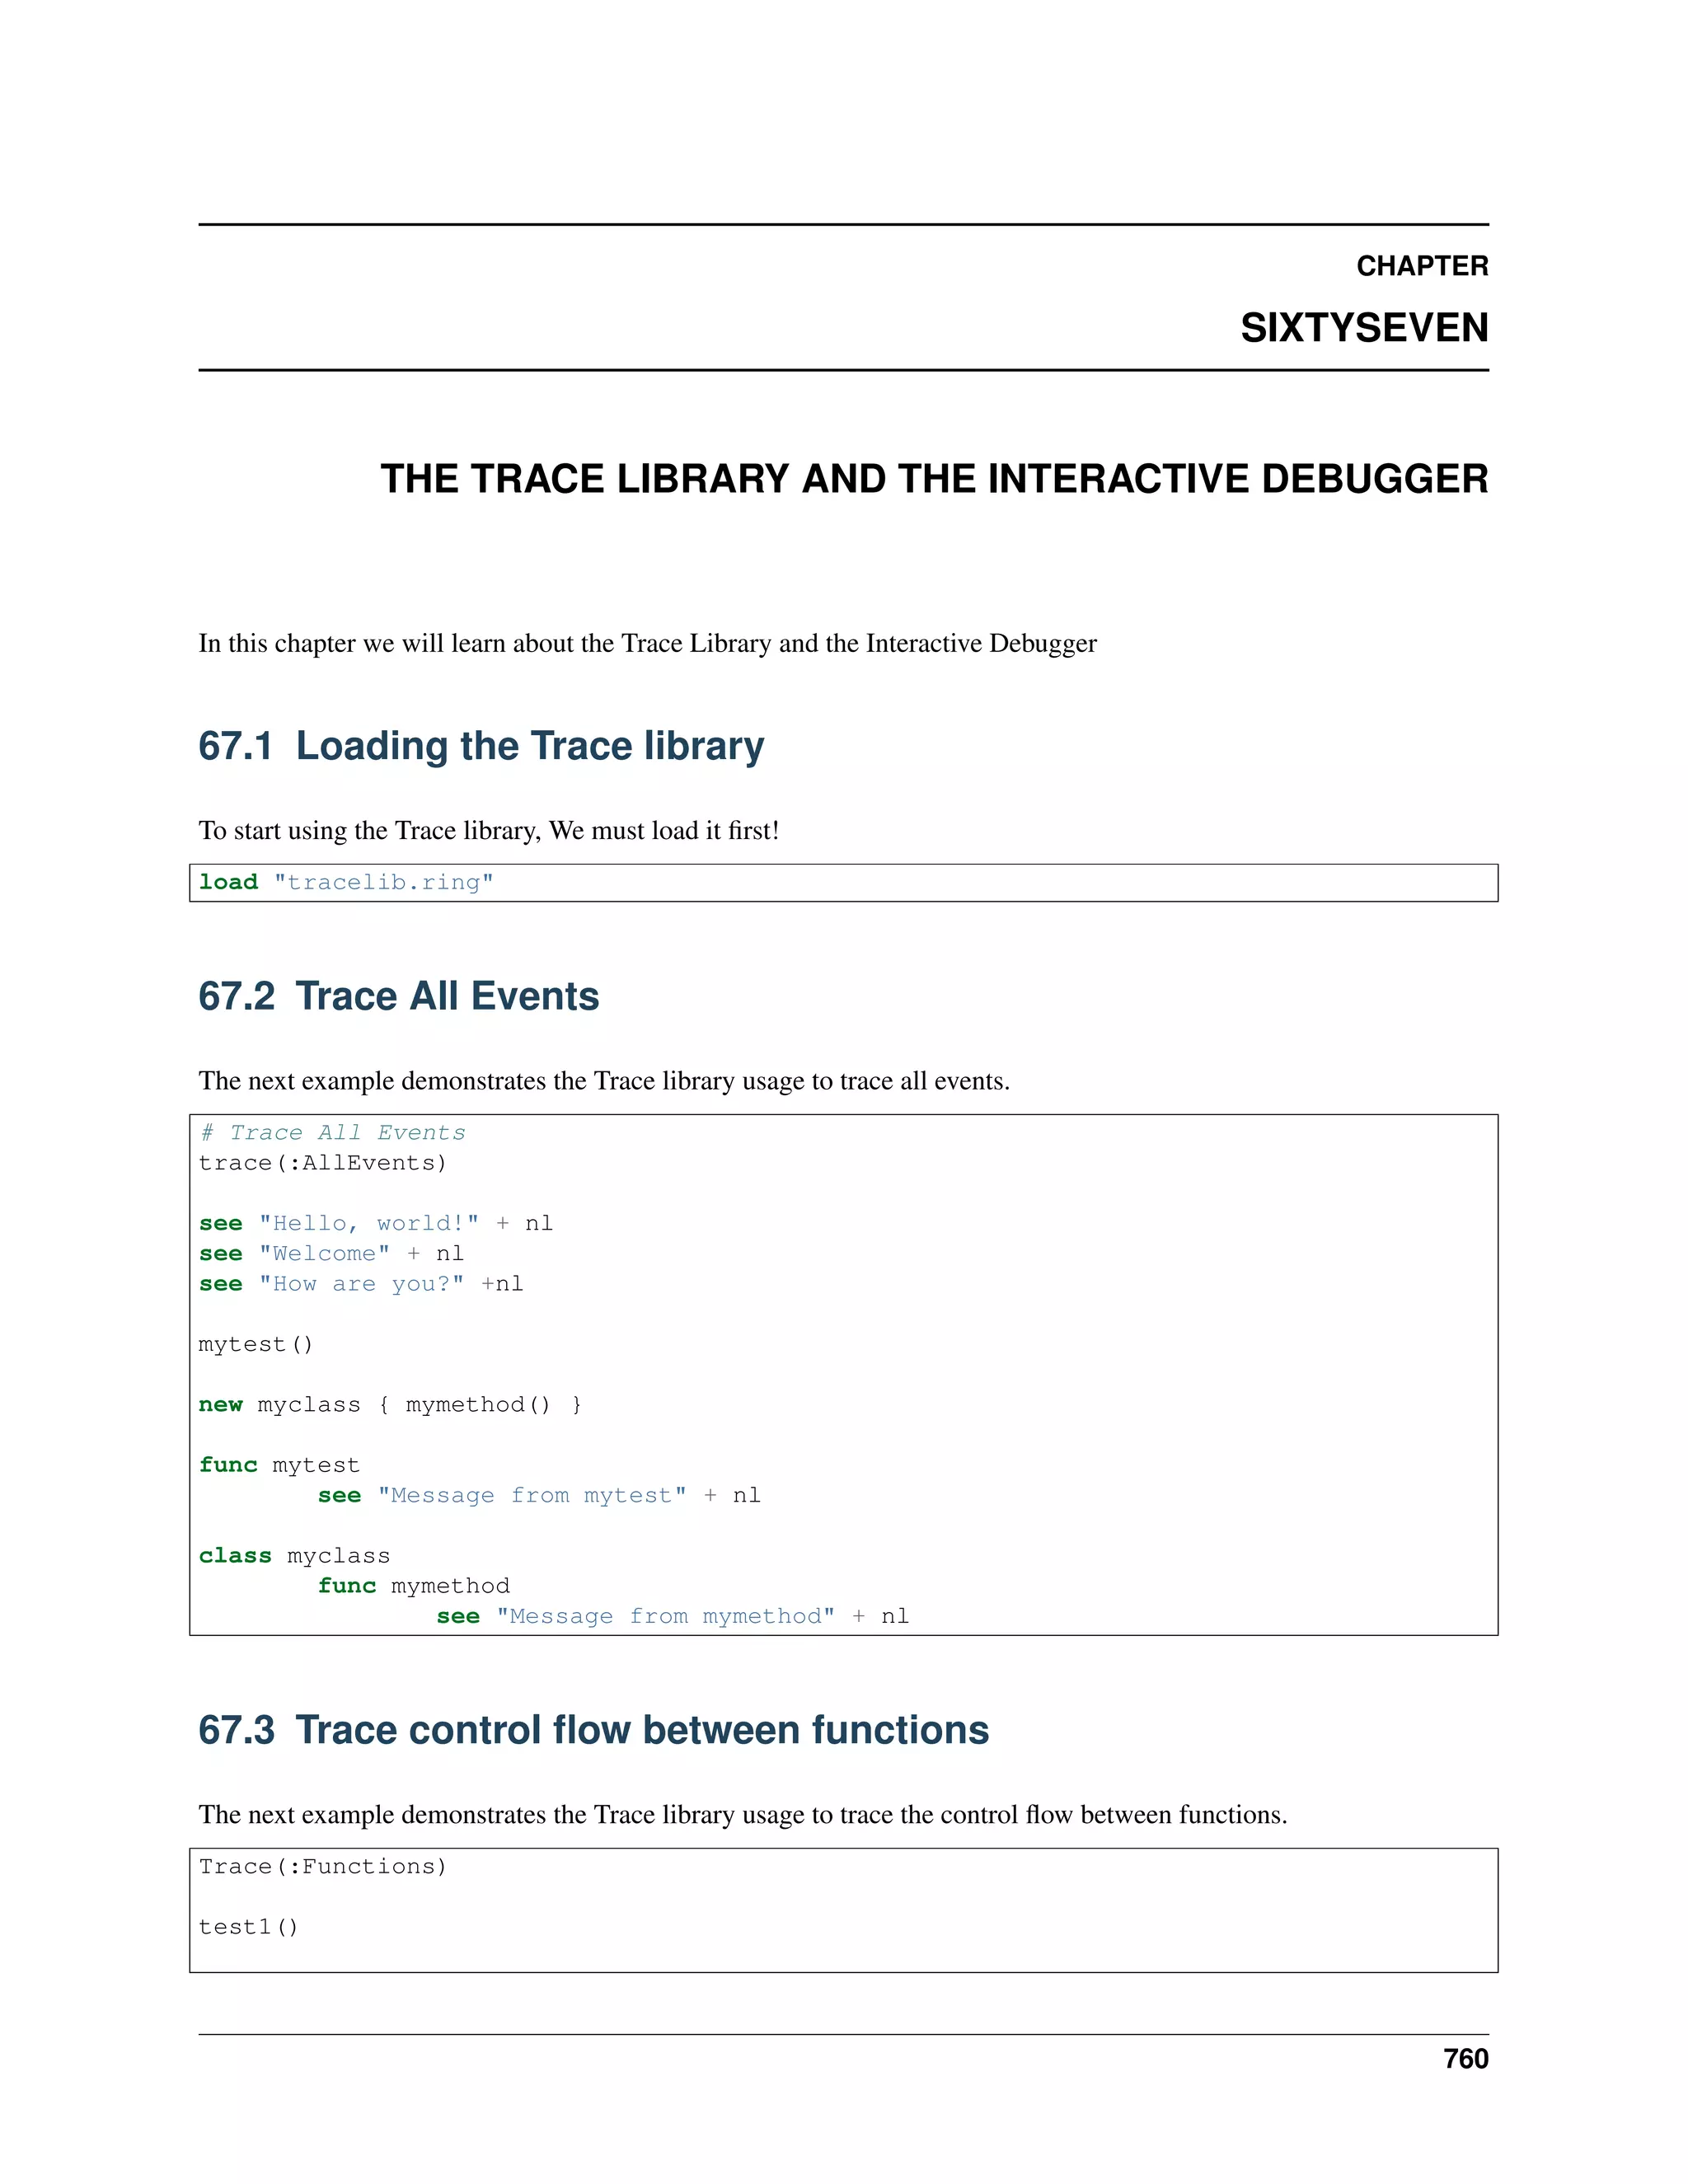
The next example uses the Trace functions provided by the Ring language to create the Trace library.
Using the Trace library we have nice Tracing tools and Interaction debugger too.
# Trace Events
TRACEEVENT_NEWLINE = 1
TRACEEVENT_NEWFUNC = 2
TRACEEVENT_RETURN = 3
TRACEEVENT_ERROR = 4
TRACEEVENT_BEFORECFUNC = 5
TRACEEVENT_AFTERCFUNC = 6
# Trace Data
TRACEDATA_LINENUMBER = 1
TRACEDATA_FILENAME = 2
TRACEDATA_FUNCNAME = 3
TRACEDATA_METHODORFUNC = 4
# Method of Function
TRACEDATA_METHODORFUNC_METHOD = TRUE
TRACEDATA_METHODORFUNC_NOTMETHOD = FALSE
TRACE_BREAKPOINTS = TRUE
TRACE_TEMPLIST = []
func Trace cType
switch trim(lower(cType))
on :AllEvents
ringvm_settrace("TraceLib_AllEvents()")
on :Functions
ringvm_settrace("TraceLib_Functions()")
on :PassError
ringvm_settrace("TraceLib_PassError()")
on :Debugger
ringvm_settrace("TraceLib_Debugger()")
on :LineByLine
ringvm_settrace("TraceLib_LineByLine()")
off
func TraceLib_AllEvents
if right(ringvm_tracedata()[TRACEDATA_FILENAME],13) = "tracelib.ring"
return
ok
see "====== The Trace function is Active ======" + nl +
66.25. Example - The Trace Library 756](https://image.slidesharecdn.com/781ringfayedringdoc1-180427044500/75/The-Ring-programming-language-version-1-5-4-book-Part-79-of-185-2-2048.jpg)
![Ring Documentation, Release 1.5.4
"Trace Function Name : " + ringvm_TraceFunc() + nl +
"Trace Event : "
switch ringvm_TraceEvent()
on TRACEEVENT_NEWLINE see "New Line"
on TRACEEVENT_NEWFUNC see "New Function"
on TRACEEVENT_RETURN see "Return"
on TRACEEVENT_ERROR see "Error"
on TRACEEVENT_BEFORECFUNC see "Before C Function"
on TRACEEVENT_AFTERCFUNC see "After C Function"
off
see nl +
"Line Number : " + ringvm_tracedata()[TRACEDATA_LINENUMBER] + nl +
"File Name : " + ringvm_tracedata()[TRACEDATA_FILENAME] + nl +
"Function Name : " + ringvm_tracedata()[TRACEDATA_FUNCNAME] + nl +
"Method or Function : "
if ringvm_tracedata()[TRACEDATA_METHODORFUNC] =
TRACEDATA_METHODORFUNC_METHOD
see "Method"
else
if ringvm_tracedata()[TRACEDATA_FUNCNAME] = NULL
see "Command"
else
see "Function"
ok
ok
see nl + Copy("=",42) + nl
func TraceLib_Functions
if right(ringvm_tracedata()[TRACEDATA_FILENAME],13) = "tracelib.ring"
return
ok
switch ringvm_TraceEvent()
on TRACEEVENT_NEWFUNC
see "Open Func : " +
ringvm_TraceData()[TRACEDATA_FUNCNAME] + nl
on TRACEEVENT_RETURN
see "Return to Func : " +
ringvm_TraceData()[TRACEDATA_FUNCNAME] + nl
off
func TraceLib_PassError
if right(ringvm_tracedata()[TRACEDATA_FILENAME],13) = "tracelib.ring"
return
ok
switch ringvm_TraceEvent()
on TRACEEVENT_ERROR
see nl
see "TraceLib : After Error !" + nl
ringvm_passerror()
off
func TraceLib_Debugger
if right(ringvm_tracedata()[TRACEDATA_FILENAME],13) = "tracelib.ring"
return
ok
switch ringvm_TraceEvent()
on TRACEEVENT_ERROR
_BreakPoint()
66.25. Example - The Trace Library 757](https://image.slidesharecdn.com/781ringfayedringdoc1-180427044500/75/The-Ring-programming-language-version-1-5-4-book-Part-79-of-185-3-2048.jpg)
![Ring Documentation, Release 1.5.4
off
func TraceLib_LineByLine
if right(ringvm_tracedata()[TRACEDATA_FILENAME],13) = "tracelib.ring" or
ringvm_TraceEvent() != TRACEEVENT_NEWLINE
return
ok
aList = ringvm_tracedata()
see "Before Line : " + aList[TRACEDATA_LINENUMBER] + nl
_BreakPoint()
func BreakPoint
if not TRACE_BREAKPOINTS
return
ok
_BreakPoint()
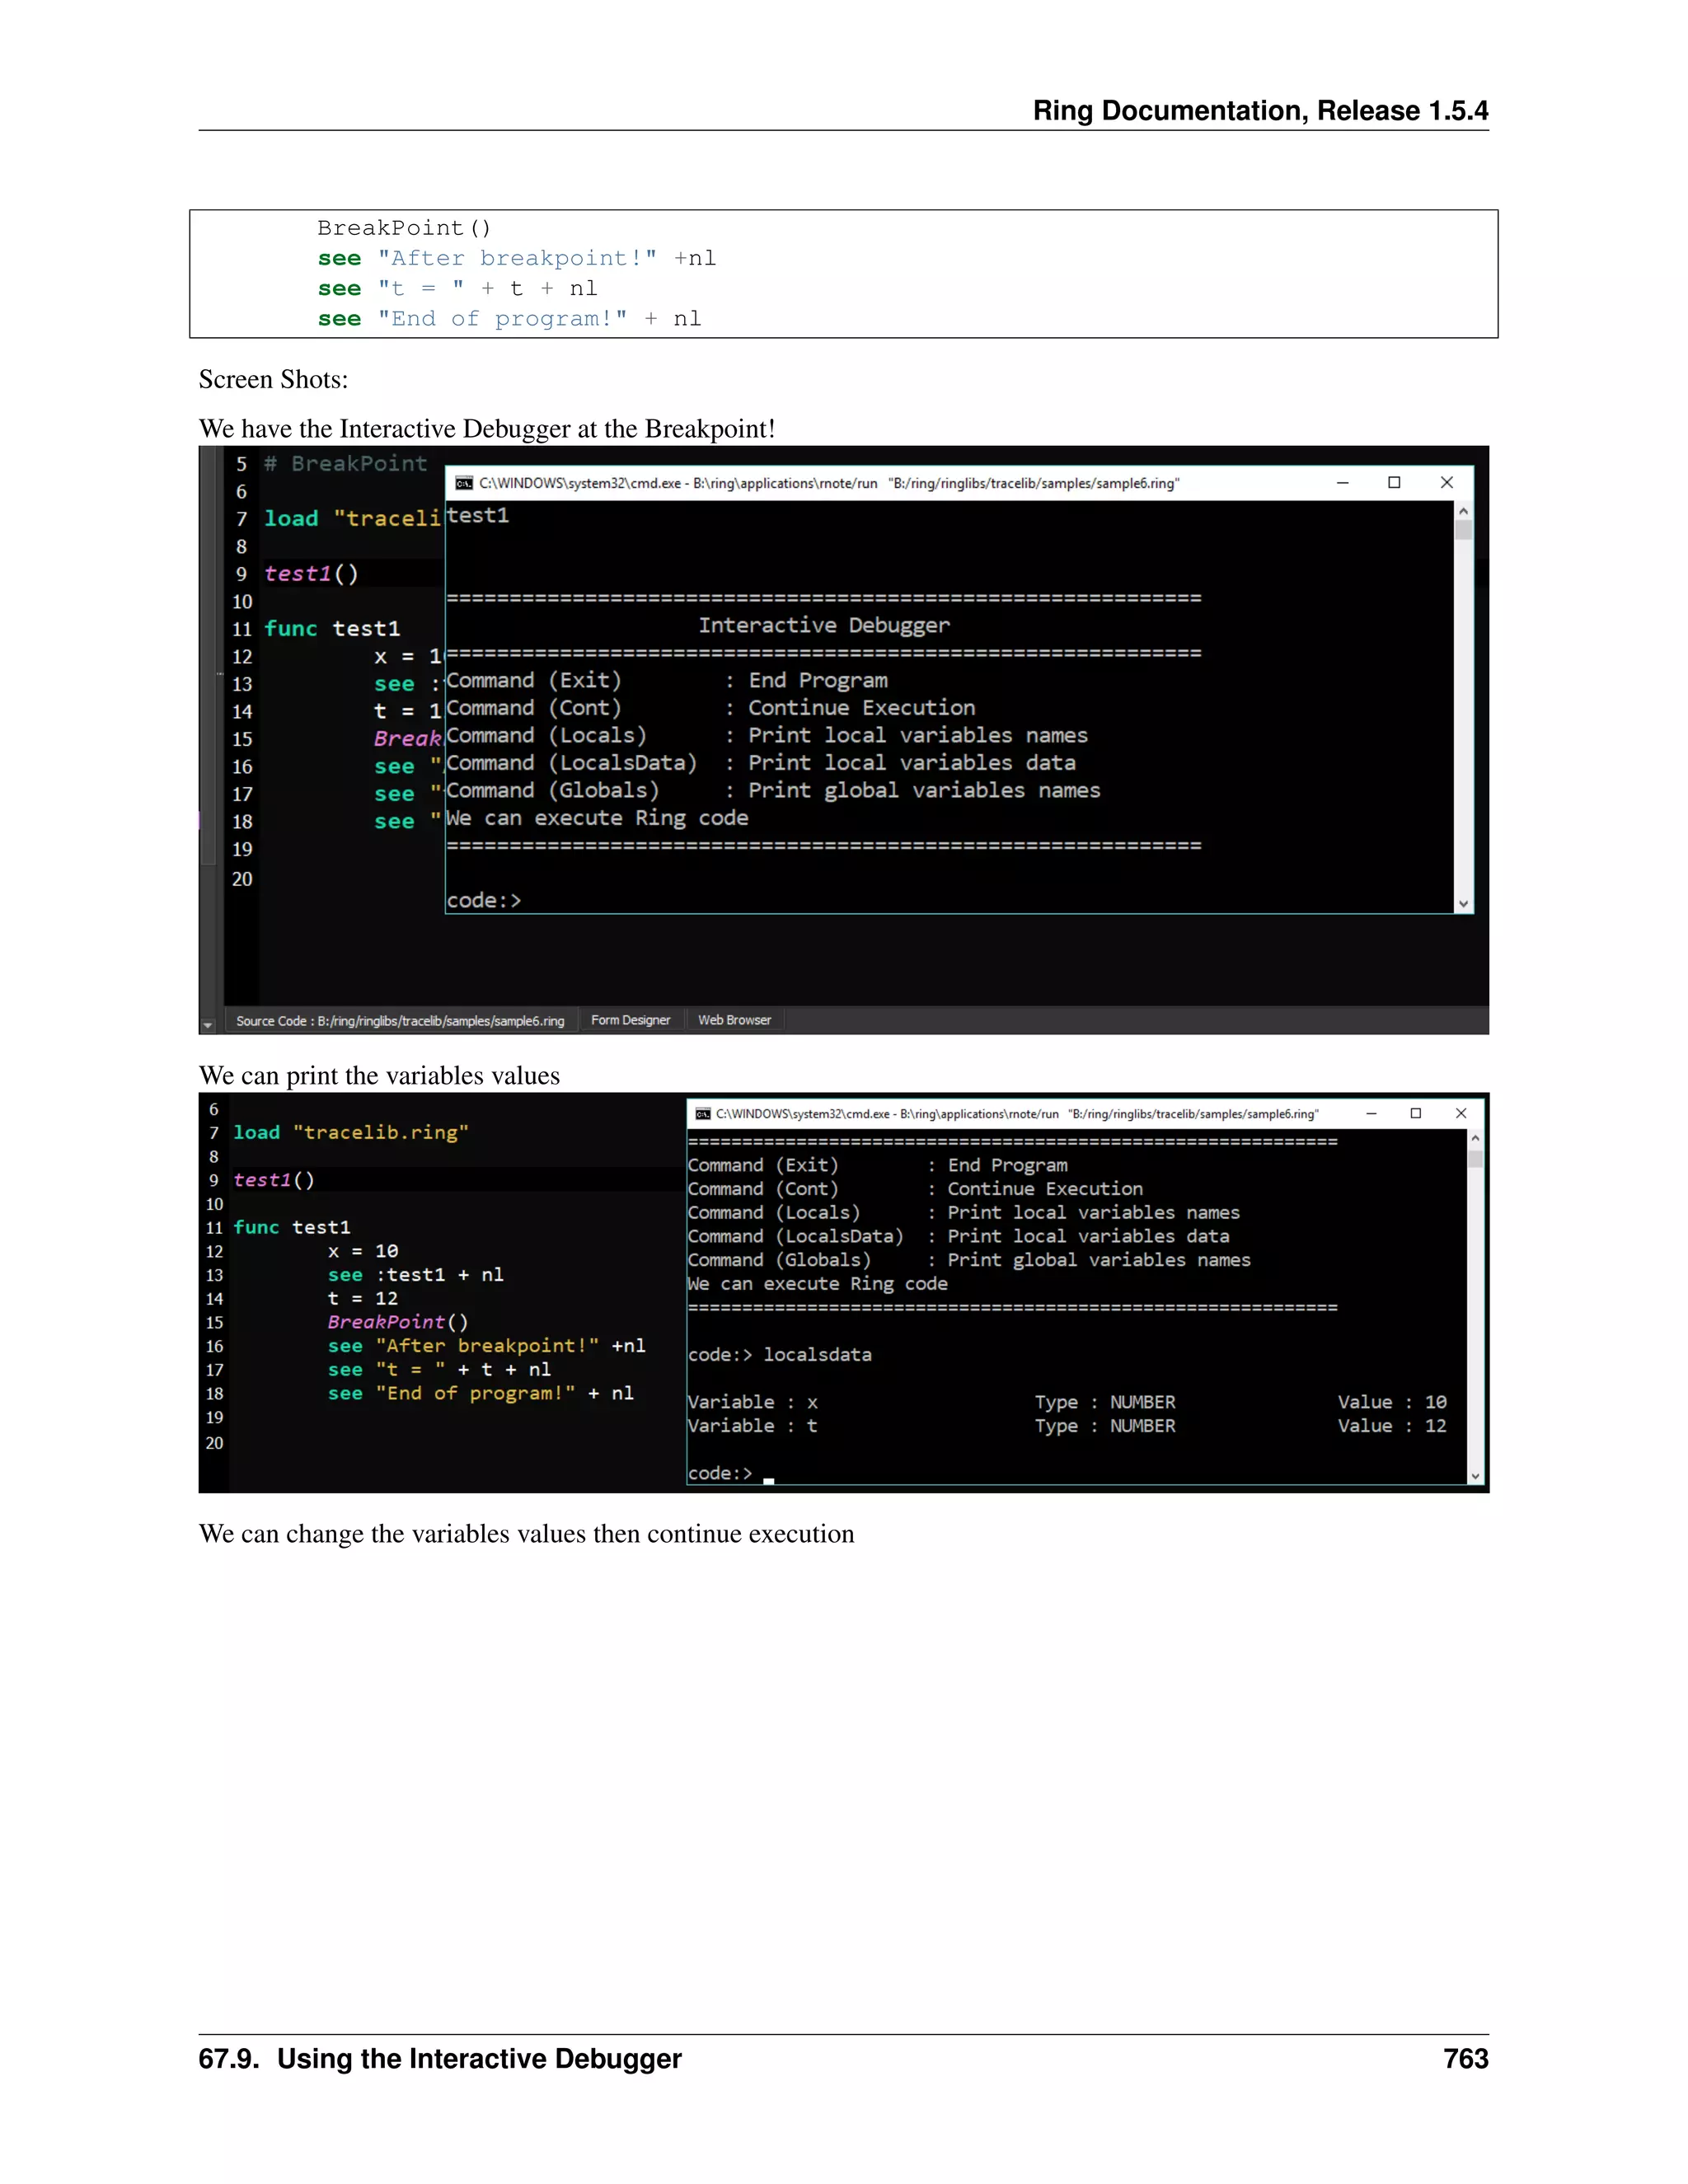
func _BreakPoint
see nl+nl+Copy("=",60) + nl +
Copy(" ",20)+"Interactive Debugger" + nl +
Copy("=",60) + nl +
"Command (Exit) : End Program" + nl +
"Command (Cont) : Continue Execution" + nl +
"Command (Locals) : Print local variables names" + nl +
"Command (LocalsData) : Print local variables data" + nl +
"Command (Globals) : Print global variables names" + nl +
"We can execute Ring code" + nl +
Copy("=",60) + nl
while true
see nl + "code:> "
give cCode
cmd = trim(lower(cCode))
if cmd = "exit" or cmd = "bye"
shutdown()
ok
nScope = ringvm_scopescount()-2
switch cmd
on "locals"
ringvm_EvalInScope(nScope,"see locals() callgc()")
loop
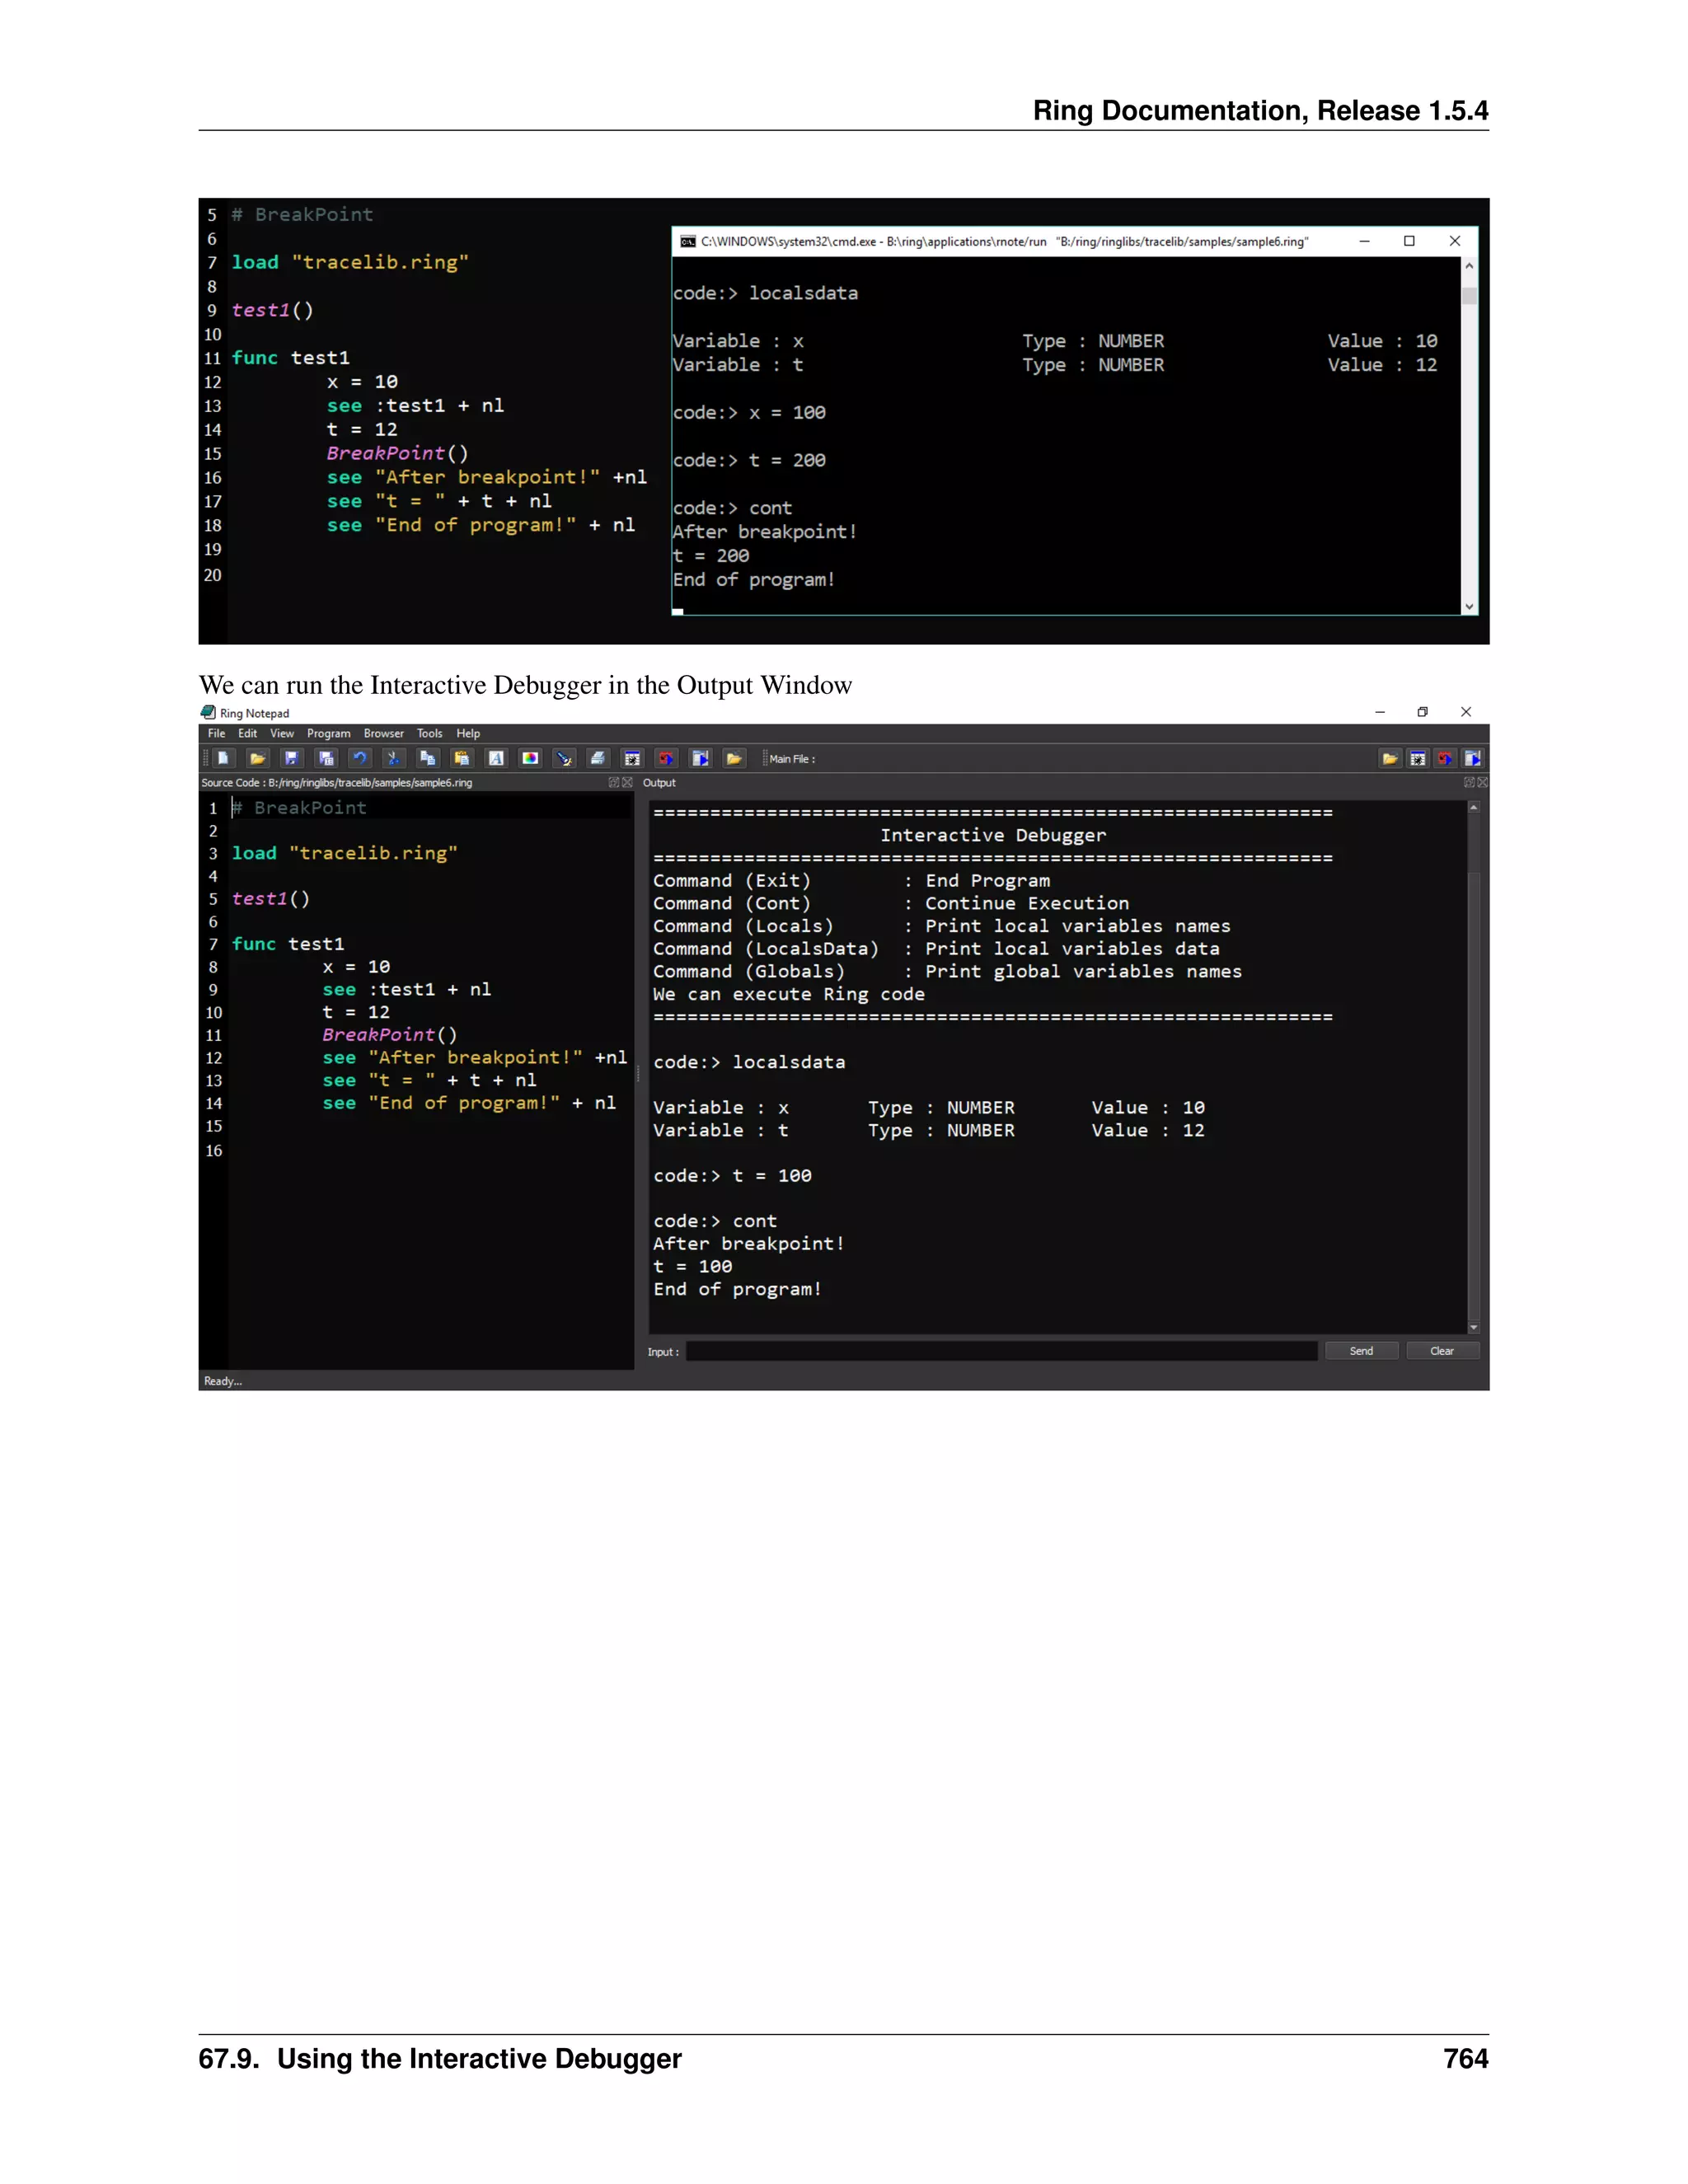
on "localsdata"
PrintLocalsData(nScope)
loop
on "globals"
ringvm_EvalInScope(nScope,"see globals() callgc()")
loop
on "cont"
ringvm_passerror()
exit
off
Try
ringvm_EvalInScope(nScope,cCode)
catch
see cCatchError
done
end
func NoBreakPoints
66.25. Example - The Trace Library 758](https://image.slidesharecdn.com/781ringfayedringdoc1-180427044500/75/The-Ring-programming-language-version-1-5-4-book-Part-79-of-185-4-2048.jpg)
![Ring Documentation, Release 1.5.4
TRACE_BREAKPOINTS = FALSE
func PrintLocalsData nScope
if nScope = 1 # Global
ringvm_Evalinscope(nScope,'TRACE_TEMPLIST = globals()')
else
ringvm_Evalinscope(nScope,'TRACE_TEMPLIST = locals() callgc()')
ok
see nl
aTempList = TRACE_TEMPLIST
TRACE_TEMPLIST = []
nSpaces = 5
for TRACE_ITEM in aTempList
if len(TRACE_ITEM) + 5 > nSpaces
nSpaces = len(TRACE_ITEM) + 5
ok
next
for TRACE_ITEM in aTempList
see "Variable : " + TRACE_ITEM
cVarName = TRACE_ITEM
see copy(" ",nSpaces-len(cVarName)) + " Type : "
ringvm_Evalinscope(nScope,"see type(" + TRACE_ITEM +")")
ringvm_Evalinscope(nScope,"see Copy(' ',fabs(15-len(type(" +
TRACE_ITEM +"))))")
see " Value : "
ringvm_Evalinscope(nScope,"see " + TRACE_ITEM)
see nl
next
66.25. Example - The Trace Library 759](https://image.slidesharecdn.com/781ringfayedringdoc1-180427044500/75/The-Ring-programming-language-version-1-5-4-book-Part-79-of-185-5-2048.jpg)


The document discusses the Trace library in Ring for debugging programs. It provides examples of using the Trace library to trace all events, control flow between functions, handle errors, use an interactive debugger, execute line by line, set breakpoints, disable breakpoints, and use the interactive debugger at breakpoints. The Trace library allows tracing programs, passing errors, debugging interactively by setting and handling breakpoints.