The Ring programming language version 1.10 book - Part 94 of 212
•
0 likes•21 views

The Ring programming language version 1.10 book - Part 94 of 212

Recommended
Recommended
More Related Content
What's hot
What's hot (20)
Similar to The Ring programming language version 1.10 book - Part 94 of 212
Similar to The Ring programming language version 1.10 book - Part 94 of 212 (20)
More from Mahmoud Samir Fayed
More from Mahmoud Samir Fayed (20)
Recently uploaded
Recently uploaded (20)
The Ring programming language version 1.10 book - Part 94 of 212
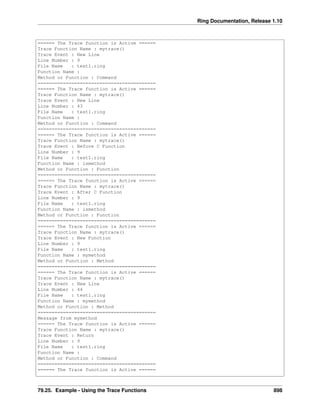
- 1. Ring Documentation, Release 1.10 ====== The Trace function is Active ====== Trace Function Name : mytrace() Trace Event : New Line Line Number : 9 File Name : test1.ring Function Name : Method or Function : Command ========================================== ====== The Trace function is Active ====== Trace Function Name : mytrace() Trace Event : New Line Line Number : 43 File Name : test1.ring Function Name : Method or Function : Command ========================================== ====== The Trace function is Active ====== Trace Function Name : mytrace() Trace Event : Before C Function Line Number : 9 File Name : test1.ring Function Name : ismethod Method or Function : Function ========================================== ====== The Trace function is Active ====== Trace Function Name : mytrace() Trace Event : After C Function Line Number : 9 File Name : test1.ring Function Name : ismethod Method or Function : Function ========================================== ====== The Trace function is Active ====== Trace Function Name : mytrace() Trace Event : New Function Line Number : 9 File Name : test1.ring Function Name : mymethod Method or Function : Method ========================================== ====== The Trace function is Active ====== Trace Function Name : mytrace() Trace Event : New Line Line Number : 44 File Name : test1.ring Function Name : mymethod Method or Function : Method ========================================== Message from mymethod ====== The Trace function is Active ====== Trace Function Name : mytrace() Trace Event : Return Line Number : 9 File Name : test1.ring Function Name : Method or Function : Command ========================================== ====== The Trace function is Active ====== 79.25. Example - Using the Trace Functions 898
- 2. Ring Documentation, Release 1.10 Trace Function Name : mytrace() Trace Event : Before C Function Line Number : 9 File Name : test1.ring Function Name : ismethod Method or Function : Function ========================================== ====== The Trace function is Active ====== Trace Function Name : mytrace() Trace Event : After C Function Line Number : 9 File Name : test1.ring Function Name : ismethod Method or Function : Function ========================================== ====== The Trace function is Active ====== Trace Function Name : mytrace() Trace Event : Before C Function Line Number : 9 File Name : test1.ring Function Name : ismethod Method or Function : Function ========================================== ====== The Trace function is Active ====== Trace Function Name : mytrace() Trace Event : After C Function Line Number : 9 File Name : test1.ring Function Name : ismethod Method or Function : Function ========================================== ====== The Trace function is Active ====== Trace Function Name : mytrace() Trace Event : New Line Line Number : 11 File Name : test1.ring Function Name : Method or Function : Command ========================================== 79.26 Example - The Trace Library The next example uses the Trace functions provided by the Ring language to create the Trace library. Using the Trace library we have nice Tracing tools and Interaction debugger too. # Trace Events TRACEEVENT_NEWLINE = 1 TRACEEVENT_NEWFUNC = 2 TRACEEVENT_RETURN = 3 TRACEEVENT_ERROR = 4 TRACEEVENT_BEFORECFUNC = 5 TRACEEVENT_AFTERCFUNC = 6 # Trace Data TRACEDATA_LINENUMBER = 1 79.26. Example - The Trace Library 899
- 3. Ring Documentation, Release 1.10 TRACEDATA_FILENAME = 2 TRACEDATA_FUNCNAME = 3 TRACEDATA_METHODORFUNC = 4 # Method of Function TRACEDATA_METHODORFUNC_METHOD = TRUE TRACEDATA_METHODORFUNC_NOTMETHOD = FALSE TRACE_BREAKPOINTS = TRUE TRACE_TEMPLIST = [] func Trace cType switch trim(lower(cType)) on :AllEvents ringvm_settrace("TraceLib_AllEvents()") on :Functions ringvm_settrace("TraceLib_Functions()") on :PassError ringvm_settrace("TraceLib_PassError()") on :Debugger ringvm_settrace("TraceLib_Debugger()") on :LineByLine ringvm_settrace("TraceLib_LineByLine()") off func TraceLib_AllEvents if right(ringvm_tracedata()[TRACEDATA_FILENAME],13) = "tracelib.ring" return ok see "====== The Trace function is Active ======" + nl + "Trace Function Name : " + ringvm_TraceFunc() + nl + "Trace Event : " switch ringvm_TraceEvent() on TRACEEVENT_NEWLINE see "New Line" on TRACEEVENT_NEWFUNC see "New Function" on TRACEEVENT_RETURN see "Return" on TRACEEVENT_ERROR see "Error" on TRACEEVENT_BEFORECFUNC see "Before C Function" on TRACEEVENT_AFTERCFUNC see "After C Function" off see nl + "Line Number : " + ringvm_tracedata()[TRACEDATA_LINENUMBER] + nl + "File Name : " + ringvm_tracedata()[TRACEDATA_FILENAME] + nl + "Function Name : " + ringvm_tracedata()[TRACEDATA_FUNCNAME] + nl + "Method or Function : " if ringvm_tracedata()[TRACEDATA_METHODORFUNC] = TRACEDATA_METHODORFUNC_METHOD see "Method" else if ringvm_tracedata()[TRACEDATA_FUNCNAME] = NULL see "Command" else see "Function" ok ok see nl + Copy("=",42) + nl 79.26. Example - The Trace Library 900
- 4. Ring Documentation, Release 1.10 func TraceLib_Functions if right(ringvm_tracedata()[TRACEDATA_FILENAME],13) = "tracelib.ring" return ok switch ringvm_TraceEvent() on TRACEEVENT_NEWFUNC see "Open Func : " + ringvm_TraceData()[TRACEDATA_FUNCNAME] + nl on TRACEEVENT_RETURN see "Return to Func : " + ringvm_TraceData()[TRACEDATA_FUNCNAME] + nl off func TraceLib_PassError if right(ringvm_tracedata()[TRACEDATA_FILENAME],13) = "tracelib.ring" return ok switch ringvm_TraceEvent() on TRACEEVENT_ERROR see nl see "TraceLib : After Error !" + nl ringvm_passerror() off func TraceLib_Debugger if right(ringvm_tracedata()[TRACEDATA_FILENAME],13) = "tracelib.ring" return ok switch ringvm_TraceEvent() on TRACEEVENT_ERROR _BreakPoint() off func TraceLib_LineByLine if right(ringvm_tracedata()[TRACEDATA_FILENAME],13) = "tracelib.ring" or ringvm_TraceEvent() != TRACEEVENT_NEWLINE return ok aList = ringvm_tracedata() see "Before Line : " + aList[TRACEDATA_LINENUMBER] + nl _BreakPoint() func BreakPoint if not TRACE_BREAKPOINTS return ok _BreakPoint() func _BreakPoint see nl+nl+Copy("=",60) + nl + Copy(" ",20)+"Interactive Debugger" + nl + Copy("=",60) + nl + "Command (Exit) : End Program" + nl + "Command (Cont) : Continue Execution" + nl + "Command (Locals) : Print local variables names" + nl + "Command (LocalsData) : Print local variables data" + nl + "Command (Globals) : Print global variables names" + nl + "We can execute Ring code" + nl + 79.26. Example - The Trace Library 901
- 5. Ring Documentation, Release 1.10 Copy("=",60) + nl while true see nl + "code:> " give cCode cmd = trim(lower(cCode)) if cmd = "exit" or cmd = "bye" shutdown() ok nScope = ringvm_scopescount()-2 switch cmd on "locals" ringvm_EvalInScope(nScope,"see locals() callgc()") loop on "localsdata" PrintLocalsData(nScope) loop on "globals" ringvm_EvalInScope(nScope,"see globals() callgc()") loop on "cont" ringvm_passerror() exit off Try ringvm_EvalInScope(nScope,cCode) catch see cCatchError done end func NoBreakPoints TRACE_BREAKPOINTS = FALSE func PrintLocalsData nScope if nScope = 1 # Global ringvm_Evalinscope(nScope,'TRACE_TEMPLIST = globals()') else ringvm_Evalinscope(nScope,'TRACE_TEMPLIST = locals() callgc()') ok see nl aTempList = TRACE_TEMPLIST TRACE_TEMPLIST = [] nSpaces = 5 for TRACE_ITEM in aTempList if len(TRACE_ITEM) + 5 > nSpaces nSpaces = len(TRACE_ITEM) + 5 ok next for TRACE_ITEM in aTempList see "Variable : " + TRACE_ITEM cVarName = TRACE_ITEM see copy(" ",nSpaces-len(cVarName)) + " Type : " ringvm_Evalinscope(nScope,"see type(" + TRACE_ITEM +")") ringvm_Evalinscope(nScope,"see Copy(' ',fabs(15-len(type(" + TRACE_ITEM +"))))") see " Value : " ringvm_Evalinscope(nScope,"see " + TRACE_ITEM) 79.26. Example - The Trace Library 902
- 6. Ring Documentation, Release 1.10 see nl next 79.27 ringvm_see() function Using the ringvm_see() function we can redefine the behavior of the See command Also we can use ring_see() to have the original behavior Example: see "Hello world" + nl see 123 + nl see ["one","two","three"] see new point {x=10 y=20 z=30} func ringvm_see t ring_see("We want to print: ") ring_See(t) class point x y z Output: We want to print: Hello world We want to print: 123 We want to print: one two three We want to print: x: 10.000000 y: 20.000000 z: 30.000000 79.28 ringvm_give() function Using the ringvm_give() function we can redefine the behavior of the Give command Example: see "Name: " give name see "Hello " + name func ringvm_give see "Mahmoud" + nl return "Mahmoud" Output: Name: Mahmoud Hello Mahmoud 79.29 ringvm_info() function The ringvm_info() is an internal function that return a list of information about the Ring VM structure. 79.27. ringvm_see() function 903
- 7. Ring Documentation, Release 1.10 It’s used only by the Ring Team in advanced tests to check the VM status. Syntax: ringvm_info() ---> List of information about the VM structure 79.29. ringvm_info() function 904
- 8. CHAPTER EIGHTY THE TRACE LIBRARY AND THE INTERACTIVE DEBUGGER In this chapter we will learn about the Trace Library and the Interactive Debugger 80.1 Loading the Trace library To start using the Trace library, We must load it first! load "tracelib.ring" 80.2 Trace All Events The next example demonstrates the Trace library usage to trace all events. # Trace All Events trace(:AllEvents) see "Hello, world!" + nl see "Welcome" + nl see "How are you?" +nl mytest() new myclass { mymethod() } func mytest see "Message from mytest" + nl class myclass func mymethod see "Message from mymethod" + nl 80.3 Trace control flow between functions The next example demonstrates the Trace library usage to trace the control flow between functions. Trace(:Functions) test1() 905
- 9. Ring Documentation, Release 1.10 func test1 see :test1 + nl test2() func test2 see :test2 + nl see test3() + nl func test3 see :test3 + nl return "test 3 output" 80.4 Pass Error The next example demonstrates the Trace library usage to pass an error! Trace(:PassError) test1() func test1 x = 10 see :test1 + nl test2() # Runtime Error! see "We can continue!" 80.5 Interactive Debugger The next example demonstrates the Trace library usage to use the Interactive Debugger Trace(:Debugger) test1() see "good bye!" + nl func test1 x = 10 see :test1 + nl t = 12 test2() # Runtime Error! see "After Error!" +nl see "t = " see t see nl see "x = " see x see nl 80.6 Execute Program Line by Line The next example demonstrates the Trace library usage to execute the program line by line! Trace(:LineByLine) test1() 80.4. Pass Error 906
- 10. Ring Documentation, Release 1.10 func test1 x = 10 see :test1 + nl t = 12 test2() see "After Error!" +nl see "t = " + t + nl 80.7 BreakPoint The next example demonstrates the Trace library usage to stop at a breakpoint! test1() func test1 x = 10 see :test1 + nl t = 12 BreakPoint() see "After breakpoint!" +nl see "t = " + t + nl see "End of program!" + nl 80.8 Disable BreakPoints The next example demonstrates the Trace library usage and how to disable the Breakpoints! NoBreakPoints() test1() func test1 x = 10 see :test1 + nl t = 12 BreakPoint() see "After breakpoint!" +nl see "t = " + t + nl see "End of program!" + nl 80.9 Using the Interactive Debugger The next example uses a Breakpoint to open the Interactive Debugger! load "tracelib.ring" test1() func test1 x = 10 see :test1 + nl t = 12 80.7. BreakPoint 907