Download to read offline
![Ring Documentation, Release 1.5.3
• Nested Lists Pointer
• State List
Syntax:
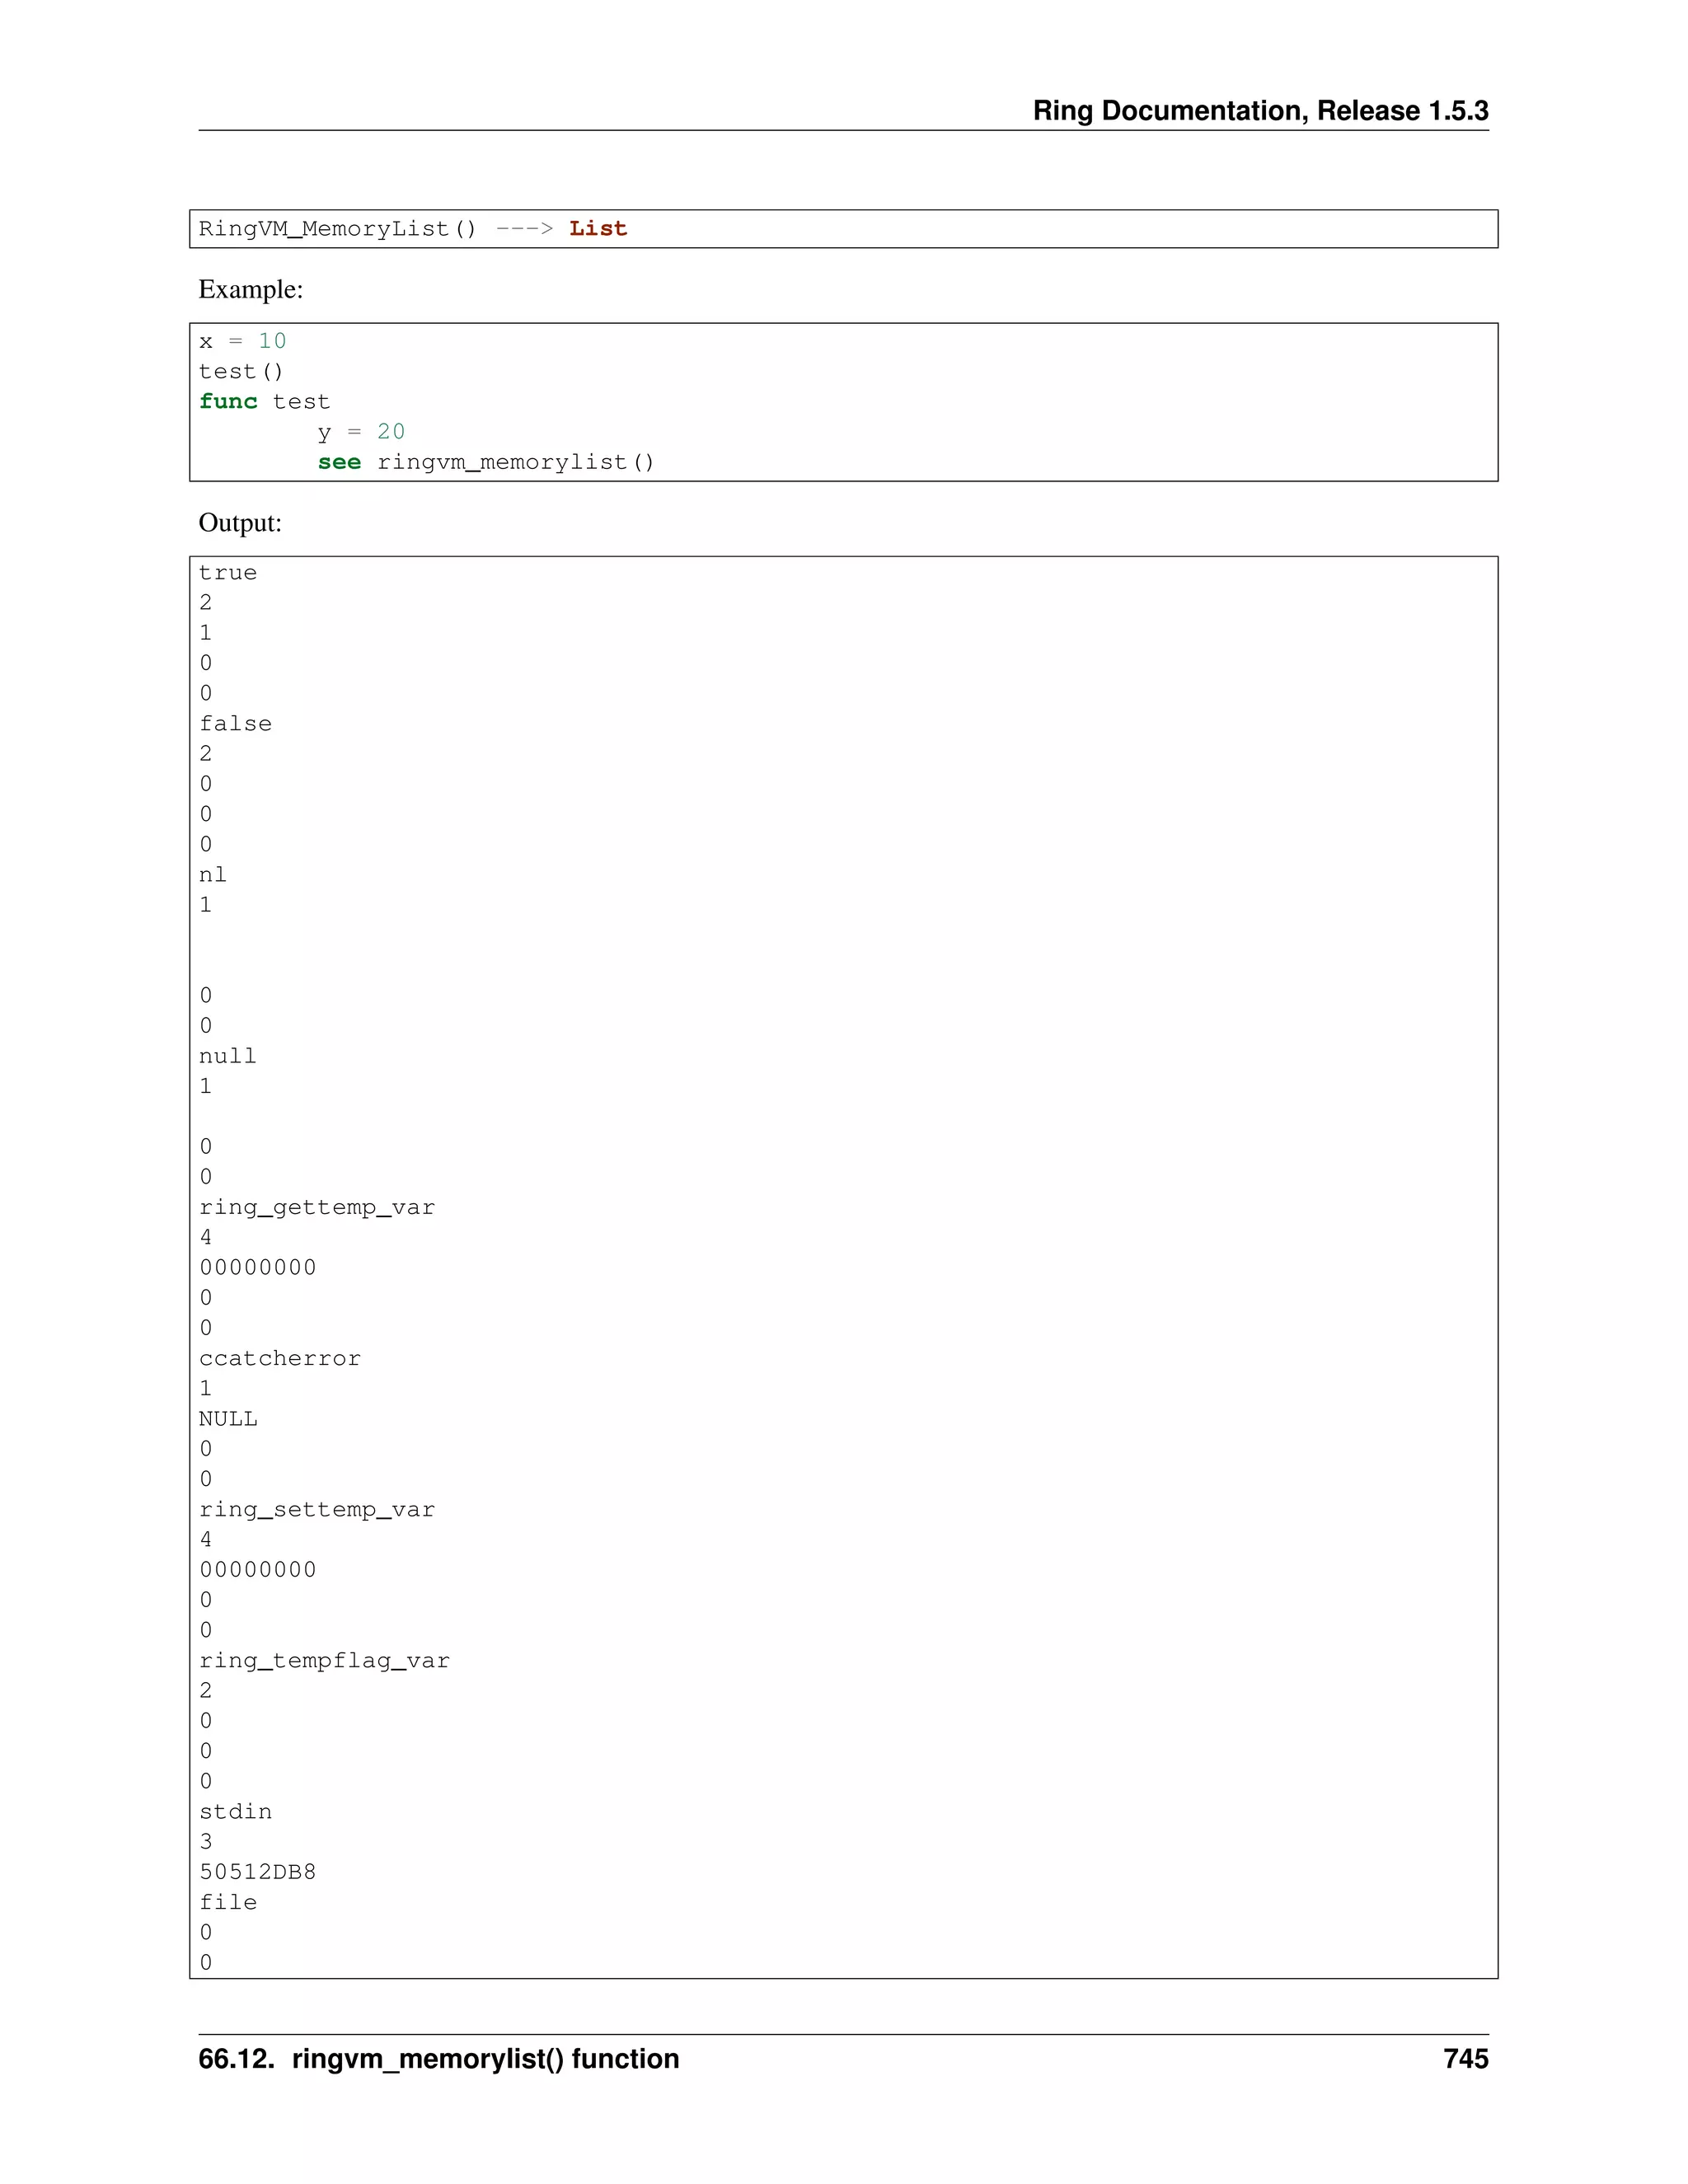
RingVM_CallList() ---> List
Example:
hello()
func hello
test()
func test
mylist = ringvm_calllist()
for t in mylist see t[2] + nl next
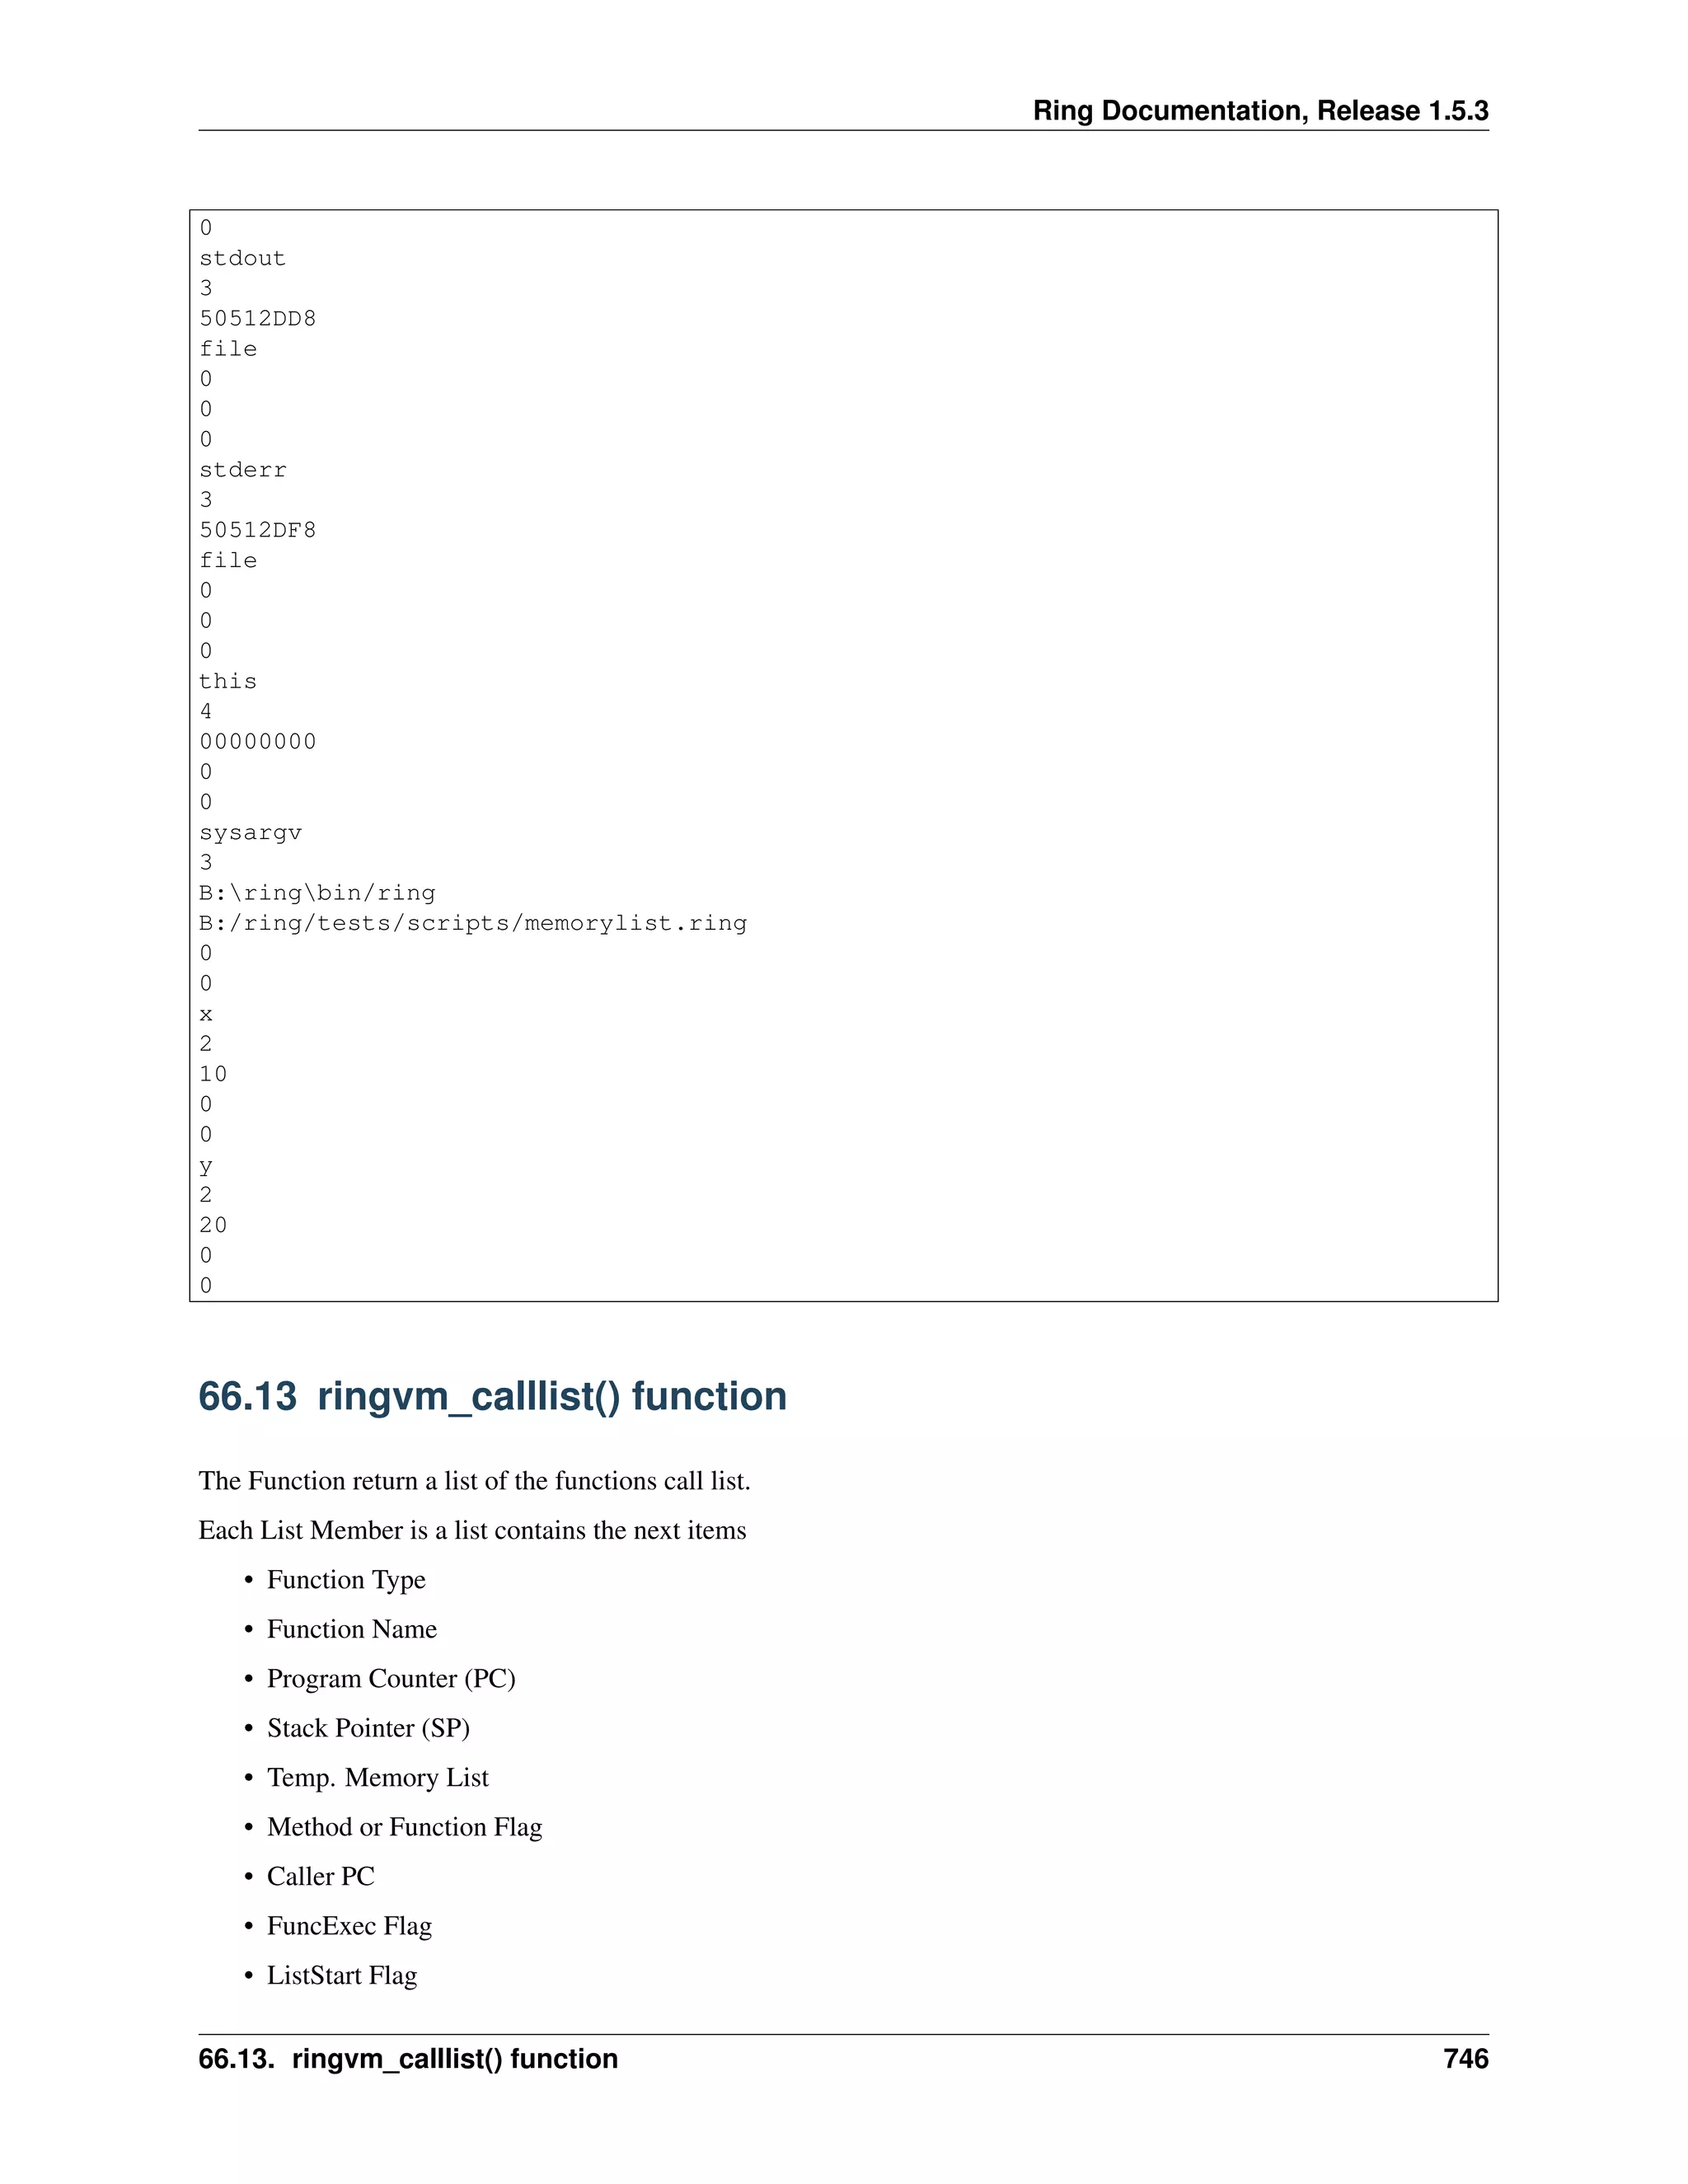
Output:
function hello() in file B:/ring/tests/scripts/calllist.ring
called from line 1
function test() in file B:/ring/tests/scripts/calllist.ring
called from line 3
ringvm_calllist
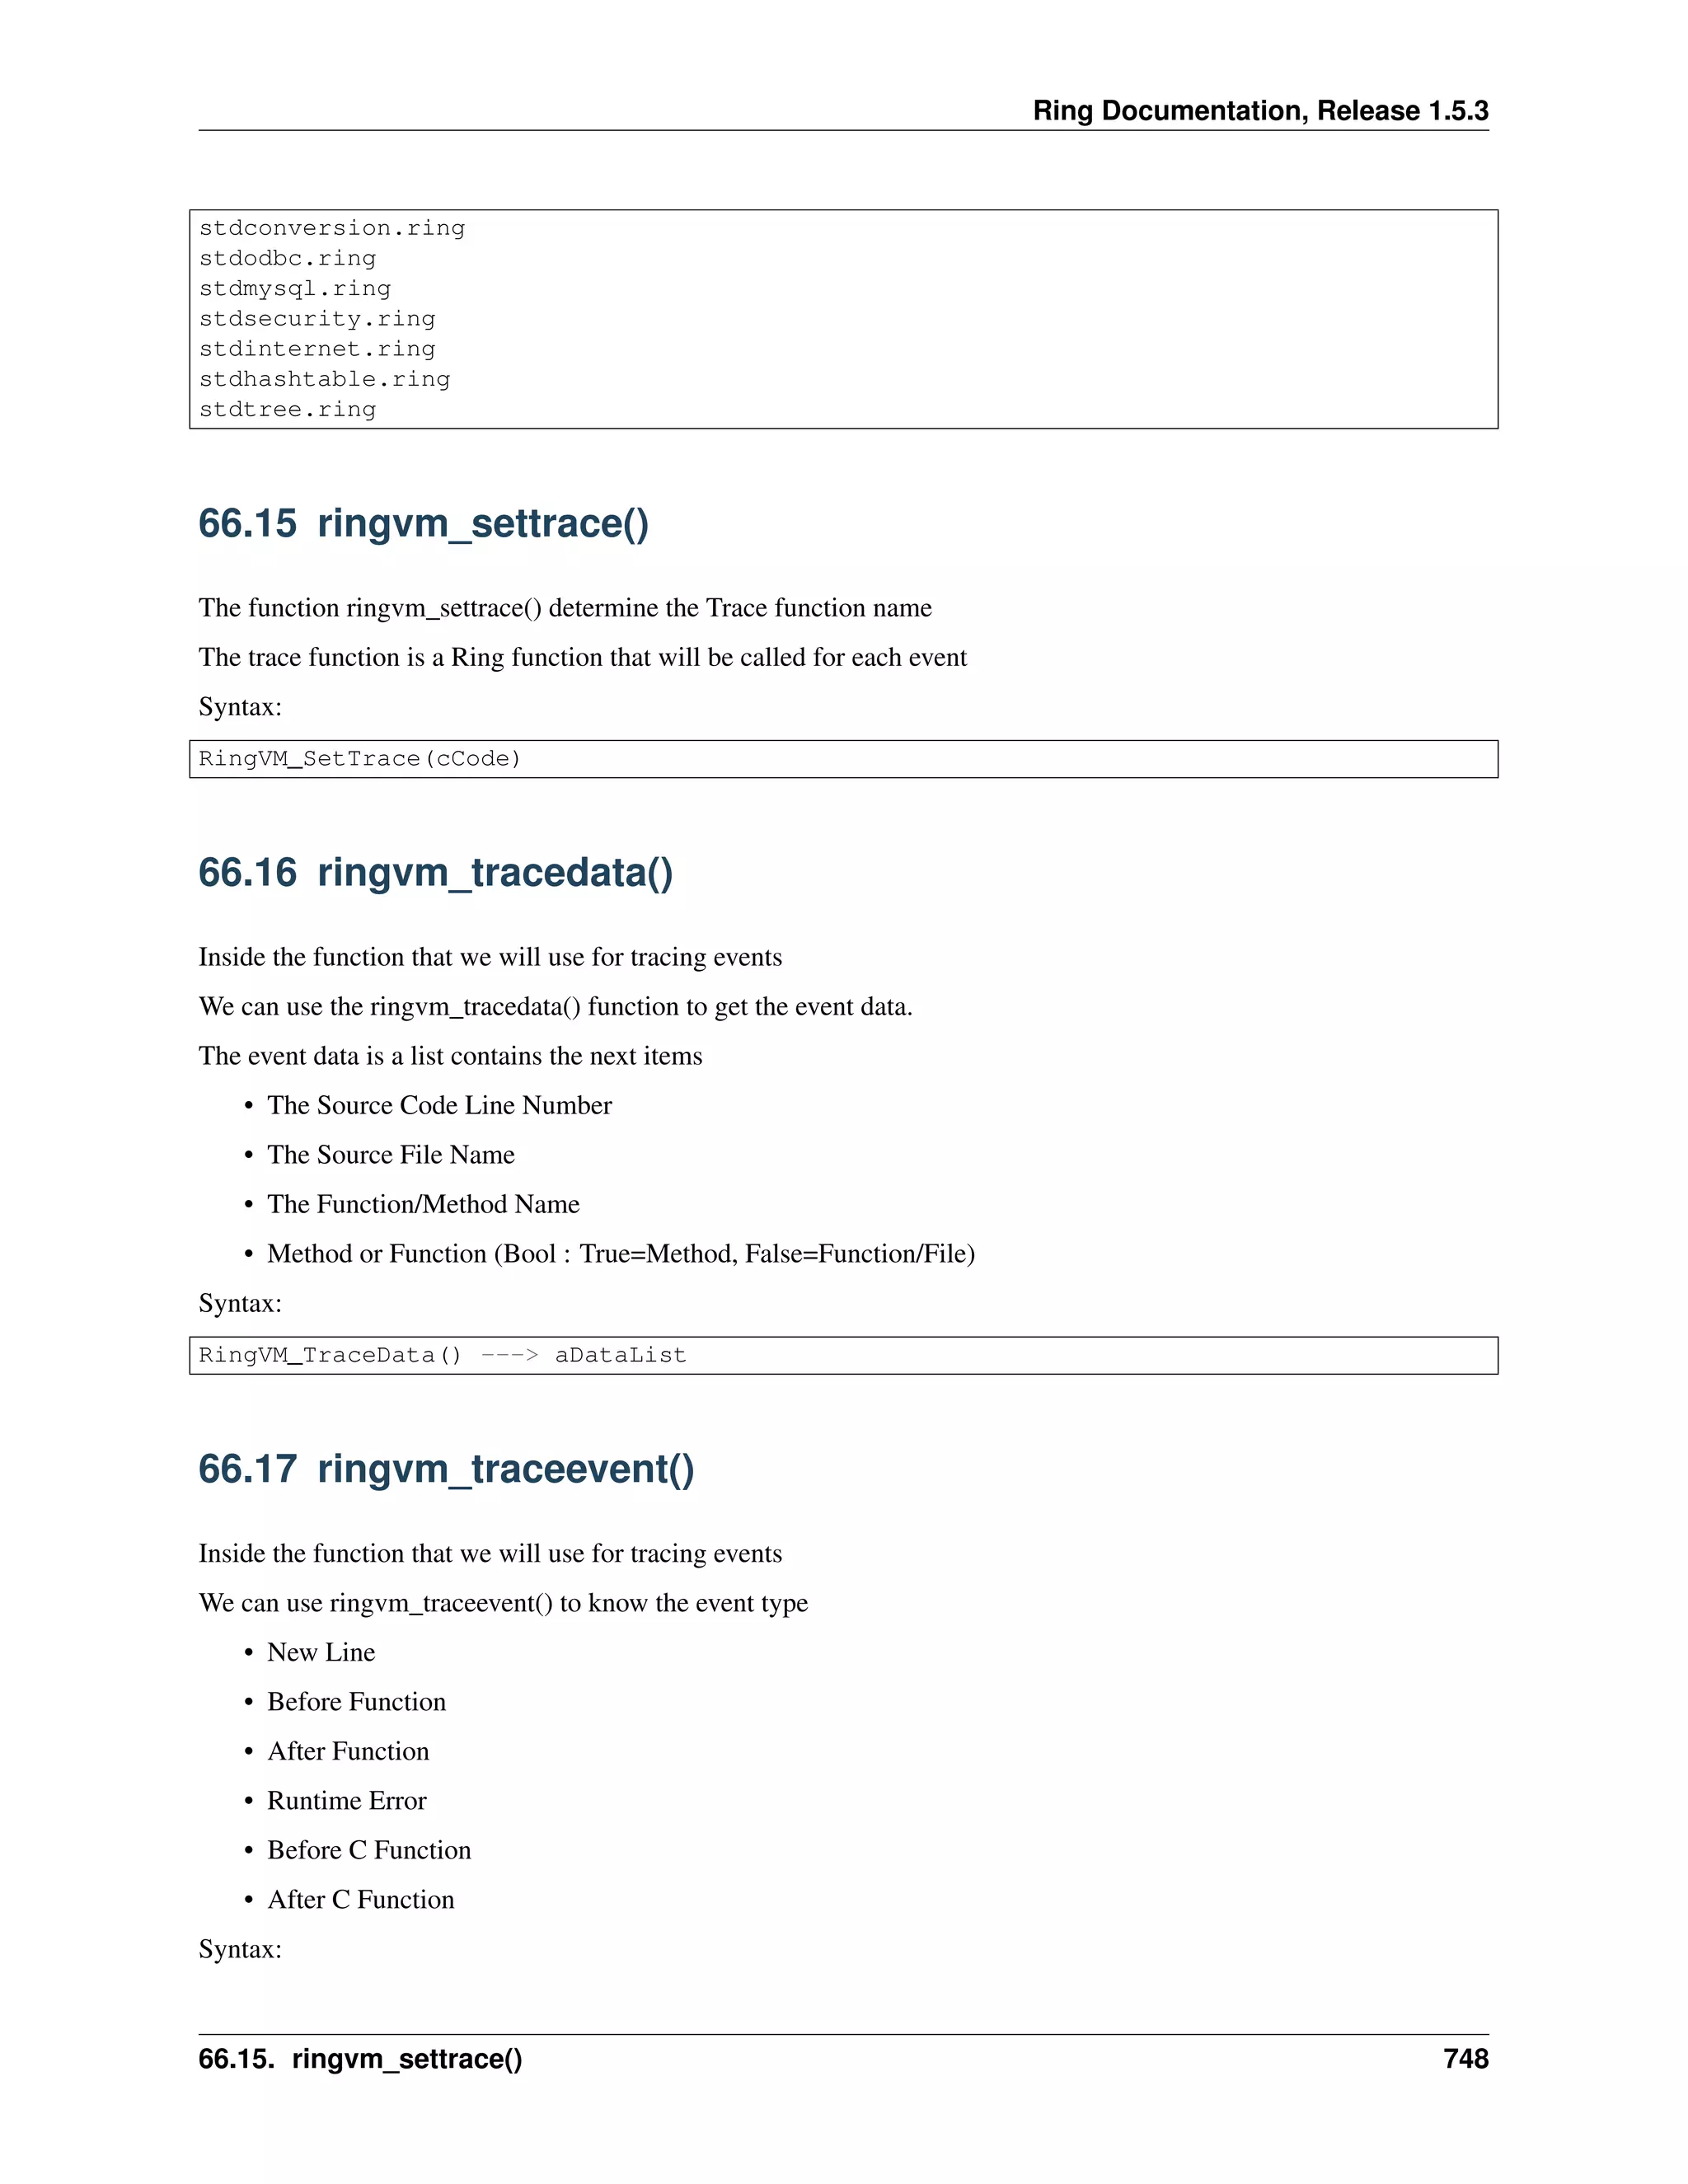
66.14 ringvm_fileslist() function
Function return a list of the Ring Files.
Syntax:
RingVM_FilesList() ---> List
Example:
load "stdlib.ring"
see ringvm_fileslist()
Output:
B:/ring/tests/scripts/fileslist.ring
B:ringbinstdlib.ring
eval
stdlib.ring
stdlib.rh
stdclasses.ring
stdfunctions.ring
stdbase.ring
stdstring.ring
stdlist.ring
stdstack.ring
stdqueue.ring
stdmath.ring
stddatetime.ring
stdfile.ring
stdsystem.ring
stddebug.ring
stddatatype.ring
66.14. ringvm_fileslist() function 747](https://image.slidesharecdn.com/771fayedringdoc1-180328143113/75/The-Ring-programming-language-version-1-5-3-book-Part-88-of-184-3-2048.jpg)
![Ring Documentation, Release 1.5.3
RingVM_HideErrorMsg(lStatus)
66.23 ringvm_callfunc()
We can call a function from a string without using eval() using the ringvm_callfunc()
Syntax:
RingVM_CallFunc(cFuncName)
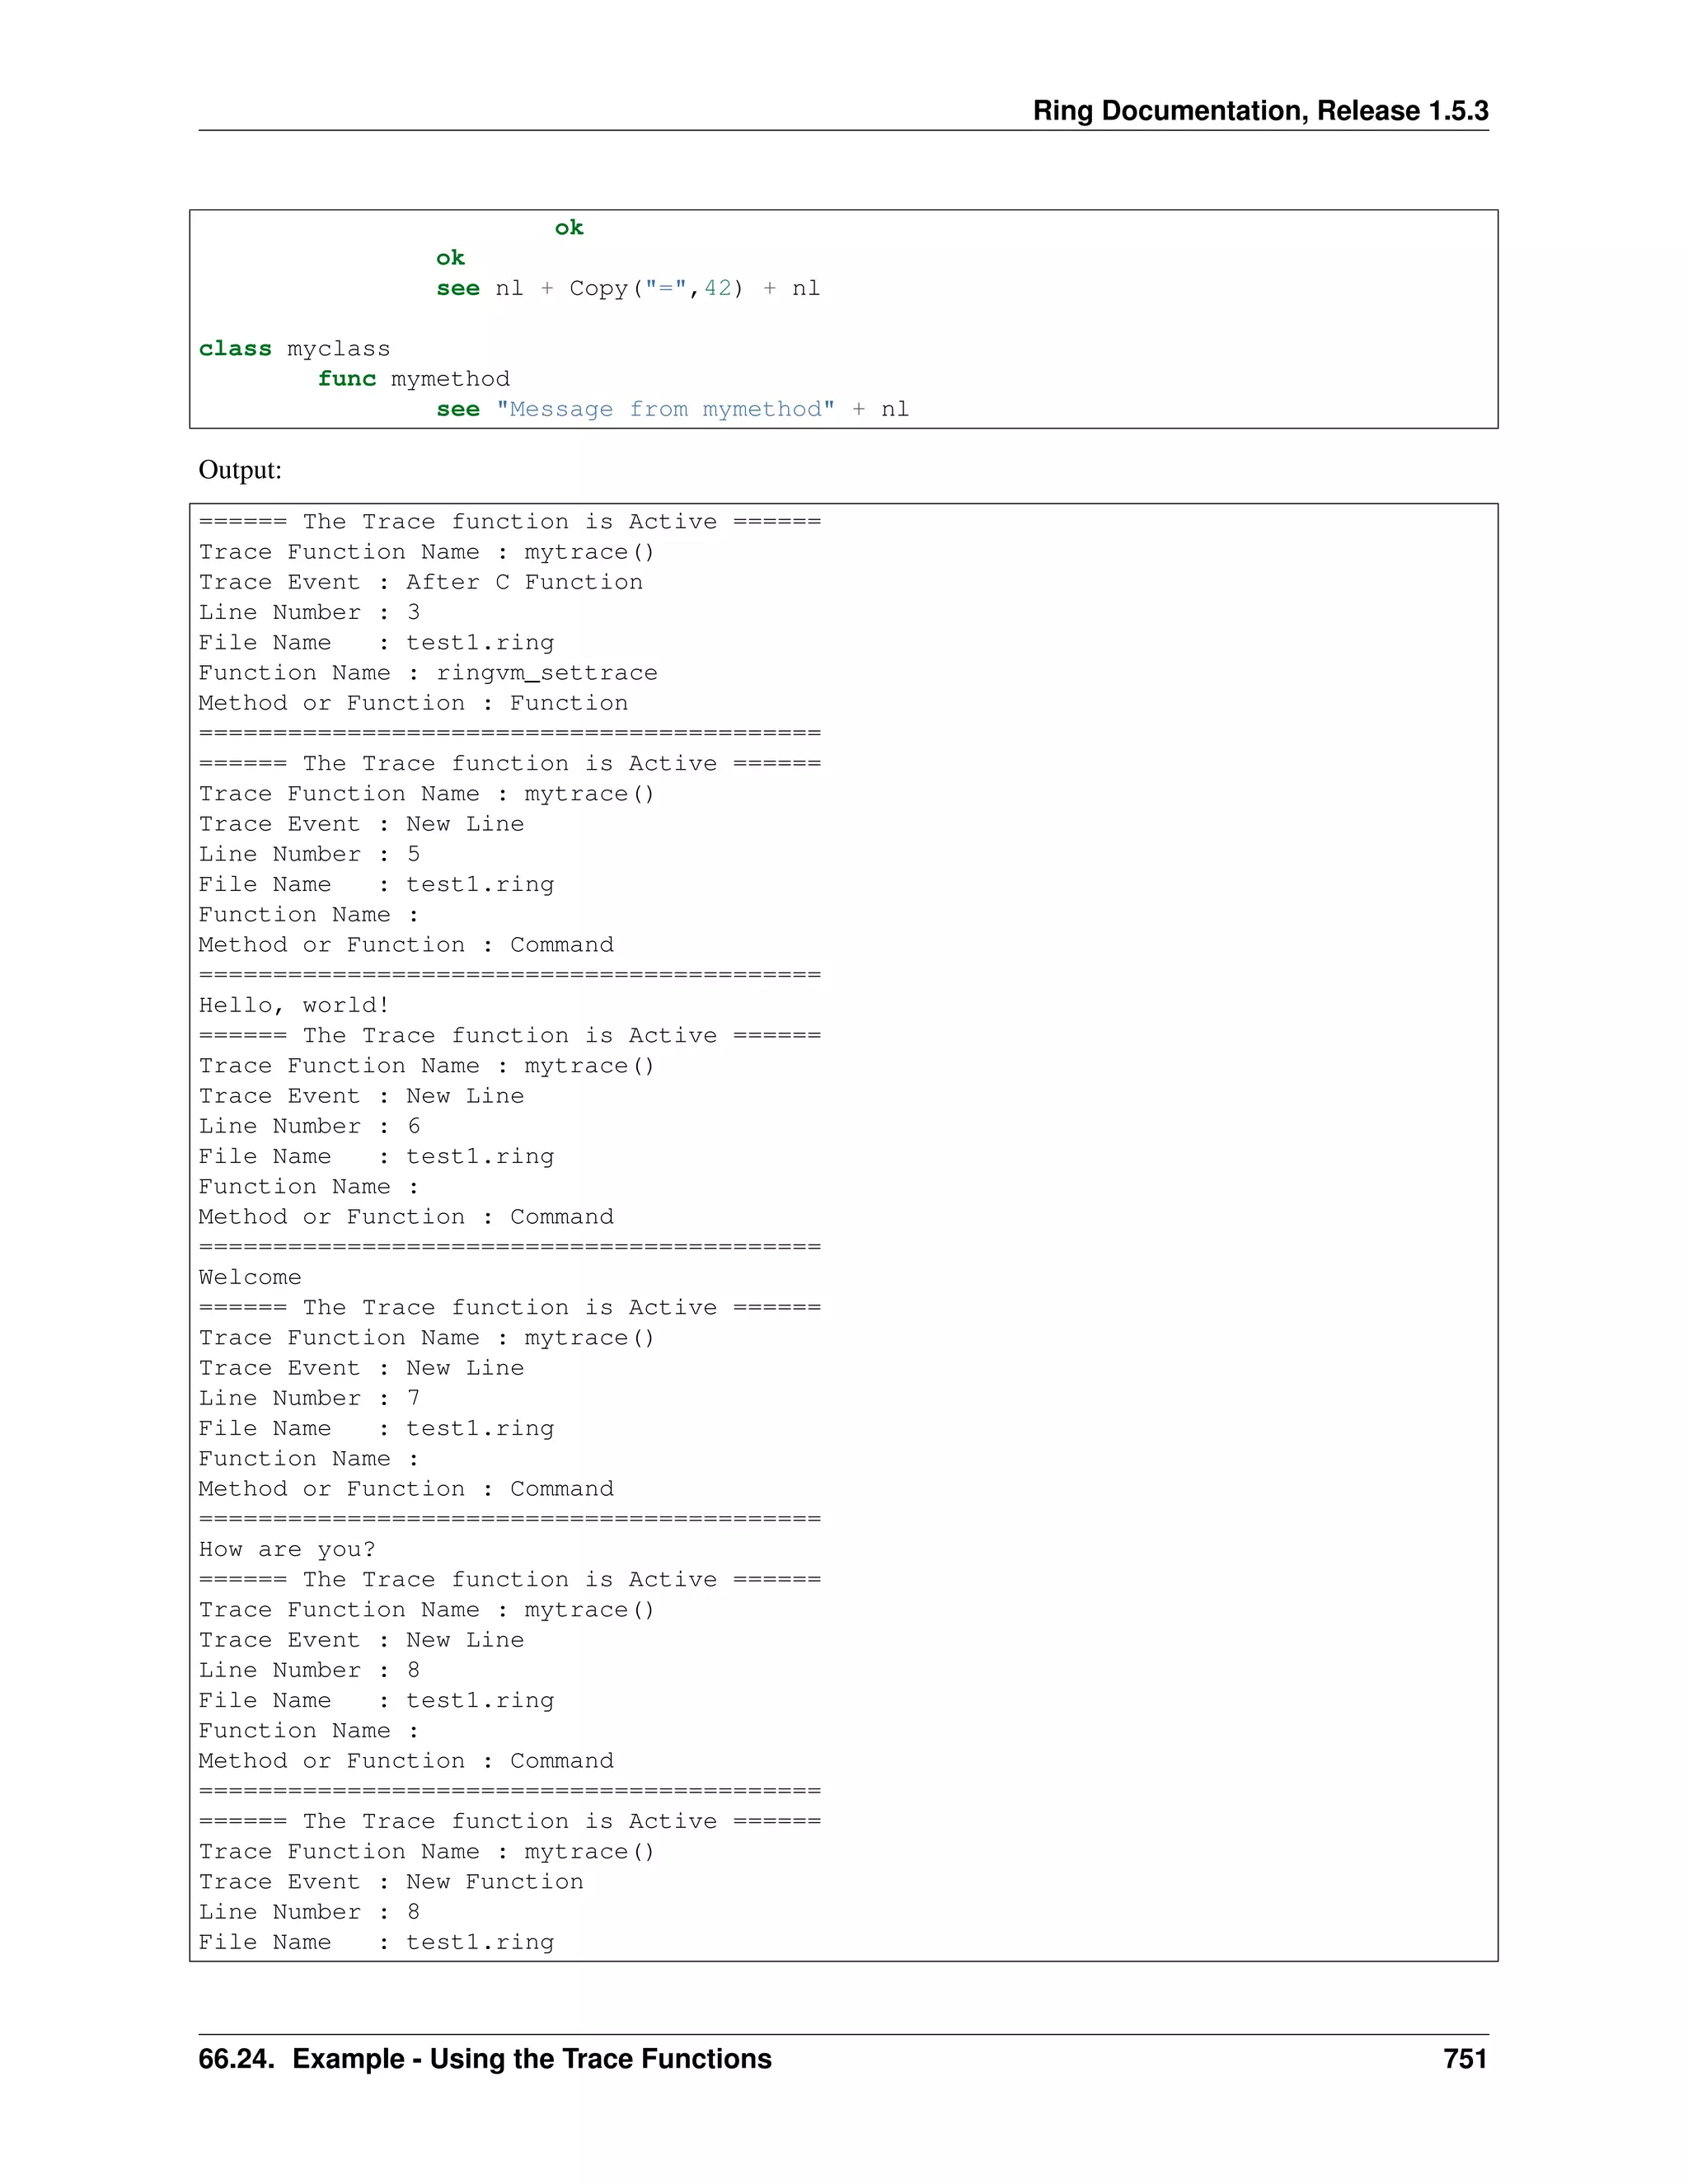
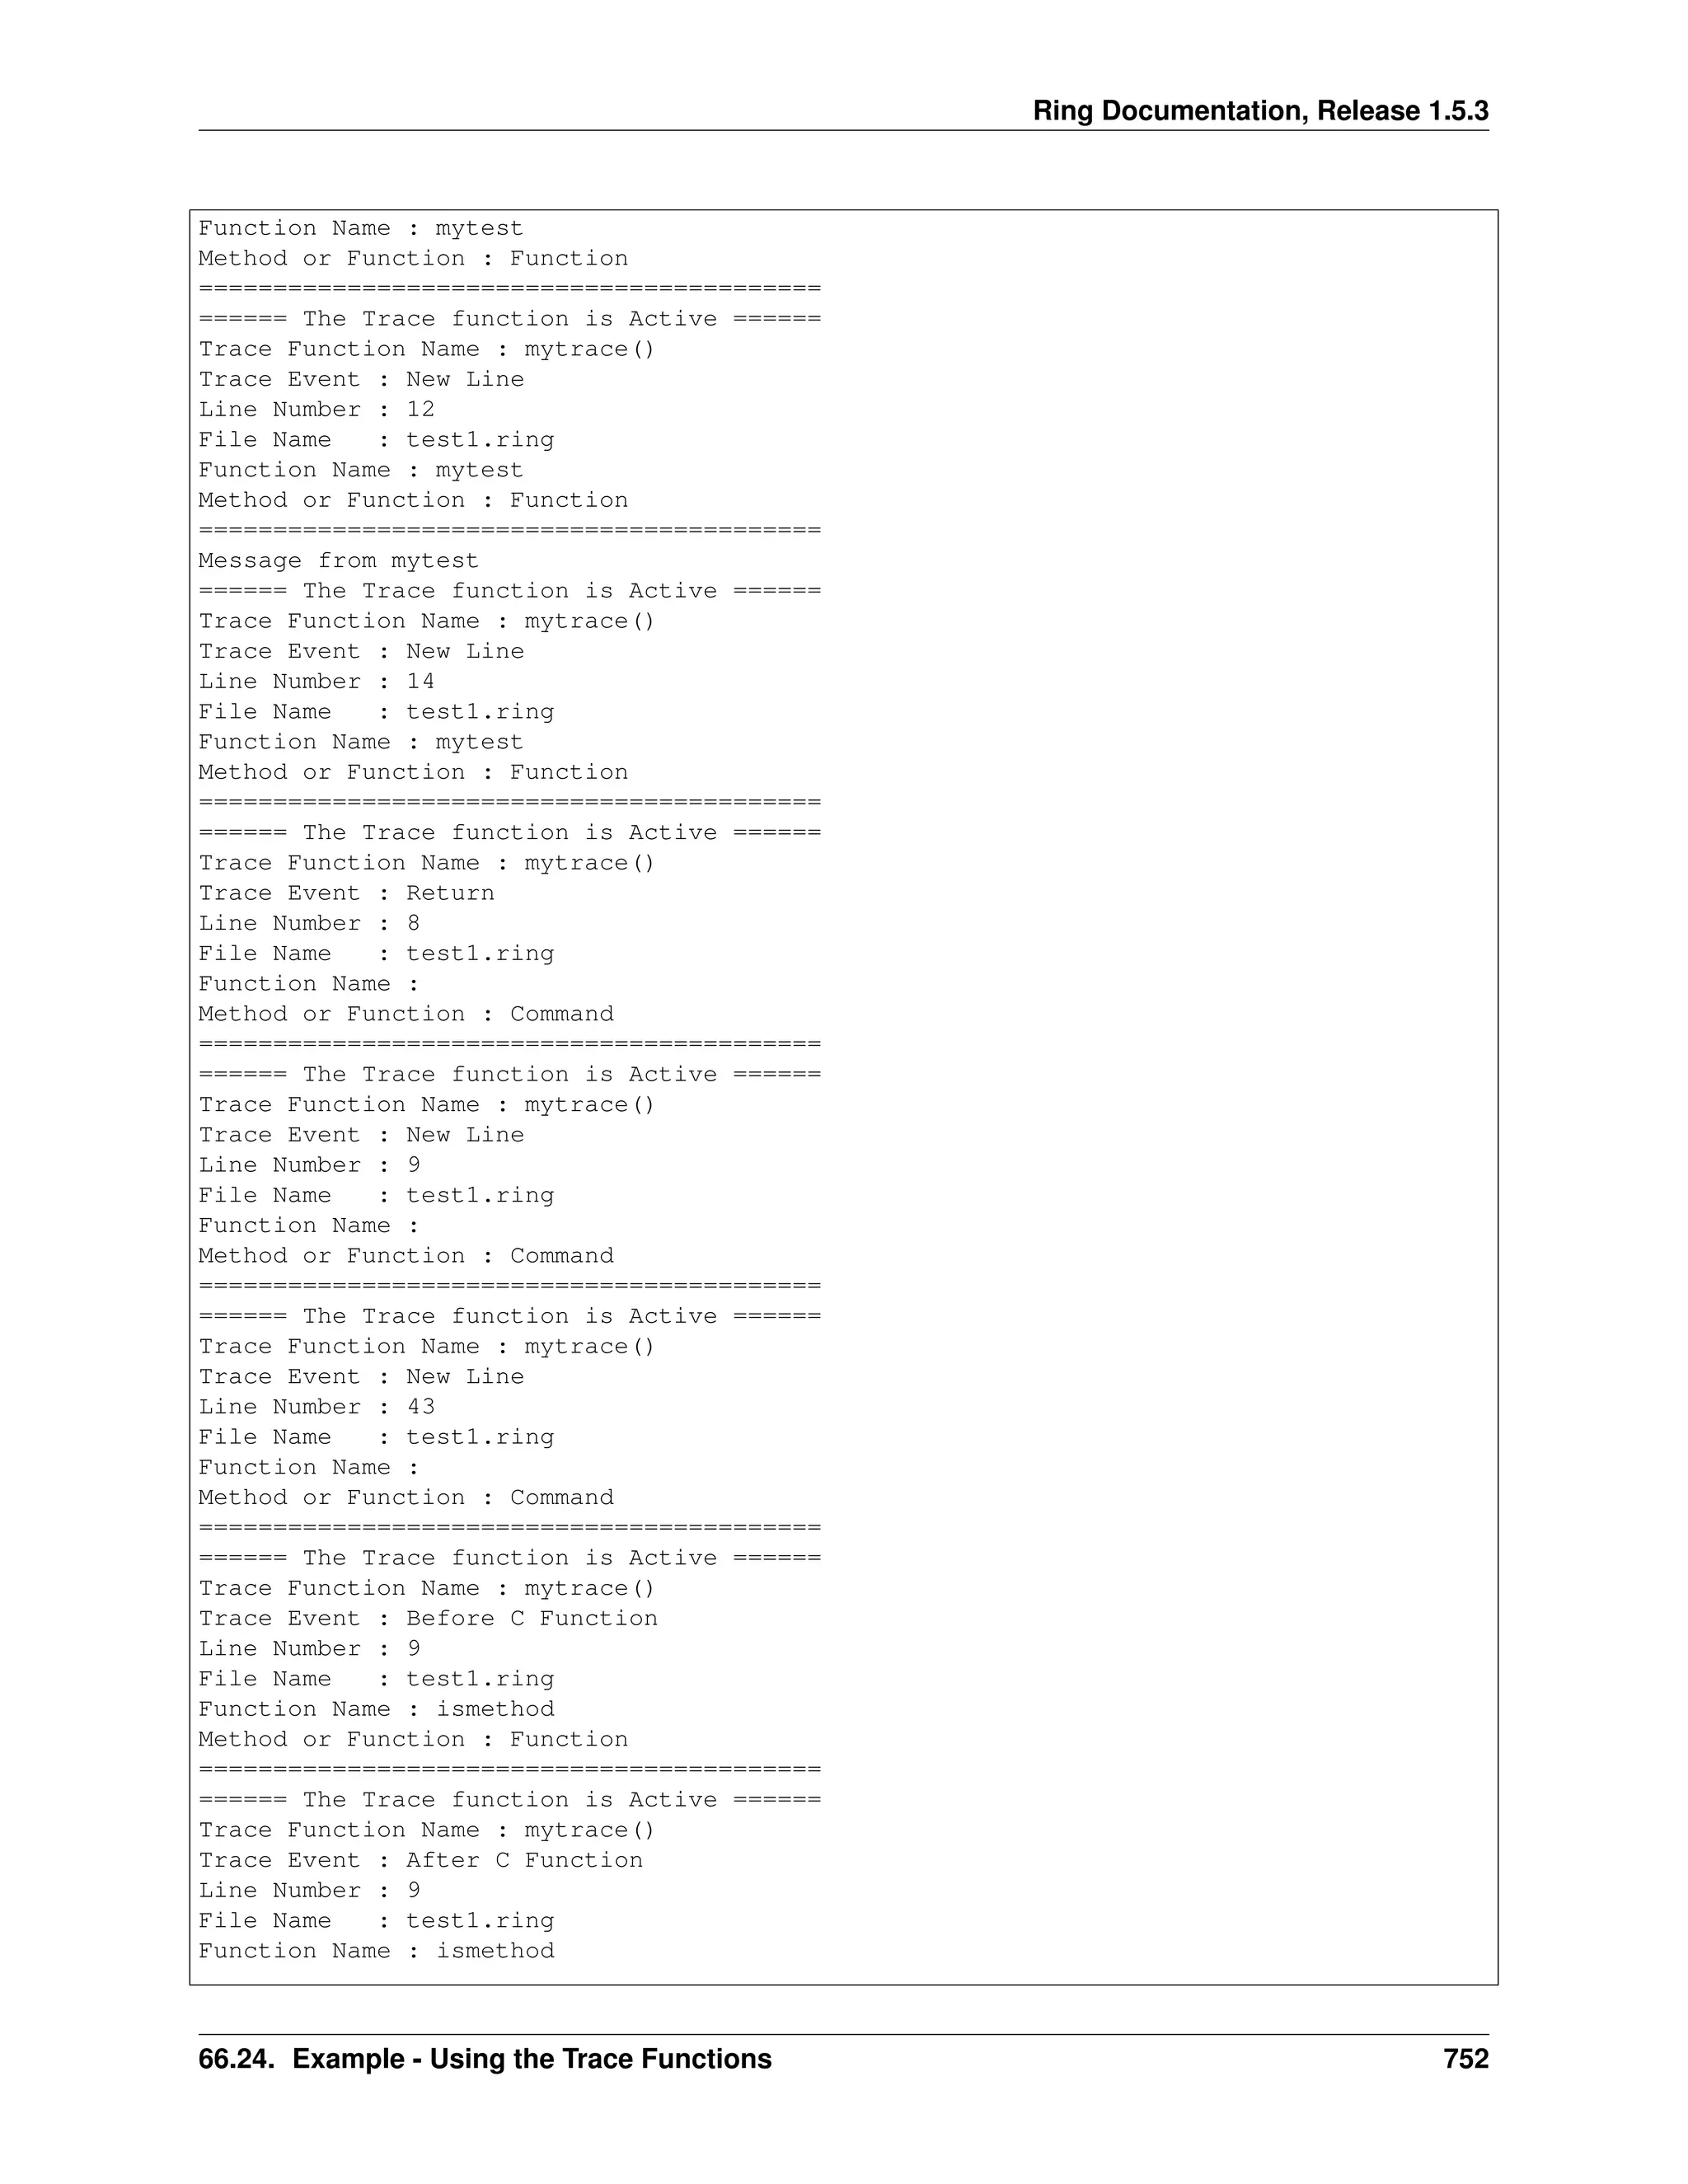
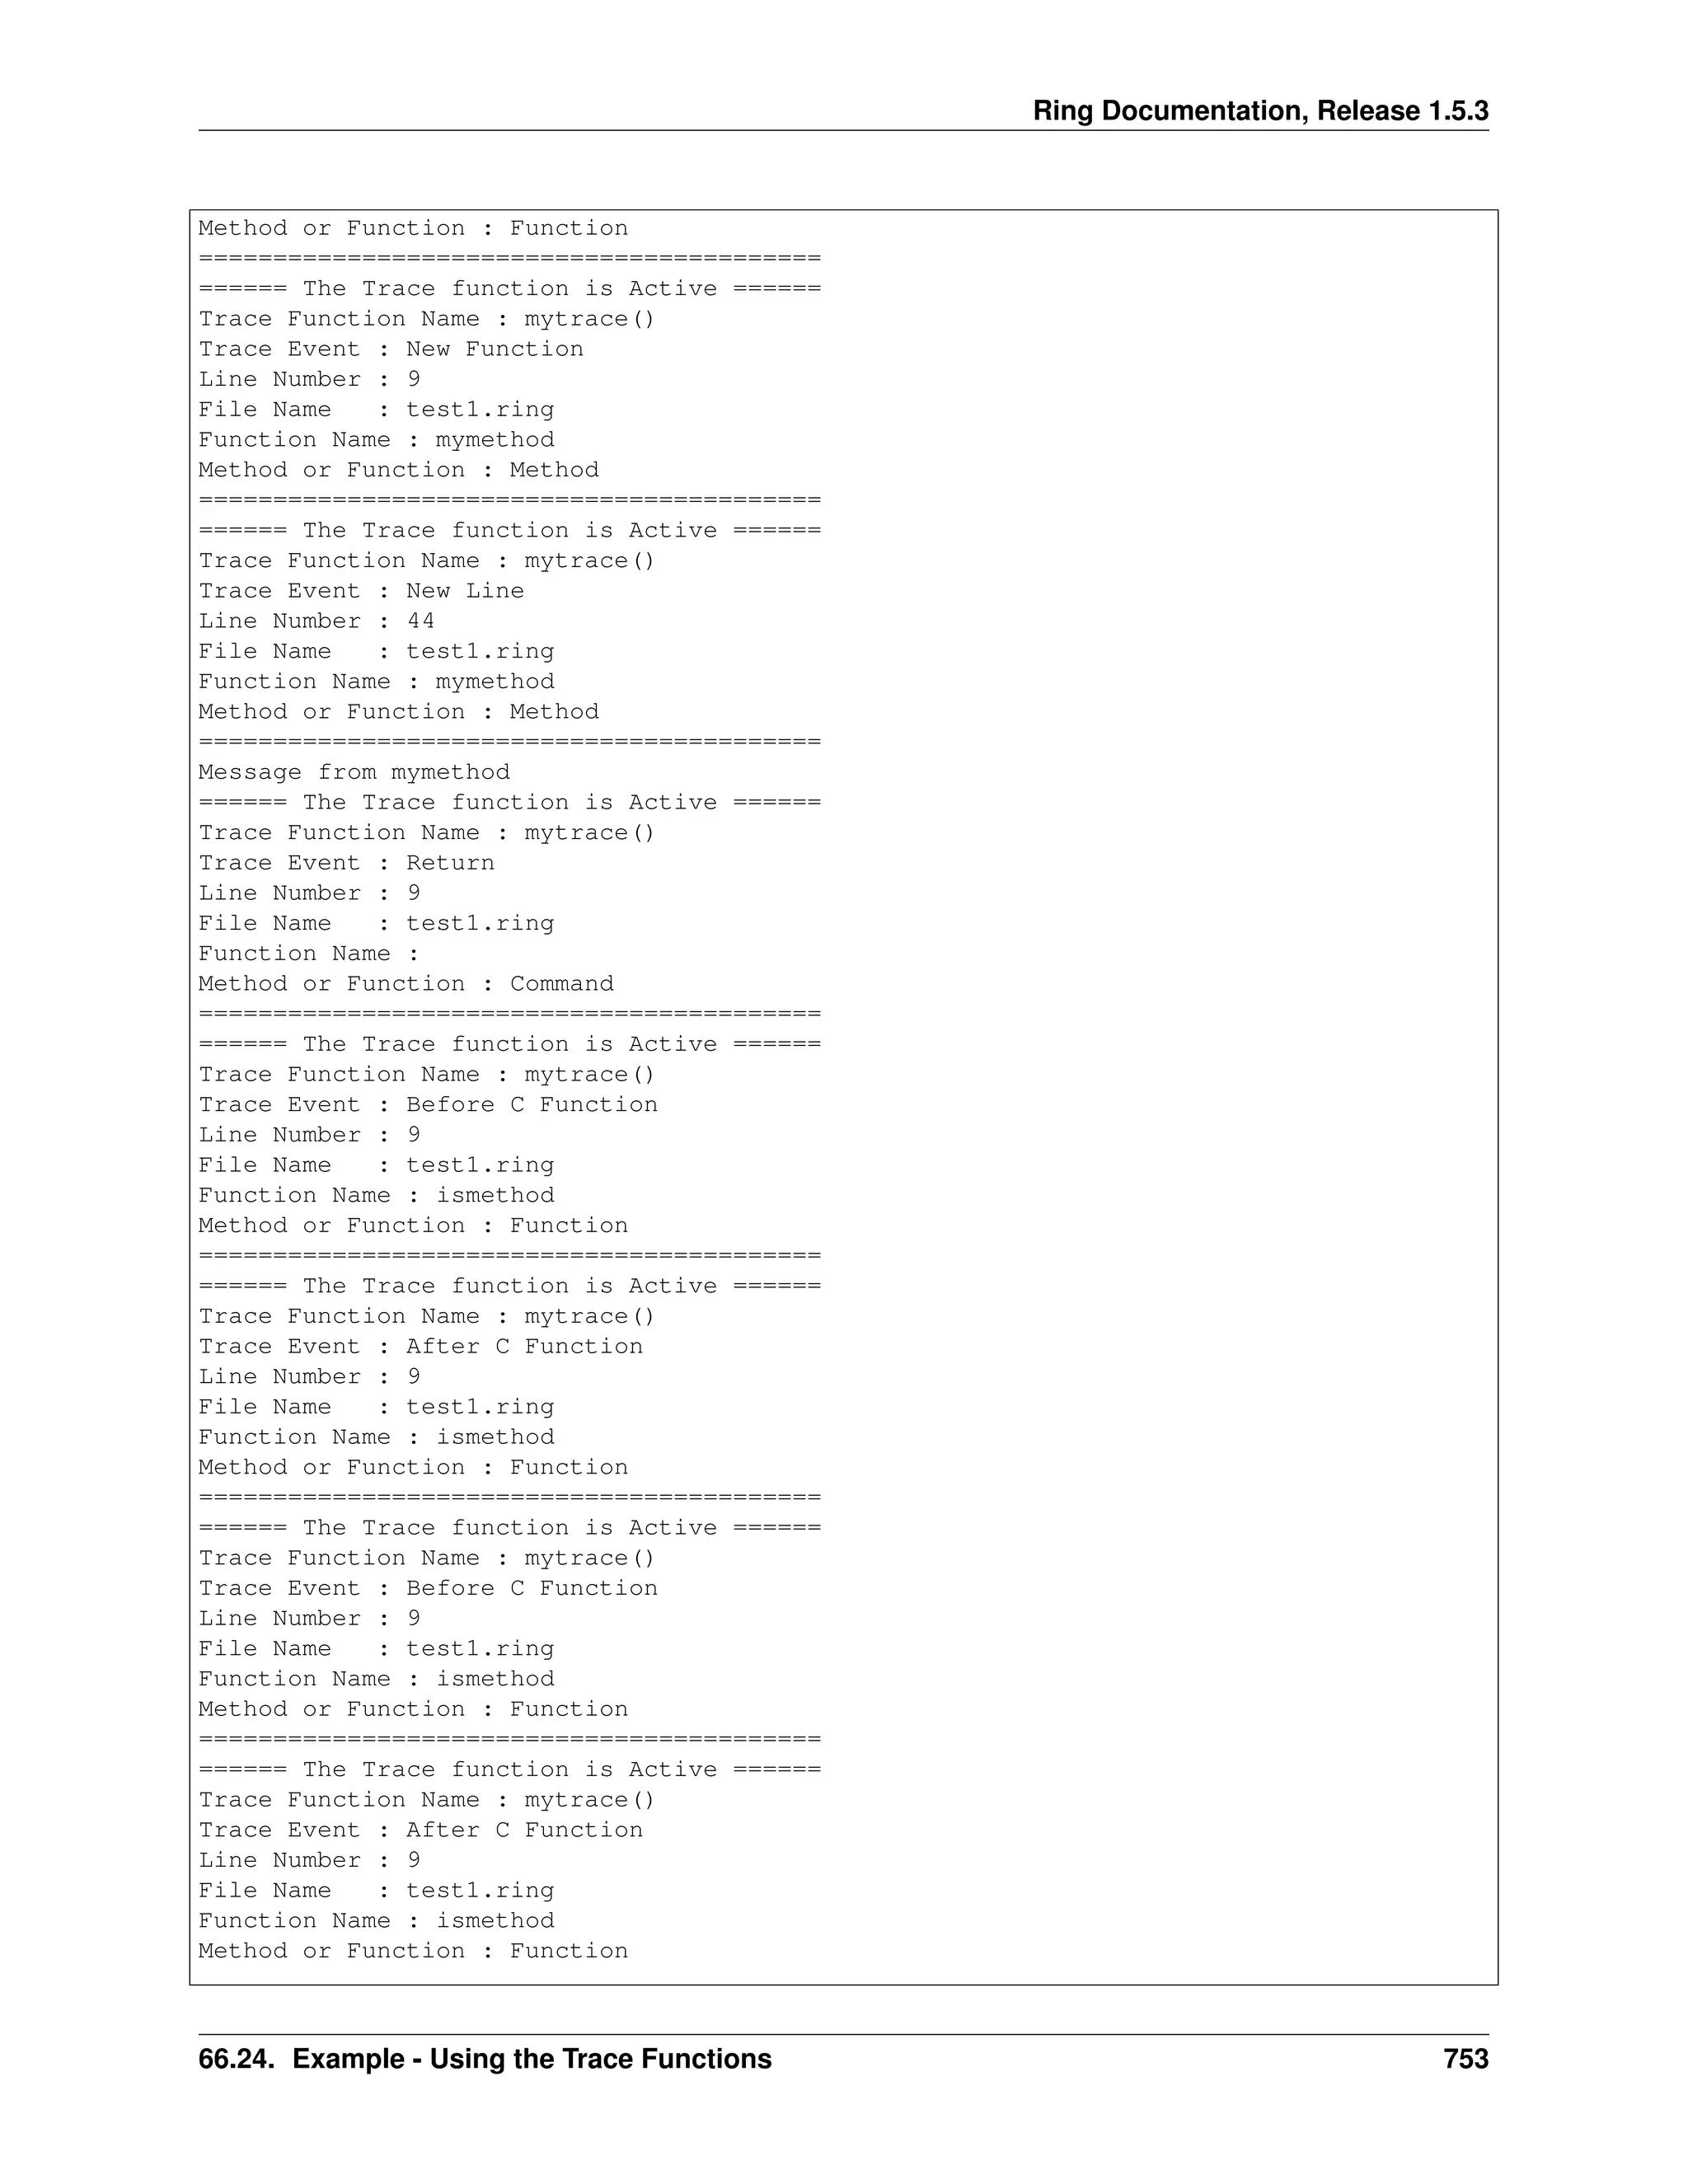
66.24 Example - Using the Trace Functions
The next example use the Trace Functions to trace the program Events!
In practical, We will use the Trace Library instead of these low level functions!
load "tracelib.ring"
ringvm_settrace("mytrace()")
see "Hello, world!" + nl
see "Welcome" + nl
see "How are you?" +nl
mytest()
new myclass { mymethod() }
func mytest
see "Message from mytest" + nl
func mytrace
see "====== The Trace function is Active ======" + nl +
"Trace Function Name : " + ringvm_TraceFunc() + nl +
"Trace Event : "
switch ringvm_TraceEvent()
on TRACEEVENT_NEWLINE see "New Line"
on TRACEEVENT_NEWFUNC see "New Function"
on TRACEEVENT_RETURN see "Return"
on TRACEEVENT_ERROR see "Error"
on TRACEEVENT_BEFORECFUNC see "Before C Function"
on TRACEEVENT_AFTERCFUNC see "After C Function"
off
see nl +
"Line Number : " + ringvm_tracedata()[TRACEDATA_LINENUMBER] + nl +
"File Name : " + ringvm_tracedata()[TRACEDATA_FILENAME] + nl +
"Function Name : " + ringvm_tracedata()[TRACEDATA_FUNCNAME] + nl +
"Method or Function : "
if ringvm_tracedata()[TRACEDATA_METHODORFUNC] =
TRACEDATA_METHODORFUNC_METHOD
see "Method"
else
if ringvm_tracedata()[TRACEDATA_FUNCNAME] = NULL
see "Command"
else
see "Function"
66.23. ringvm_callfunc() 750](https://image.slidesharecdn.com/771fayedringdoc1-180328143113/75/The-Ring-programming-language-version-1-5-3-book-Part-88-of-184-6-2048.jpg)
![Ring Documentation, Release 1.5.3
==========================================
====== The Trace function is Active ======
Trace Function Name : mytrace()
Trace Event : New Line
Line Number : 11
File Name : test1.ring
Function Name :
Method or Function : Command
==========================================
66.25 Example - The Trace Library
The next example uses the Trace functions provided by the Ring language to create the Trace library.
Using the Trace library we have nice Tracing tools and Interaction debugger too.
# Trace Events
TRACEEVENT_NEWLINE = 1
TRACEEVENT_NEWFUNC = 2
TRACEEVENT_RETURN = 3
TRACEEVENT_ERROR = 4
TRACEEVENT_BEFORECFUNC = 5
TRACEEVENT_AFTERCFUNC = 6
# Trace Data
TRACEDATA_LINENUMBER = 1
TRACEDATA_FILENAME = 2
TRACEDATA_FUNCNAME = 3
TRACEDATA_METHODORFUNC = 4
# Method of Function
TRACEDATA_METHODORFUNC_METHOD = TRUE
TRACEDATA_METHODORFUNC_NOTMETHOD = FALSE
TRACE_BREAKPOINTS = TRUE
TRACE_TEMPLIST = []
func Trace cType
switch trim(lower(cType))
on :AllEvents
ringvm_settrace("TraceLib_AllEvents()")
on :Functions
ringvm_settrace("TraceLib_Functions()")
on :PassError
ringvm_settrace("TraceLib_PassError()")
on :Debugger
ringvm_settrace("TraceLib_Debugger()")
on :LineByLine
ringvm_settrace("TraceLib_LineByLine()")
off
func TraceLib_AllEvents
if right(ringvm_tracedata()[TRACEDATA_FILENAME],13) = "tracelib.ring"
return
ok
see "====== The Trace function is Active ======" + nl +
66.25. Example - The Trace Library 754](https://image.slidesharecdn.com/771fayedringdoc1-180328143113/75/The-Ring-programming-language-version-1-5-3-book-Part-88-of-184-10-2048.jpg)

This document describes various functions in the Ring programming language that provide debugging and tracing capabilities. It discusses functions like ringvm_memorylist(), ringvm_calllist(), ringvm_fileslist() which provide information about memory, function calls and loaded files. It also covers functions like ringvm_settrace(), ringvm_tracedata(), ringvm_traceevent() that allow setting a trace function and getting trace data within that function to trace program execution. An example at the end demonstrates using these functions to implement a trace library for Ring.


