Download as PDF, PPTX


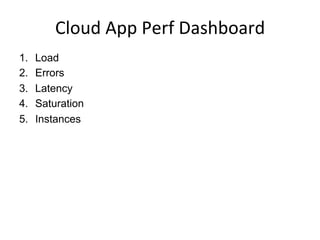
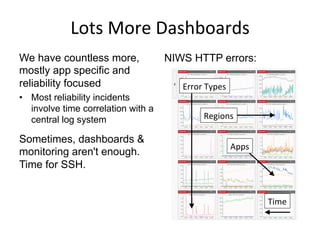
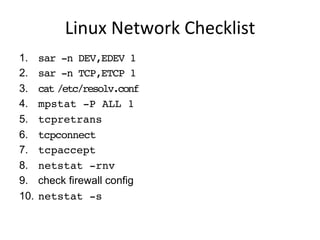
![PRE
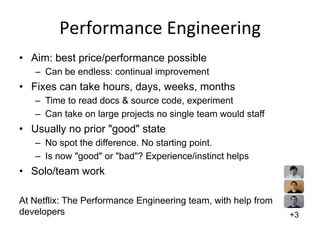
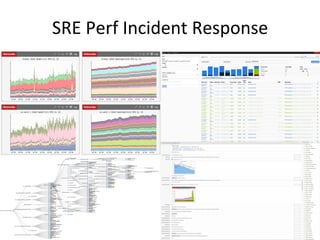
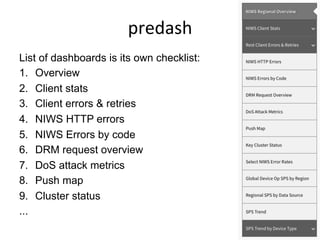
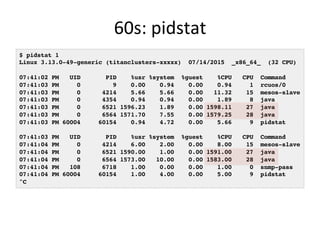
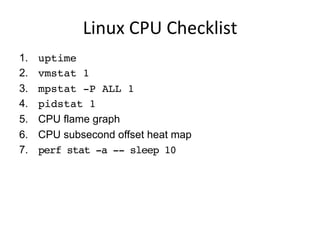
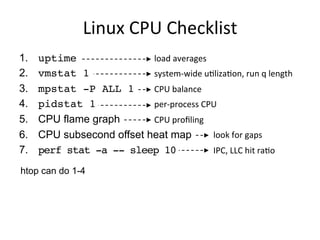
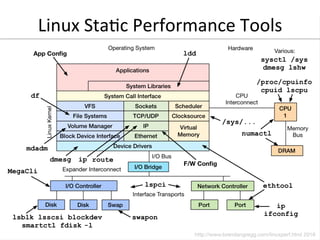
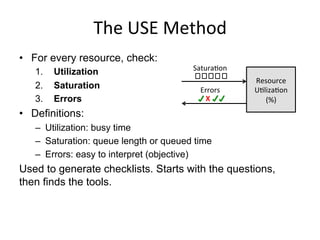
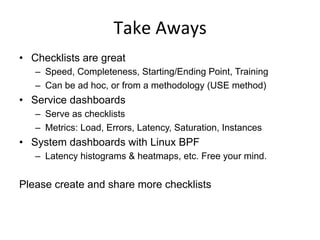
Triage
Checklist
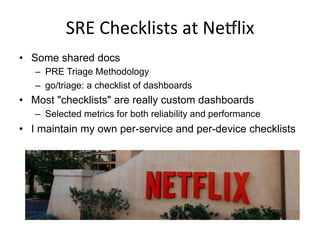
• Performance and Reliability Engineering checklist
– Shared doc with a hierarchal checklist with 66 steps total
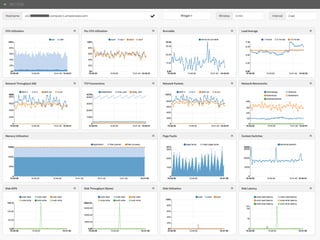
1. Initial Impact
1. record timestamp
2. quantify: SPS, signups, support calls
3. check impact: regional or global?
4. check devices: device specific?
2. Time Correlations
1. pretriage dashboard
1. check for suspect NIWS client: error rates
2. check for source of error/request rate change
3. […dashboard specifics…]
Confirms, quantifies,
& narrows problem.
Helps you reason
about the cause.](https://image.slidesharecdn.com/srecon2016perfchecklists-160409004953/85/SREcon-2016-Performance-Checklists-for-SREs-17-320.jpg)
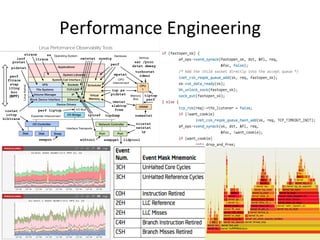
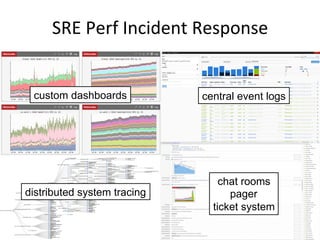
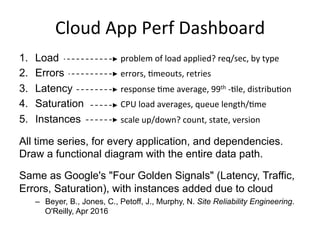
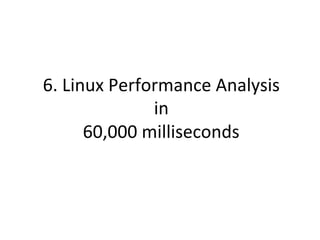
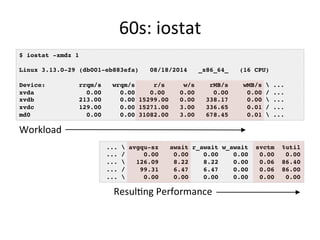
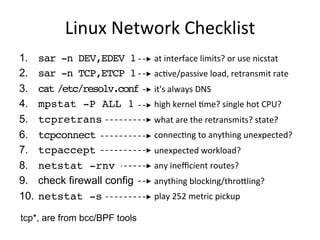
![PRE
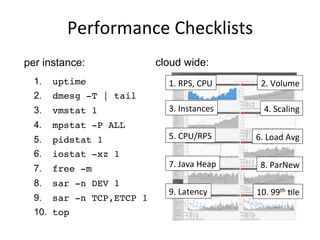
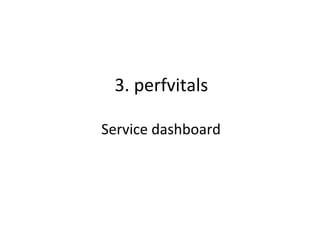
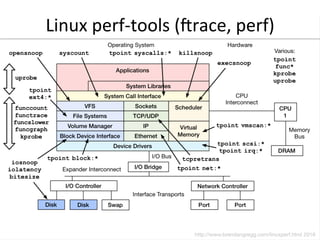
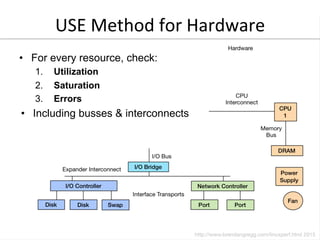
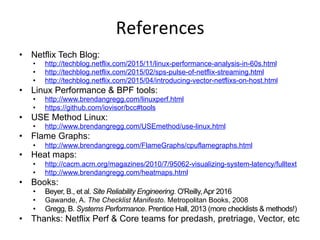
Triage
Checklist.
cont.
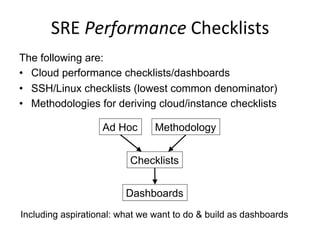
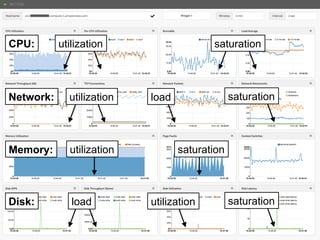
• 3. Evaluate Service Health
– perfvitals dashboard
– mogul dependency correlation
– by cluster/asg/node:
• latency: avg, 90 percentile
• request rate
• CPU: utilization, sys/user
• Java heap: GC rate, leaks
• memory
• load average
• thread contention (from Java)
• JVM crashes
• network: tput, sockets
• […]
custom dashboards](https://image.slidesharecdn.com/srecon2016perfchecklists-160409004953/85/SREcon-2016-Performance-Checklists-for-SREs-18-320.jpg)
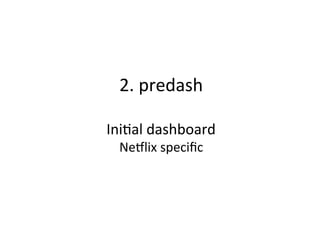
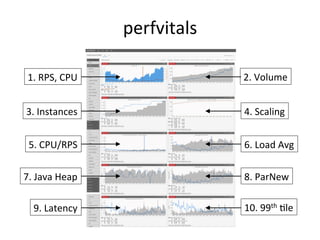
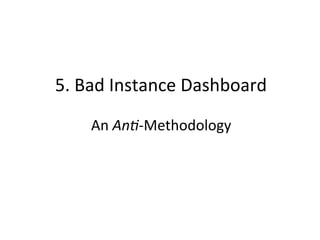
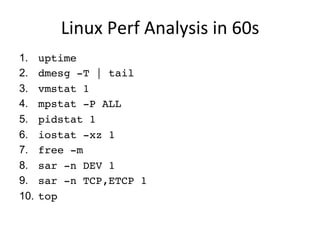
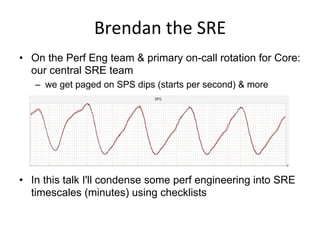
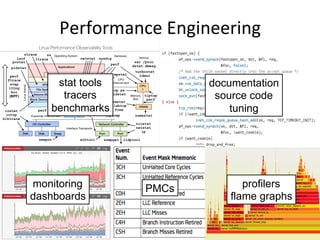
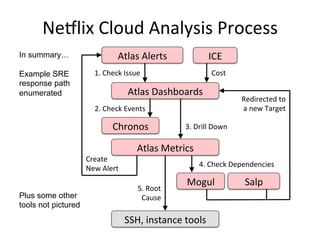
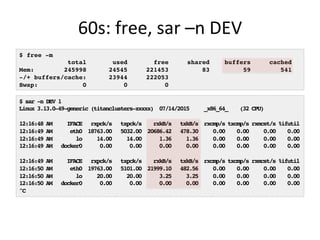
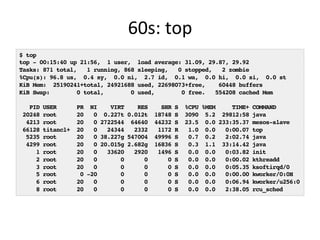
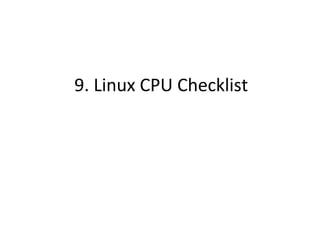
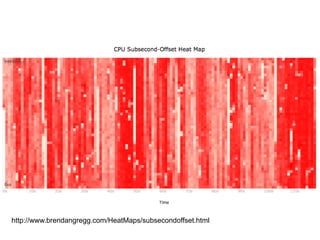
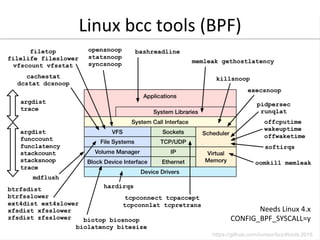
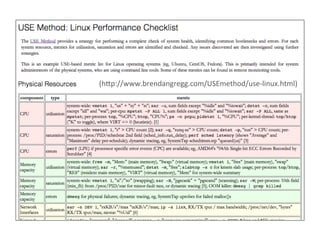
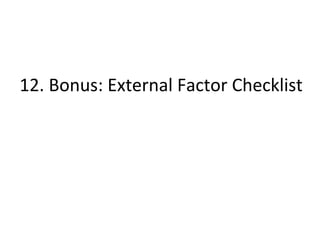
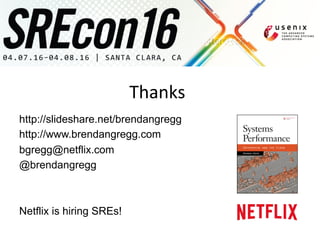
![60s:
upQme,
dmesg,
vmstat
$ uptime
23:51:26 up 21:31, 1 user, load average: 30.02, 26.43, 19.02
$ dmesg | tail
[1880957.563150] perl invoked oom-killer: gfp_mask=0x280da, order=0, oom_score_adj=0
[...]
[1880957.563400] Out of memory: Kill process 18694 (perl) score 246 or sacrifice child
[1880957.563408] Killed process 18694 (perl) total-vm:1972392kB, anon-rss:1953348kB, file-rss:0kB
[2320864.954447] TCP: Possible SYN flooding on port 7001. Dropping request. Check SNMP counters.
$ vmstat 1
procs ---------memory---------- ---swap-- -----io---- -system-- ------cpu-----
r b swpd free buff cache si so bi bo in cs us sy id wa st
34 0 0 200889792 73708 591828 0 0 0 5 6 10 96 1 3 0 0
32 0 0 200889920 73708 591860 0 0 0 592 13284 4282 98 1 1 0 0
32 0 0 200890112 73708 591860 0 0 0 0 9501 2154 99 1 0 0 0
32 0 0 200889568 73712 591856 0 0 0 48 11900 2459 99 0 0 0 0
32 0 0 200890208 73712 591860 0 0 0 0 15898 4840 98 1 1 0 0
^C](https://image.slidesharecdn.com/srecon2016perfchecklists-160409004953/85/SREcon-2016-Performance-Checklists-for-SREs-33-320.jpg)
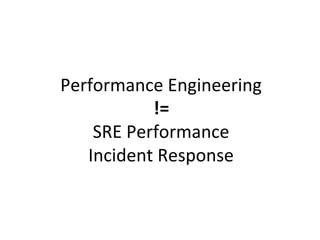
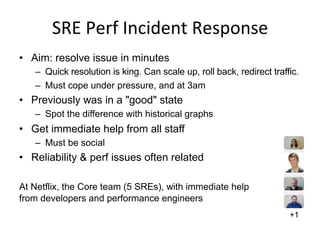
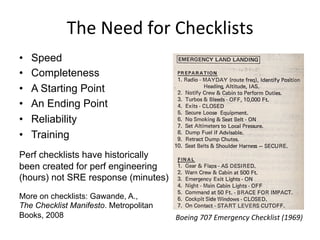
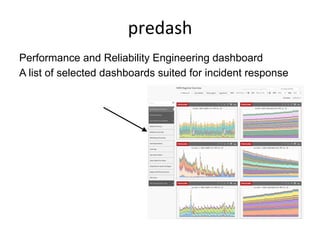
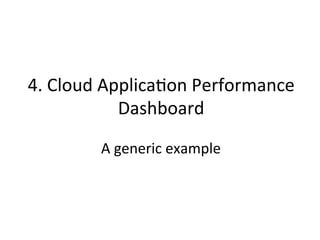
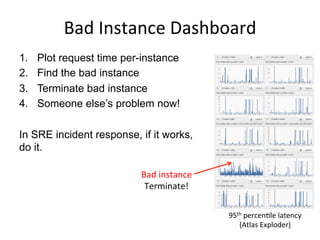
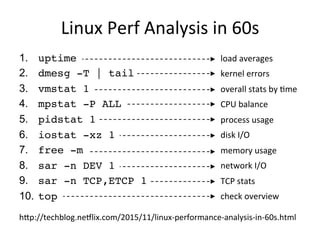
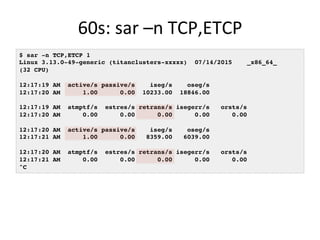
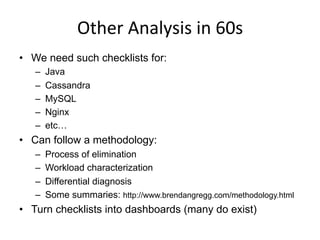
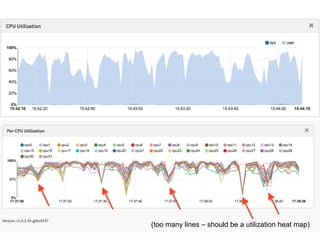
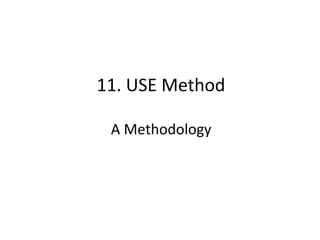
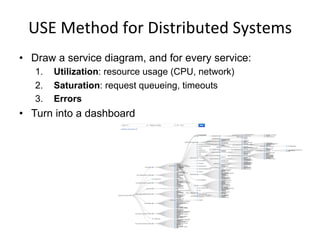
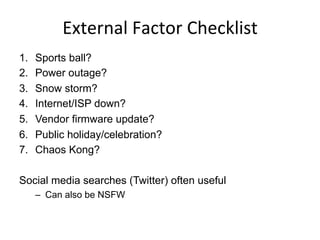
![60s:
mpstat
$ mpstat -P ALL 1
Linux 3.13.0-49-generic (titanclusters-xxxxx) 07/14/2015 _x86_64_ (32 CPU)
07:38:49 PM CPU %usr %nice %sys %iowait %irq %soft %steal %guest %gnice %idle
07:38:50 PM all 98.47 0.00 0.75 0.00 0.00 0.00 0.00 0.00 0.00 0.78
07:38:50 PM 0 96.04 0.00 2.97 0.00 0.00 0.00 0.00 0.00 0.00 0.99
07:38:50 PM 1 97.00 0.00 1.00 0.00 0.00 0.00 0.00 0.00 0.00 2.00
07:38:50 PM 2 98.00 0.00 1.00 0.00 0.00 0.00 0.00 0.00 0.00 1.00
07:38:50 PM 3 96.97 0.00 0.00 0.00 0.00 0.00 0.00 0.00 0.00 3.03
[...]](https://image.slidesharecdn.com/srecon2016perfchecklists-160409004953/85/SREcon-2016-Performance-Checklists-for-SREs-34-320.jpg)
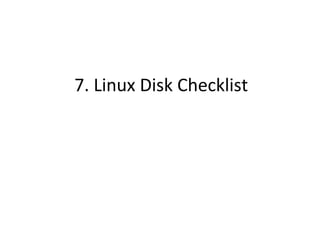
![ext4slower
• ext4 operations slower than the threshold:
• Better indicator of application pain than disk I/O
• Measures & filters in-kernel for efficiency using BPF
– From https://github.com/iovisor/bcc
# ./ext4slower 1
Tracing ext4 operations slower than 1 ms
TIME COMM PID T BYTES OFF_KB LAT(ms) FILENAME
06:49:17 bash 3616 R 128 0 7.75 cksum
06:49:17 cksum 3616 R 39552 0 1.34 [
06:49:17 cksum 3616 R 96 0 5.36 2to3-2.7
06:49:17 cksum 3616 R 96 0 14.94 2to3-3.4
06:49:17 cksum 3616 R 10320 0 6.82 411toppm
06:49:17 cksum 3616 R 65536 0 4.01 a2p
06:49:17 cksum 3616 R 55400 0 8.77 ab
06:49:17 cksum 3616 R 36792 0 16.34 aclocal-1.14
06:49:17 cksum 3616 R 15008 0 19.31 acpi_listen
[…]](https://image.slidesharecdn.com/srecon2016perfchecklists-160409004953/85/SREcon-2016-Performance-Checklists-for-SREs-45-320.jpg)

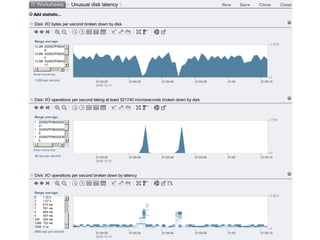
![tcpretrans
• Just trace kernel TCP retransmit functions for efficiency:
• From either bcc (BPF) or perf-tools (ftrace, older kernels)
# ./tcpretrans
TIME PID IP LADDR:LPORT T> RADDR:RPORT STATE
01:55:05 0 4 10.153.223.157:22 R> 69.53.245.40:34619 ESTABLISHED
01:55:05 0 4 10.153.223.157:22 R> 69.53.245.40:34619 ESTABLISHED
01:55:17 0 4 10.153.223.157:22 R> 69.53.245.40:22957 ESTABLISHED
[…]](https://image.slidesharecdn.com/srecon2016perfchecklists-160409004953/85/SREcon-2016-Performance-Checklists-for-SREs-51-320.jpg)
![$ perf script
[…]
java 14327 [022] 252764.179741: cycles: 7f36570a4932 SpinPause (/usr/lib/jvm/java-8
java 14315 [014] 252764.183517: cycles: 7f36570a4932 SpinPause (/usr/lib/jvm/java-8
java 14310 [012] 252764.185317: cycles: 7f36570a4932 SpinPause (/usr/lib/jvm/java-8
java 14332 [015] 252764.188720: cycles: 7f3658078350 pthread_cond_wait@@GLIBC_2.3.2
java 14341 [019] 252764.191307: cycles: 7f3656d150c8 ClassLoaderDataGraph::do_unloa
java 14341 [019] 252764.198825: cycles: 7f3656d140b8 ClassLoaderData::free_dealloca
java 14341 [019] 252764.207057: cycles: 7f3657192400 nmethod::do_unloading(BoolObje
java 14341 [019] 252764.215962: cycles: 7f3656ba807e Assembler::locate_operand(unsi
java 14341 [019] 252764.225141: cycles: 7f36571922e8 nmethod::do_unloading(BoolObje
java 14341 [019] 252764.234578: cycles: 7f3656ec4960 CodeHeap::block_start(void*) c
[…]](https://image.slidesharecdn.com/srecon2016perfchecklists-160409004953/85/SREcon-2016-Performance-Checklists-for-SREs-55-320.jpg)
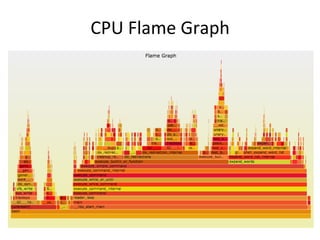
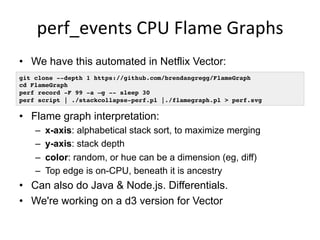

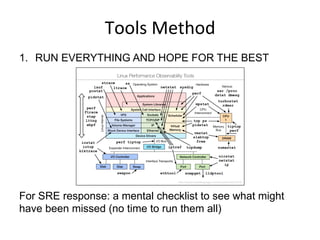
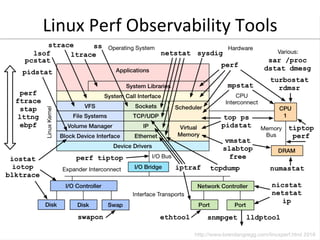


The document outlines performance checklists for Site Reliability Engineers (SREs) at Netflix, emphasizing the importance of speed, completeness, and reliability during performance incident responses. It details various metrics and monitoring tools used for assessing system performance, as well as methodologies for both pre-triage and dashboard creation to aid in rapid issue resolution. The presentation highlights the relationship between performance engineering and SRE tasks, underscoring the necessity of collaboration and the development of tailored checklists for efficient incident management.