
Recommended
More Related Content
What's hot
What's hot (20)
Similar to Józsa e.
Similar to Józsa e. (20)
More from mirijovsky
More from mirijovsky (15)
Recently uploaded
Recently uploaded (20)
Józsa e.
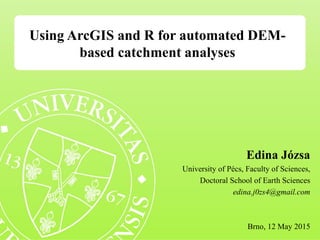
- 1. Using ArcGIS and R for automated DEM- based catchment analyses Edina Józsa University of Pécs, Faculty of Sciences, Doctoral School of Earth Sciences edina.j0zs4@gmail.com Brno, 12 May 2015
- 2. Content Introduction - Background - Aims - Significance Study area - Location, Extent - Topography - Piedmont surfaces Methods - Materials, Software - LSPs - Extract floodplains - Long profiles Results - Floodplain maps - Interpreted long profiles Conclusions - Applicability - Further research
- 3. • The study is connected to the research of Kovács, M. (2012) about the geomorphological settings, anthropogenic effects in the Vasas-Belvárd catchment. • Aim: Using automated geomorphometric analyses to create thorough overview of a catchment, stream channel and floodplain. – Channel characterization • Significance: consistent, repeatable, updatable and quantifiable results. Introduction
- 4. Study area Vasas-Belvárd catchment ~140 km2, southern foreland of Eastern Mecsek Mountains
- 5. Study area Topography (left) and relative relief (right) of the study area. The relative relief was calculated using the results of the topographic grain analysis – the mean ridge- valley bottom distance is 620 m respectively.
- 6. Study area Slope gradient in degrees (left) and slope variability (right) over the study area. The slope variability was calculated using the results of the topographic grain analysis – the mean ridge- valley bottom distance is 620 m respectively.
- 7. Study area Features of the drainage pattern indicating tectonic effects (left). Piedmont-like surfaces extracted using the TPI method (right) [Józsa, E. – Kovács, M. 2014].
- 8. • Input: – contour-based digital elevation model, 10 m horizontal resolution – Topo To Raster interpolation method • Software: – ArcGIS Spatial Analyst, TauDEM Tools, Transformation (normalization) Tool of Csillik, O. + – R statistical analysis Methods
- 9. Methods
- 10. • Why to use the TauDEM Tools? – Automated watershed and stream network extraction with script tool – Extensive set of hydrological tools – opportunity to expand model – Detailed attribute table for streams (Strahler Order, Shreve Magnitude, Average slope, Elevation drop, etc.) *** D-Infinity flow direction (for high-resolution data) Tool created by: Tarboton, D. G. 1997 (last update 2013) Methods
- 11. • Why to use the Transformation (normalization) Tool? – Transformation of morphometric parameters toward the Gaussian (normal) distribution - minimize skewness of slope gradient frequency distribution; modify kurtosis of profile and tangent curvature – Better visualization and interpretation of LSPs - more coherent results – Script tool in ArcGIS - easy-to-use, only the knowledge of main topographic characteristics is necessary to parameterize (homogeneity) Tool created by: Csillik, O. 2014 Methods
- 12. • Why to use the R? – Integrating GIS with statistical analysis software creating maps using the spatial analyst tools of GIS and analysing data in R via the GUI of GIS software – Python is calling R funcionality via script tool in ArcGIS – Capability of R to handle raster and vector data – calculations as dataframes – Results as maps or tables, plots (exported from R) Tool available with Apache License Methods
- 13. Results • Watercourses & Basins The attribute table of stream network (created by Stream Reach and Watershed Tool) includes Strahler order (left) and average elevation drop (right) for stream segments.
- 14. Results • Floodplain extraction – Normalization of slope gradient (Box-Cox)
- 15. Results • Floodplain extraction – Normalization of slope gradient (before)
- 16. Results • Floodplain extraction – Normalization of slope gradient (after)
- 17. Results • Floodplain extraction – Normalization of curvature (Arctangent)
- 18. Results • Floodplain extraction – Normalization of curvature (before)
- 19. Results • Floodplain extraction – Normalization of curvature (after)
- 20. Results • Floodplain extraction – Script tool working with R
- 21. Results • Floodplain extraction – Scatter plots to analyse given segment
- 22. Results • Floodplain extraction – Effect of normalization
- 23. Results • Floodplain extraction – Extracted areas
- 24. Results • Long profile, elevation drop and sinuosity of Vasas-Belvárd str.
- 25. • Interoperability and easy scripting make ArcGIS + R capable of providing „push-the-button” solutions for catchment analysis • Normalizing LSPs proved to be useful in case of floodplain extraction • Further research on algorithm (further automating preparation of maps, fine tuning thresholds, documentation) + comparison with available algorithms • Further research on area (regulated channels, mill canals) Conclusions
- 26. Thank you for your attention!