1. Proceedings of the CIB W78-W102 2011: International Conference –Sophia Antipolis, France, 26-28 October
DEVELOPMENT AND APPLICATION OF KEY
PERFORMANCE INDICATORS TO ANALYZE AND IMPROVE
MANAGEMENT OF INFORMATION FLOW IN THE BIM
DESIGN PROCESS.
Leonardo Manzione, PhD Candidate, leomanzione@usp.br
Escola Politécnica at University of Sao Paulo, Brazil (POLI-USP)
Mariana Wyse, Master Candidate, mariana@usp.br
Escola Politécnica at University of Sao Paulo, Brazil (POLI-USP)
Rafael Sacks, Associate Professor, cvsacks@techunix.technion.ac.il
Technion-Israel Institute of Technology, Haifa, ISRAEL
Léon Berlo, PhD Candidate, leon.vanberlo@tno.nl
TNO Built Environment and Geosciences, Delft, The Netherlands
Silvio B. Melhado, Associate Professor, silvio.melhado@poli.usp.br
Escola Politécnica at University of Sao Paulo, Brazil (POLI-USP)
ABSTRACT
Due to the interoperability provided by the IFC standard, BIM technologies and IFC model servers are
beginning to enable a design environment where the exchange of information among the actors can be
made synchronously and continuously using a single and central data model.
Although this new set of technologies enables concurrent design, the problems associated with
managing the flow of information itself in a concurrent design environment requires explicit
management of editing rights and version control at the level of individual objects, rather than at the
file level. However, while these are technical issues that have standard solutions, managing designers’
involvement in the process also becomes more challenging, requiring the development of new
management methods suitable for the BIM collaborative environment.
Common problems such as information ‘overflow’ and incomplete modelling solutions or incorrectly
matched technical solutions, inventories of work in progress due to inattentive designers, if not treated
methodically in the BIM platform, can quickly cause bottlenecks for the advancement of the process.
The bottlenecks result in process waste (such as time spent waiting, large inventories of design
information, processing sequences that cause unnecessary iterations, long cycle times and schedule
overruns, etc.).
The application of concepts that allow structuring and measuring of the information flow can improve
the process and reduce the waste of resources, but the lack of a specific methodology for measuring
the information flow in a BIM environment constitutes a barrier to the research.
Taking a previous study (in which seven key performance indicators were developed and validated for
application with conventional technology) as a starting point, this work has developed the
methodology for using these indicators in a BIM project.
Keywords: information flow measure, collaborative design, model server, design management
1. INTRODUCTION
When talking about building construction, the accomplishment of stated schedules is a constant
problem, therefore there is a constant claim of the developers about design delivery being late.
The design process is informally managed, with inappropriate planning techniques and the low
utilization of the IT resources. There are also claims from the design professionals because of the
rework, which is responsible for the profit loss, (Manzione 2006).
2. Due to the interoperability provided by the IFC standard, BIM technologies and IFC model servers
are beginning to enable a design environment where the exchange of information among the actors can
be made synchronously and continuously using a single and central data model, ( London 2010).
Although this new set of technologies enables concurrent design, the problems associated with
managing the information flow itself in a concurrent design environment requires explicit management
of editing rights and version control at the level of individual objects, rather than at the file level.
However, while these are technical issues that have standard solutions, managing designers’
involvement in the process also becomes more challenging, requiring the development of new
management methods suitable for the BIM collaborative environment.
The purpose of this paper is to propose a new methodology aiming the organization, planning and
control of design process within BIM technology, focusing in defining KPIs to measure process
efficiency.
2. TOWARDS A BIM INTEGRATED MANAGEMENT MODEL (B.I.M.M)
Information is the fuel for design process and the proper organization of the information flow
constitutes one of the key actions to ensure the project’s goals are achieved.
Design process has a variable nature. In the first development stages, the information content has
high impact in the final solution, and as the process follows to more advanced stages the impact is
reduced, corresponding to the passage from a less structured status with more uncertainty where
negotiations are required to a more structured status, where information flow complexity grows, as the
number of involved actors (Figure 1).
Traditionally, design process has been planned with the same techniques used for constructions.
But these techniques don’t allow representation of the cycles and iteration existing in a complex
process as the design process. They only monitor design’s progress based on the conclusion and
deliver of 2D designs instead of analyzing the increment and advance of the design through key
information that aggregate along the process. BIM technology potentializes the raise on information
content impact as with it it’s possible to bring all actors together from process beginning due to its
semantic richness.
This semantic richness of BIM technology generates an additional obstacle to the process as it
facilitates integration and exchange between actors and demands a structured methodology for
managing the information flow and the design process as a whole.
Dentro dessa linha a bibliografia nos mostra diversas publicações nos últimos anos que abordam
conceitos e metodologias desenvolvidas com o objetivo de orientar a implementação do BIM como
um processo, (Sciences, 2007), (University, 2010), ( Fallon 2007).
Outras metodologias estruturadas, tendo como origem a metodologia ADePT (Austin 1999),
(Austin 2002) foram desenvolvidas e procuraram estruturar o processo de projeto de maneira genérica,
porém sem um foco preciso no BIM, (Austin 2001).
Mais recentemente o projeto Inpro, (Benning et al. 2010), pode ser considerado como uma
iniciativa de maior amplitude, na medida em que organiza as fases iniciais do processo de projeto em
BIM alinhando dentro de um Hub Colaborativo em IFC as demandas de Gestão e de Tecnologia da
Informação.
No universo BIM a IDM (Wix 2006) tem sido utilizada como uma metodologia para a
estruturação do seu processo. O principal objetivo de desenvolver IDM e MVD é o de definir as
especificações para mapear a troca de informações entre os modelos de objetos em IFC para a sua
implementação na interface entre softwares. Posteriormente são desenvolvidas as regras para a sua
utilização em modelos de processo através da BPMN, (Ouyang 2009), (White 2004).
A BPMN foi adotada dentro da metodologia da IDM como ferramenta de mapeamento do
processo e se mostra eficiente, pois cria uma ponte entre a concepção do Processo de Projeto e a sua
implementação estabelecendo as fases, definindo as responsabilidades dos agentes envolvidos e
criando os modelos de troca das informações através de Exchange Requirements, (Sacks 2010).
Embora toda a metodologia desenvolvida tenha consistência e sirva aos seus propósitos
específicos, fica faltando ainda uma abordagem sistêmica que combine o conjunto desses métodos e
que possibilite o planejamento e controle do processo em uma plataforma integrada em IFC.
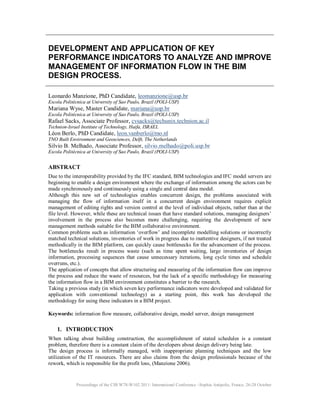
3. Visando avançar o conhecimento nessa area, a B.I.M.M. (BIM Integrated Management Model)
methodology, as shown on Figure 1, was proposed to manage the information flow in an integrated
way, combining several methodologies of planning and design management.
This work is the central theme of the first author’s PhD research. His research is in development
and at the end it will establish the necessary procedures for each stage defined from 1 to 11, as well as
the proposition of a collaborative Hub for its support.
Figure 1: BIM Integrated Management Model (B.I.M.M.)
The methodology’s steps will be shortly presented, followed by the detailed procedure to measure
the process efficiency through its KPIs. The methodology structures from the connection of four main
loops are presented below. Their goals, methods and IT tools used are listed in table 1.
A. Process Model Loop
Organizing the design process requires studying all activities predecessors through the information
flow and for this purpose the use of BPMN methodology may lead to flaws as it doesn’t allow the
optimization of information flow and the entrance of information may occur in advanced moments
where they would result in rework cycles.
The Design Structure Matrix (DSM) is a planning tool that allows optimization of the information
flow and has been intensively and thoroughly studied (Steward 1981). We suggest the use of the DSM
combined with the BPMN as a process improvement. In this case the IDM is used as a guide.
B. Planning Loop
In the planning loop, we need to be careful to distinguish between the different levels of resolution
of planning. We think the DSM and the Critical Path Method (CPM) should be used for the Master
Planning, which sets the major design project milestones, and only the milestones.
The planning cycles review not only the completion of each detailed phase, but within each phase
from time to time. After that, in phase planning, one can use the DSM again together with process
mapping or with the detailed IDM process maps to prepare phase schedules. These could be good for
say 1-3 month time slots.
At this level of resolution, one can define actual information transfers that can be monitored using
the control cycle. The planning for each phase should be a team collaborate effort, where the different
actors meet to prepare the process map and define the interchanges of information among themselves.
Model and
workbreakdown
Design Structure Matrix
(DSM)
CPM/GANTT
PLANNING
LOOP
CONTROL
LOOP
MODELING
IFC ANALYSIS
DASHBOARD
KPI Measures
PPC
Last Planner
Disciplines
Swinlanes
1
4
5
6
7
8
9
MODEL
CONCLUSION
EDITING
MODELLING
LOOP
Architecture
Structure
COORDINATION
Design
Exchanges
and Central
Model Updates
10
Architecture
Structure
HVAC
Coordination
HVAC
Exchanges
Requirements
B.I.M.M. Collaboration Hub
CORRECTIVE
ACTIONS
PROCESS
MODEL
LOOP
2
3
2
3
IDM/BPMN
10
InformationDeliveryManual(IDM)
BusinessProcess
ModellingNotation(BPMN)
11
MODEL
EVOLUTION
4. This should produce a practical and doable plan, in a similar way to doing weekly work planning
for production activities using the Last Planner System (LPS).
C. Control Loop
The Control Loop uses the BIMServer (Berlo 2010) as a BIM model repository and IFC analyzer
(Lipman 2010) as a tool to develop coverage analysis for IFC Files.
Analyzing the content of the IFC model with IFC analyzer allow us to measure the efficiency of
the design through the measures of the information flow with KPIs,(Sacks 2010).
Than the control loop goes in progression from Modeling to BIMServer to IFC analyzer to KPIs
and the dashboard.
D. Modeling Loop
The Modeling Loop occurs across all the process, from the start and incrementally as the project
progresses. The Planning and Control Loops give the feedback to the modeling process.
LOOP STEP NAME GOALS METHODOLOGIES
AND IT TOOLS
PROCESS
MODEL
1 WBS / MBS Roles and disciplines swinlanes
Breaking the work and the model in
manageable slots
Work Breakdown Structure
Model Breakdown Structure
2 IDM /
BPMN
Process Model
Exchange Requirements
Exchange Models
Information Delivery Manual
Business Process Modeling
Notation (BPMN)
3 DSM Optimize the BPMN information flow Design Structure Matrix
PLANNING
4 CPM Master Plan
Sequencing phases, scheduling tasks
and information milestones
Critical Path Method (CPM)
MSProject, Primavera, etc.
5 PPC Last Planner, short term tasks and
information delivery
Percent Planned Completed
(PPC)
CONTROL
6 Modeling Modeling in incremental stages BIM softwares
7 Coordination Model Merge and IFC Integration
Clash detection
BIMServer (TNO)
8 IFC
Analysis
Developing Coverage Analysis for IFC
Files
IFC File Analyzer - NIST
9 Dashboard
KPIs: Key
Performance
Indicators
measure
AR Action Rate BS Batch Size
PS Package Size DV Development Velocity
WIP Work in Process BN Bottleneck
RW Rework
MODELING
10 Action From the KPIs the necessary correcting actions are raised to define the next
steps, process feedback and modeling.
11 Evolution Design model will develop through coordinated evolution cycles until it
reaches its final form.
Table 1: BIM Model Management Procedure: Phases and Steps
3. KEY PERFORMANCE INDICATORS METHODOLOGY
Para que a metodologia proposta possa ser estruturada são necessários diversos passos sendo que a
medida do desempenho do processo é um dos mais importantes. Por esse motivo o objetivo desse
artigo é definir especificamente os KPIs para o ambiente BIM e dessa maneira estabelecer medidas
para a avaliação do fluxo das informações dentro do modelo de gestão apresentado anteriormente.
Taking a previous study of (Sacks 2010), in which seven key performance indicators were
developed and validated for application with conventional technology as a starting point, this work has
developed the methodology for using these indicators in a BIM project.
5. Como ponto de partida para o experimento foi utilizado um modelo BIM de um edifício
habitacional simples apenas com a disciplina de Arquitetura (Figure 2). Foram simulados cinco
estados de evolução desse modelo: para cada um deles foi gerado o arquivo IFC e carregado no
BIMServer como um usuário hipotético e após os IFCs foram processados no IFC file analyzer
gerando-se as respectivas planilhas.
Figure 2: Stages of model’s sample evolution
Para o cálculo dos KPIs algumas definições preliminares são necessárias. Esses conceitos foram
definidos em um trabalho anterior de (Sacks 2010) e são reproduzidas textualmente utilizando as telas
geradas pelo IFC file analyzer. Para que se possa entender conceitualmente o uso do IFC Analyzer, a
Figura 3 abaixo mostra a correspondência entre as definições de Information Objects e Information
Attributes cruzando-as e correspondendo-as com o Schema do IFC.
Figure 3: Correspondence between IFC analyzer and IFC Schema
INFORMATION PACKAGE
Definition Represents an entire model or a subset of a model in an exchange, (Figure 4)
Figure 4: An Information Package
INFORMATION OBJECT
Definition Is a distinct component of a building or facility with technical and engineering attributes and
characteristics, (Figure 5).
INFORMATION ITEM
Definition Is a single piece of information. It may be textual or graphic.An information package therefore
represents a set of information items, (Figure 5).
INFORMATION
OBJECTS
INFORMATION
ATTRIBUTES
Information
Package
A entire model or a
subset of a model
in an exchange.
IFA
IFC file analyser
spreadsheet
representing the
wholecontent of
the package
information
6. Figure 5: An Information Object and an Information Item
INFORMATION ATTRIBUTE
Definition Is a technical, engineering or management attribute of an information object such as its
dimensions, material type, supplier name, colour, price, etc. The value of an information attribute
may appear in any number of information packages, (Figure 6).
Figure 6: An Information Attribute
ACTION
Definition is performed by a team member to communicate information. In our case: upload or download an
IFC file to the central model at BIMServer and vice-versa.
INFORMATION BATCH
Definition Is a set of information packages transferred together.
Table 2: Basic Definitions
4. KPIS DEFINITION AND PROOF OF CONCEPTS
Após essas definições e com os dados do modelo de exemplo da figura 3, foram calculados os KPIs,
utilizando-se o IFC analyzer e os dados do BIMServer, indicados nas Tabelas 3 e 4 e representados
graficamente através de um dashboard conforme a Figura 8. A partir das definições de (Rafael Sacks
2010) para KPIs em um projeto convencional podemos extender e provar a sua utilização para o
ambiente BIM conforme tabela a seguir:
AR: ACTION RATE
Definition: The rate at which information is transferred, (Figure 7).
Goal Este índice tem como objetivo principal medir as ações dos membros da equipe de projeto
Formula This KPI is calculated from the measurement of users' actions directly at BIMServer log file. The
average over any given time period t1 to t2 for a number of team members nTM is defined as:
= ∑ ∑ nAi, k
(t2 − t1)
Information Iten
A single piece of
information
Information
Object
IfcArbitraryClosedProfileDef
IfcArbitraryProfileDefWithVoids
IfcCircleProfileDef
IfcExtrudedAreaSolid
IfcRectangleProfileDef
IfcDoorLiningProperties
IfcDoorStyle
IfcPropertySet
IfcPropertySingleValue
IfcRelDefinesByProperties
IfcWindowLiningProperties
IfcWindowStyle
IfcMaterial
7. Figure 7: Action Rate = Actions of an user at BIMServer per unit time
PS: PACKAGE SIZE
Definition: Quantifies the level of detail of information packages
Goal Esse KPI mede o nível de detalhe da informação contida nos pacotes e possibilita a avaliação da
taxa de aumento desses detalhes e permite inferir o grau de conclusão do projeto. Uma mudança no
tamanho do pacote da informação não necessariamente reflete o aumento ou a redução do conteúdo
da informação que é transferida, por esse motivo esse KPI é baseado na contagem das unidades de
informação.
Formula nIAi v is the number of attributes belonging to information object i that have values assigned to
them (at time t), and nIO is the total number of information objects in the package. Na planilha do
IFC analyser o Package Size é calculado diretamente somando-se o número de entidades que
correspondem às classes do IFC Shared Building Elements, (Table 4).
PSt = ,
Obsv. An important point is to measure how far the package is ready to its conclusion and it will be
necessary before we determine what will be the size it should have. The solution to this problem is
not simple because it set the amount of information it should contain in a project and specifying it,
will require the planning of packages to be produced and referred them to specific stages of
development. Estimando-se o PS total podemos definir o PSMaturity conforme fórmula abaixo.
No exemplo o PSM foi calculado dividindo-se o valor de cada PS de cada versão do modelo pelo
PS total da ultima versão, pois nesse caso esse valor já era conhecido ou poderia ser estimado.
Formula
t =
PSt
∑ nIAi
WIP: WORK IN PROCESS
Definition: The number of available but unused information packages
Goal Como esse KPI mede o atraso entre o upload e o download da informação ele indica possíveis
gargalos em membros da equipe que acumulam muita informação antes de iniciar o trabalho.
Formula This KPI is based on calculating the interval time that a packet of information is available on a
server waiting to be downloaded or viewed by the interested user. Working with a model in the
central BIMServer the calculation of this KPI is simple and uses the BIMServer log file with the
actions date of the team member k. Tupj is the day on which package j was uploaded, package size
(PS) is as defined earlier and Uj = 1, if package j has been viewed or downloaded by team member
k, Uj = 0 if not. No exemplo o WIP foi calculado a partir da distribuição normalizada do número de
entidades IFC contadas no IFC analyzer em cada uma das versões do modelo.
(t) = (t − Tupj)PSjUj
BS: BATCH SIZE
Definition: The batch volume of information transferred
Goal Esse KPI reflete a quantidade de informação que é acumulada por um determinado membro da
equipe desde a sua última entrega de informação. Observa-se com freqüência a tendência dos
profissionais em transmitir as informações em grandes lotes, normalmente antes de reuniões ou em
vésperas de pagamentos. Esse procedimento é adotado para a otimização da produção dos
escritórios, porém prejudica o fluxo dos demais parceiros que precisam ficar parados esperando pela
informação. Contudo, recomenda-se que a informação seja transferida em pequenos lotes.
Actions at
BIMServer
Revisions,
Checkouts
8. Formula nIP is the number of information packages in the batch. No exemplo foram contados com o IFC
analyzer o número de information objects em cada uma das versões do modelo.
t = nIAi
DV: DEVELOPMENT VELOCITY
Definition: Representa a velocidade com a qual a informação está sendo transferida para a equipe.
Goal Possibilita identificar gargalos dentro do processo na medida em que velocidades baixas podem
apontar tanto para atrasos quanto para a transmissão feita em grandes lotes.
Formula Easily measured because it is calculated directly from measures of Package Sizes or Batch Sizes.
=
BSt − BSt − 1
Tt − Tt − 1
BN: BOTTLENECKS
Definition: Identifies possible bottleneck partners in the process at any given time.
Goal Possibilita identificar os pontos onde a informação fica obstruída em seu fluxo.
Formula Easily measured because it correlates the indices DV and WIP. Com o IFC analyzer esse KPI foi
calculado graficamente correlacionando-se os indices DV e WIP, foi também calculado o índice de
correlação linear, no caso obtivemos -0,79 o que mostra uma forte correlação entre esses índices.
RW: REWORK
Definition: Quantify the rework included in information packages
Goal O objetivo é identificar retrabalhos resultantes de interações negativas e por esse motivo o cálculo
do KPI precisa ser sempre acompanhado pela análise direta do projeto observando-se o teor
ocorrido das mudanças para que se possa separar as interações negativas das positivas.
Formula nIAt é obtido através da contagem dos Information Attributes cujos valores foram modificados
entre o intervalo de tempo T e T-1. Usando o IFC analyzer esse KPI é obtido processando-se
simultaneamente as versões do modelo em T e T-1 e obtendo-se por comparação entre o número de
entidades IFC a diferença na contagem dos atributos cujos valores foram modificados, (Table 4)
=
nIAt
PSt − PSt − 1 + nIAt
Table 3: KPIs Definition
Action Rate Package Size Maturity Work in Process
Batch Size Development Velocity Bottlenecks
9. Rework
Figure 8: KPIs Dashboard
Table 4: IFC analyzer spreadsheet and KPIs calculation
5. CONCLUSIONS
O artigo procurou apresentar inicialmente uma proposta de metodologia para a Gestão do Processo de
Projeto em BIM. O modelo apresentado ainda está em desenvolvimento e sua apresentação nesse
artigo foi feita de maneira resumida. Entende-se que o processo de projeto tenha que ter além dos
controles gerenciais de prazos, feitos a partir de cronogramas, um controle mais granular do seu
desempenho.
MODEL VERSIONS V1: 19/04/11 V2: 20/04/11 V3: 21/04/12 V4: 22/04/13
Action Rate 2,00 2,00 2,00 2,00
Revisions feed at BIMServer 19/4/11 20/4/11 21/4/11 22/4/11
Download feed at BIMServer 20/4/11 21/4/11 22/4/11 23/4/11
Total Actions made 2 2 2 2
Time interval (days) 1 1 1 1
Package Size Maturity 0,0631 0,5908 0,8929 1,0023
Package Size Excel formula E15/I15 F15/I15 G15/I15 H15/I18
Total of Information Objects 56 524 792 889
Information Objects formula SUM(E37:E49) SUM(F37:F49) SUM(G37:G49) SUM(H37:H49)
Work in Process
Normalized -0,92 0,22 0,80 1,06
Work in Process 3.376,00 20.156,00 28.624,00 32.460,00
Average 16.923,20
Standard deviation 14.651,56
Interval time between
download and upload (days) 1 1 1 1
Uj 1 1 1 1
Batch Size 3.376 20.156 28.624 32.460
Percent Increase of Batch Size 497% 42% 13%
Development Velocity
Normalized 1,31 -1,14 -0,64
Development Velocity 16.780 8.468 3.836
Average 7.238,75
Standard deviation 7.266,57
Normalized value 1,31 0,17 -0,47
Bottlenecks graphic graphic graphic graphic
Rework
Information Attributes whose
values have changed
Total of Information Attributes 3.320 19.632 27.832 31.571
Total of Information Objects 56 524 792 889
IfcBeam 22 24
IfcColumn 4 4
IfcColumnType 4 4
IfcCovering 4 4 4 4
IfcDoor 1 97 97
IfcFooting 51
IfcOpeningElement 98 198 198
IfcRailing 4 4
IfcRoof 6
IfcSlab 2 10 18 25
IfcStair 8 8
IfcWallStandardCase 50 314 336 367
IfcWindow 97 97 97
IfcFlowSegment 1
IfcPipeSegmentType 1
IfcArbitraryClosedProfileDef 4 30 56 69
IfcArbitraryProfileDefWithVoids 32 32 32
IfcCircleProfileDef 12 12
IfcExtrudedAreaSolid 52 468 678 764
IfcRectangleProfileDef 48 406 578 651
IfcDoorLiningProperties 1 11 11
IfcDoorStyle 1 11 11
IfcPropertySet 310 2.204 3.122 3.589
IfcPropertySingleValue 664 3.539 5.126 5.924
IfcRelDefinesByProperties 310 2.204 3.122 3.589
IfcWindowLiningProperties 10 10 10
KPIsDashboardINFORMATIONATTRIBUTES
INFORMATIONOBJECTS=
SHAREDBUILDINGELEMENTS
10. Esse controle pode ser feito a partir do cálculo dos indicadores de desempenho do processo. Esses
KPIs foram demonstrados anteriormente em um ambiente de projeto convencional que utilizou
arquivos em CAD 2d e a proposta do artigo foi demonstrar a sua validação para uso no ambiente BIM.
Para isso foram simuladas situações de um projeto hipotético onde o BIMServer foi utilizado para
hospedar as versões do modelo no formato IFC e posteriormente cada uma dessas versões foram
processadas utilizando-se o IFC analyzer.
Prevê-se a continuidade do presente trabalho quando for possível encontrarem-se projetos reais
aonde um Model Server possa ser utilizado, pois atualmente essa tecnologia ainda é pouco adotada.
O cálculo desses KPIs ficou facilitado e provado no ambiente BIM e pode ser automatizado em
trabalhos futuros. Uma proposição para futuros trabalhos pode ser o desenvolvimento de uma interface
que opere em conjunto com o BIMServer onde o IFC analyzer possa ser acionado a partir das ações
dos participantes, uma vez que ele possui também a possibilidade de ser disparado a partir de linha de
comando. Nessa proposição seria necessária também o desenvolvimento de uma interface gráfica que
possibilite a visualização em tempo real dos gráficos dos KPIs.
REFERENCES
Austin, S. (1999). "Analytical design planning technique: a model of the detailed building design
process." Design Studies 20(3): 279-296.
Austin, S. (2002). "Modeling and managing project complexity." International Journal of Project
Management 20(3): 191-198.
Austin, S. et al. (2001). "Design Chains: a Handbook for Integrated and Collaborative Design."
Loughborough, Loughborough University.
London, K., et al. (2010). "Towards the Development of a Project Decision Support Framework for
Adoption of an Integrated Building Information Model using a Model Server. Building
Information Modeling and Construction Informatics". J. U. U. Isikdag. New York,
Information Science Reference: 270-300.
Fallon, K., et. al (2007). General Buildings Information: Handover Guide: Principles, Methodology
and Case Studies, National Institute Of Standards and Technology: 99.
Berlo, L. et. al (2010). "BIMSERVER.ORG – an Open Source IFC Model Server". 27th International
Conference - Applications of IT in the AEC Industry & Accelerating BIM Research Workshop,
Cairo, Egypt, CIB.
Lipman, R. (2010). "Developing Coverage Analysis for IFC Files". 27th International Conference -
Applications of IT in the AEC Industry & Accelerating BIM Research Workshop, Cairo,
Egypt, CIB.
Manzione, L. (2006)." Estudo de Métodos de Planejamento do Processo de Projeto de Edifícios".
Master Dissertation, Universidade de São Paulo.
Ouyang, C., et al. (2009). "From Business Process Models to Process-oriented Software Systems: The
BPMN to BPEL Way." ACM Transactions on Software Engineering and Methodology.
Benning, P., et al. (2010). "Collaboration processes. Framework for Collaboration". Inpro Report,
Inpro Consortium: 43.
Sacks, R., et al. (2010). "Introducing a new Methodology to Develop the Information Delivery
Manual for AEC Projects". 27th International Conference - Applications of IT in the AEC
Industry & Accelerating BIM Research Workshop, Cairo, Egypt, CIB.
Rafael Sacks, E T. (2010). "An empirical study of information flows in multi-disciplinary civil
engineering design teams using lean measures." Architectural Engineering and Design
Management.
Sciences, National Institute of Building (2007). National Building Information Model Standard.
"Overview, Principles and Methodologies".
Steward, D. (1981). "The Design Structure System: a Method for Managing the Design of Complex
Systems." IEEE Transactions on Engineering Management 28: 71-74.
University, The Pennsylvania State (2010). "BIM Project Execution Planning Guide – Version 2.0".
University Park, PA, USA., The Pennsylvania State University: 127.
White, S. A. (2004). "Introduction to BPMN", IBM Corporation.
Wix, J. (2006). "Information Delivery Manual Guide to Components and Development Methods",
buildingSMART, Oslo, Norway: 82.