Energy Resources. ( B. Pharmacy, 1st Year, Sem-II) Natural Resources
Quantitative research results
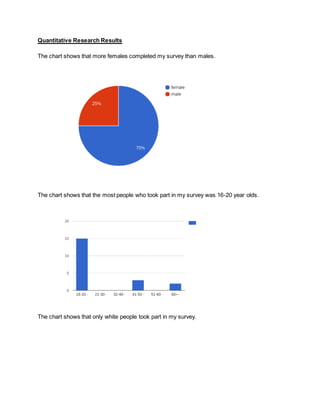
1. Quantitative Research Results
The chart shows that more females completed my survey than males.
The chart shows that the most people who took part in my survey was 16-20 year olds.
The chart shows that only white people took part in my survey.
2. This chart shows the different types of educated people who took the survey.
This chart shows the amount of times people watch films in my survey.
3. This chart shows the popularity of the different genres.
This chart shows the ways people enjoy watching films.
4. This chart shows the different way that people are convinced to watch films.
This chart shows the percentages of people who know what social realism films are who took
my survey.
5. This chart shows the amount of people who enjoy social realism films.
This chart shows the amount of people who find social realism films accessible.
6. This chart shows how often the people who took my survey watch social realism films.
This chart shows the some of the different realism films that those who took my survey have
watched.
7. This chart shows that the majority of people that I asked though that there is a need for more
realism films.
This chart shows which issues/themes the people who took part in my survey thought where
under explored in the market.
8. This chart shows the types/groups the people who completed my survey feel are under
represented in film.