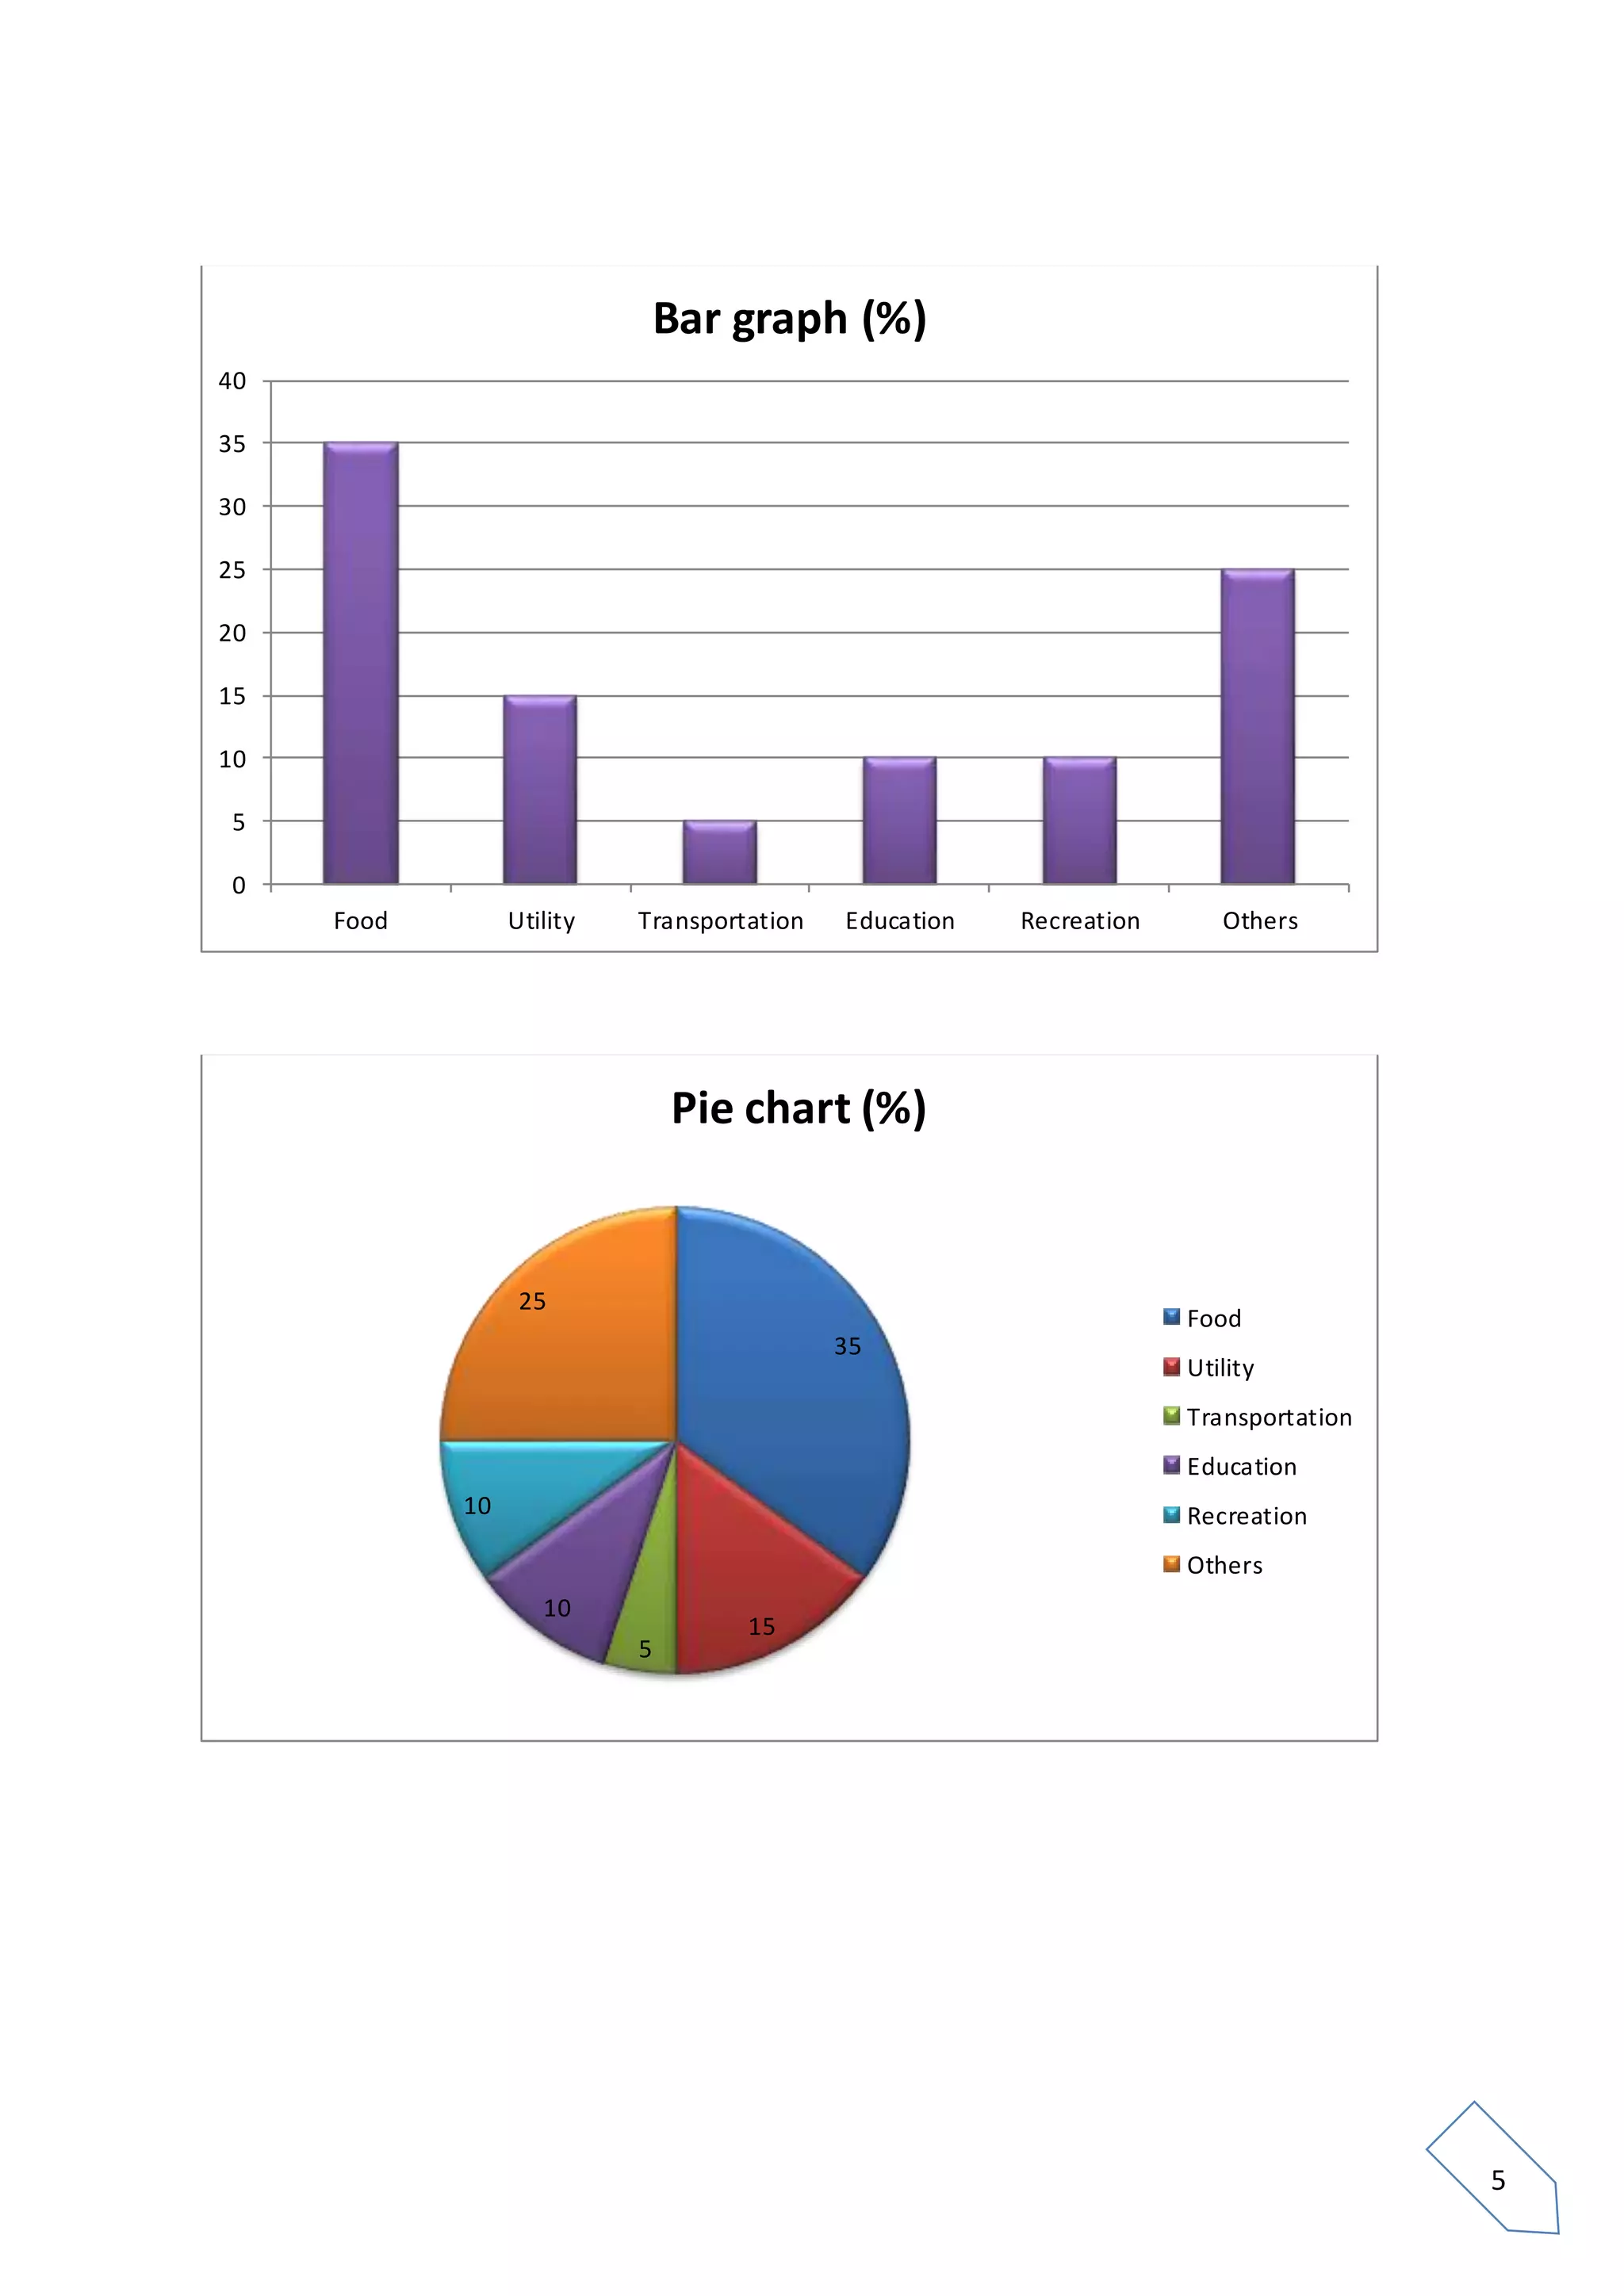
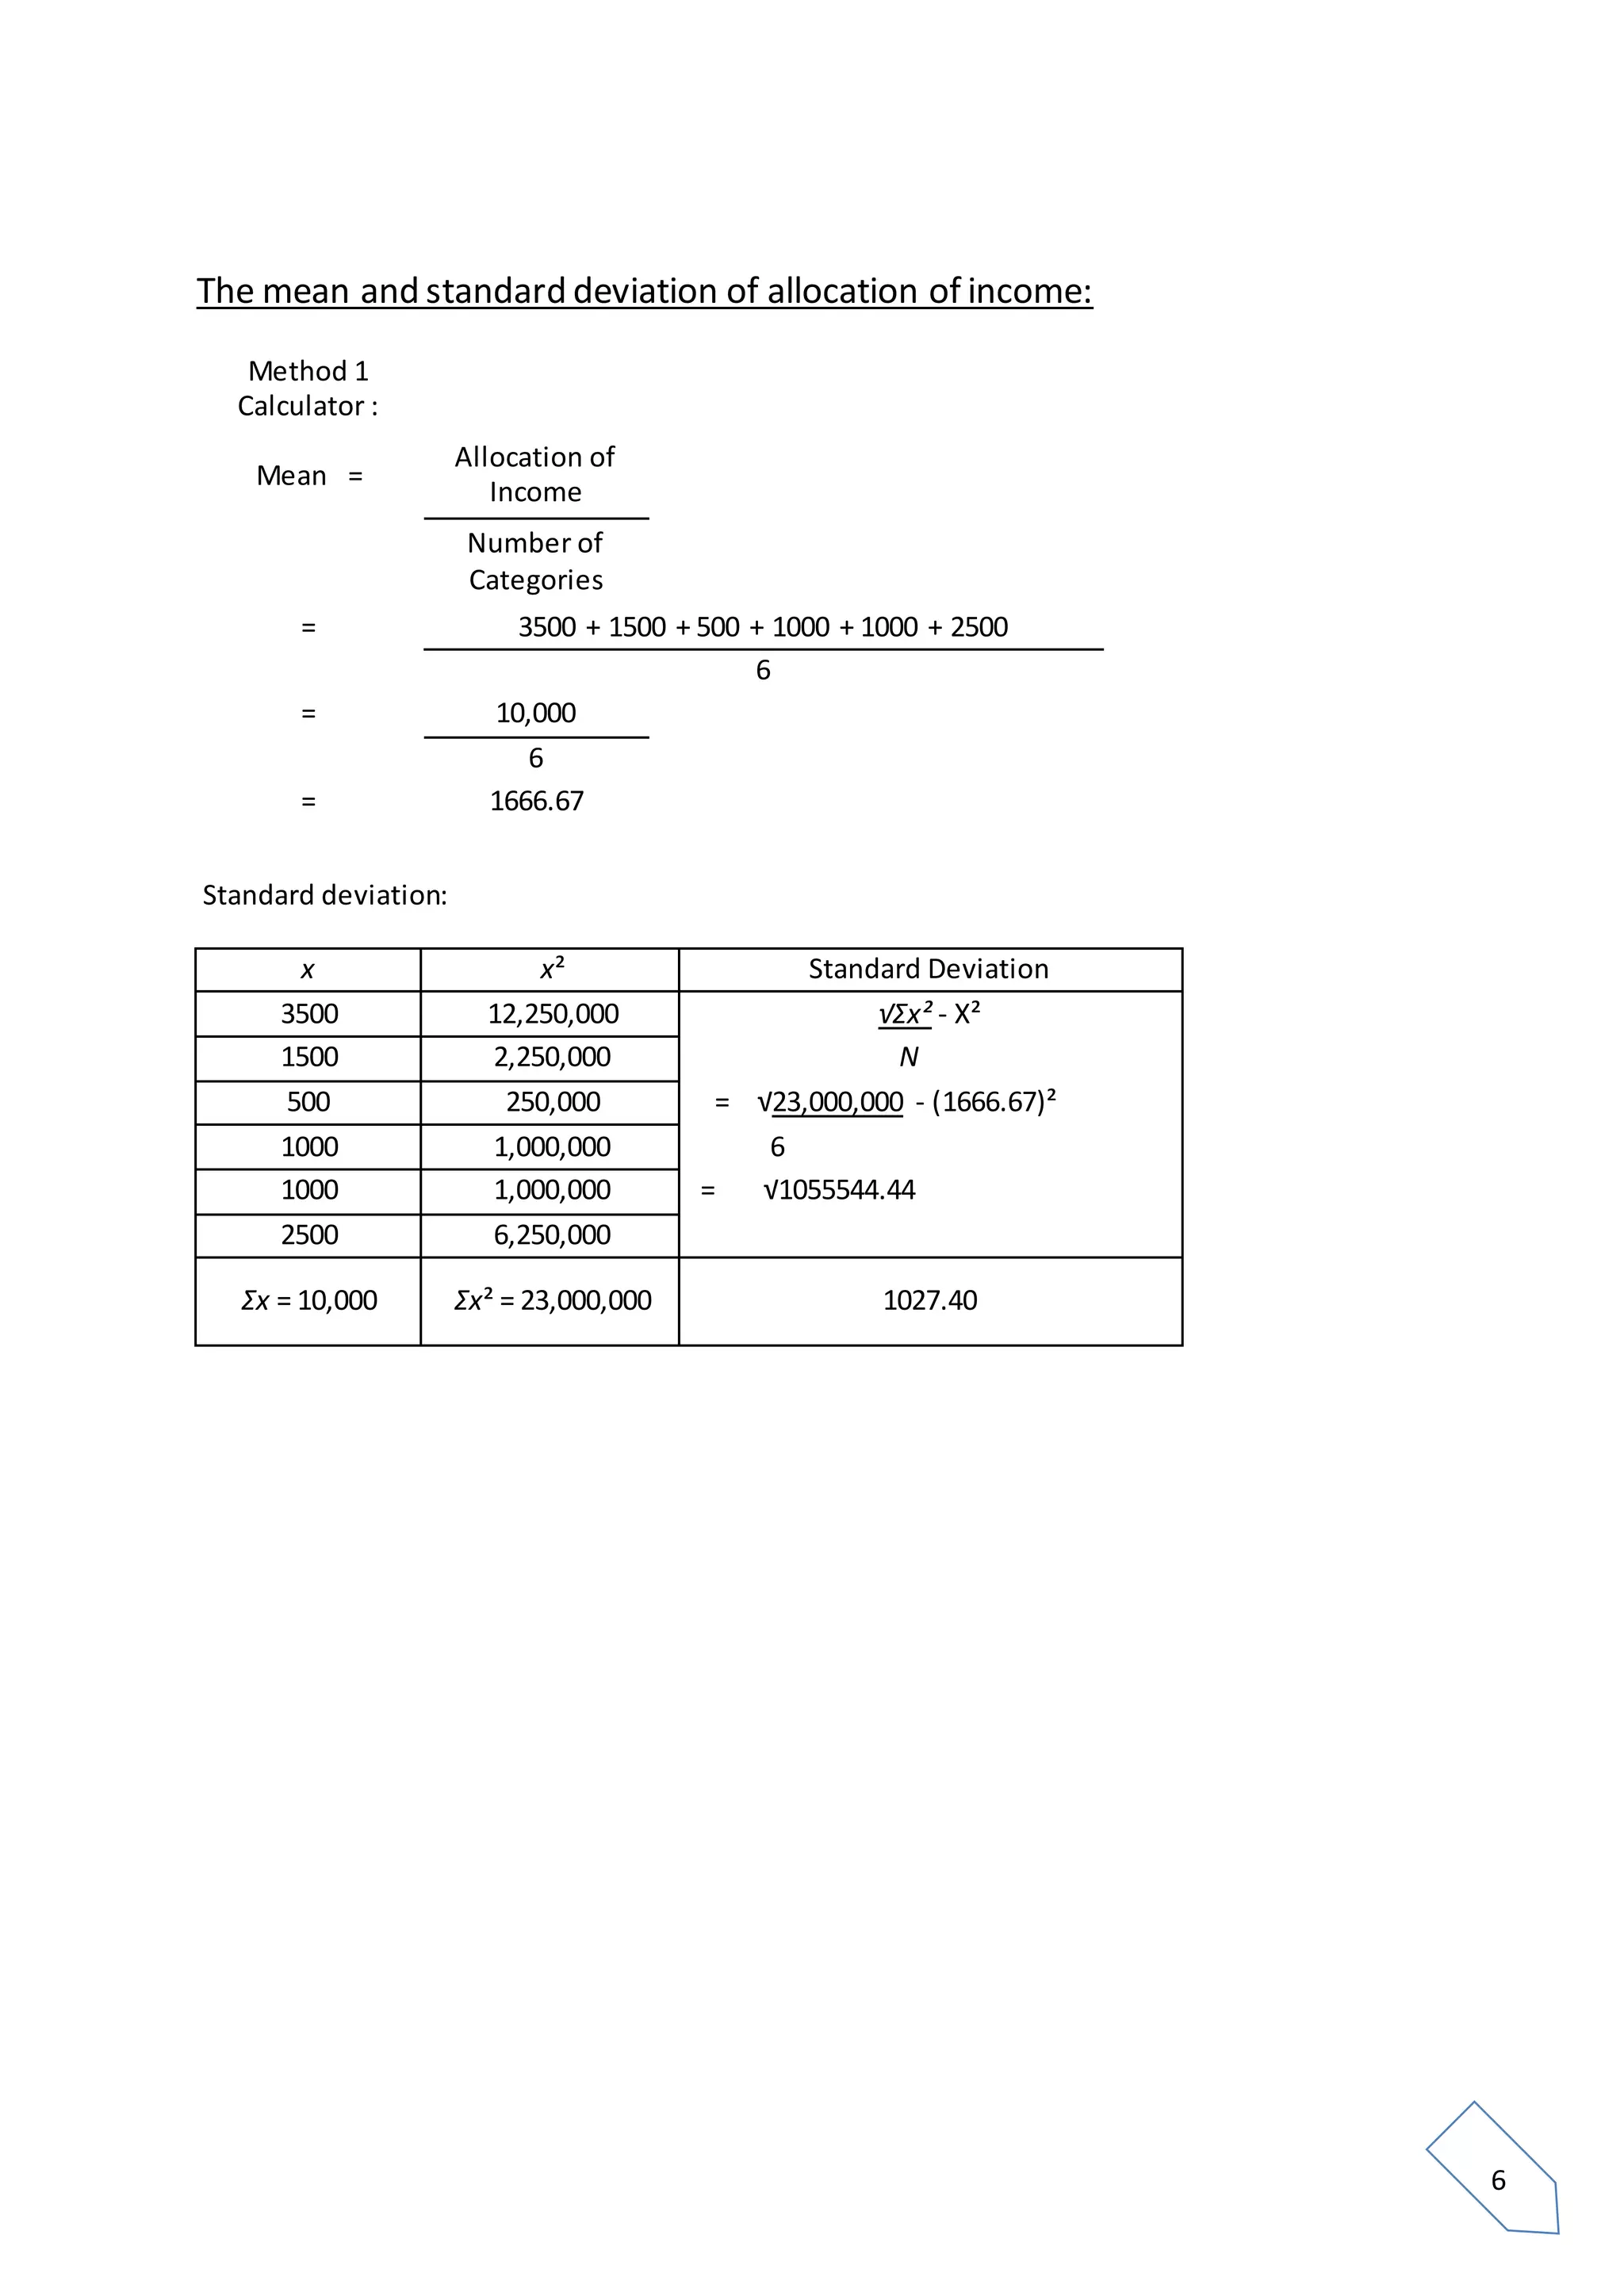
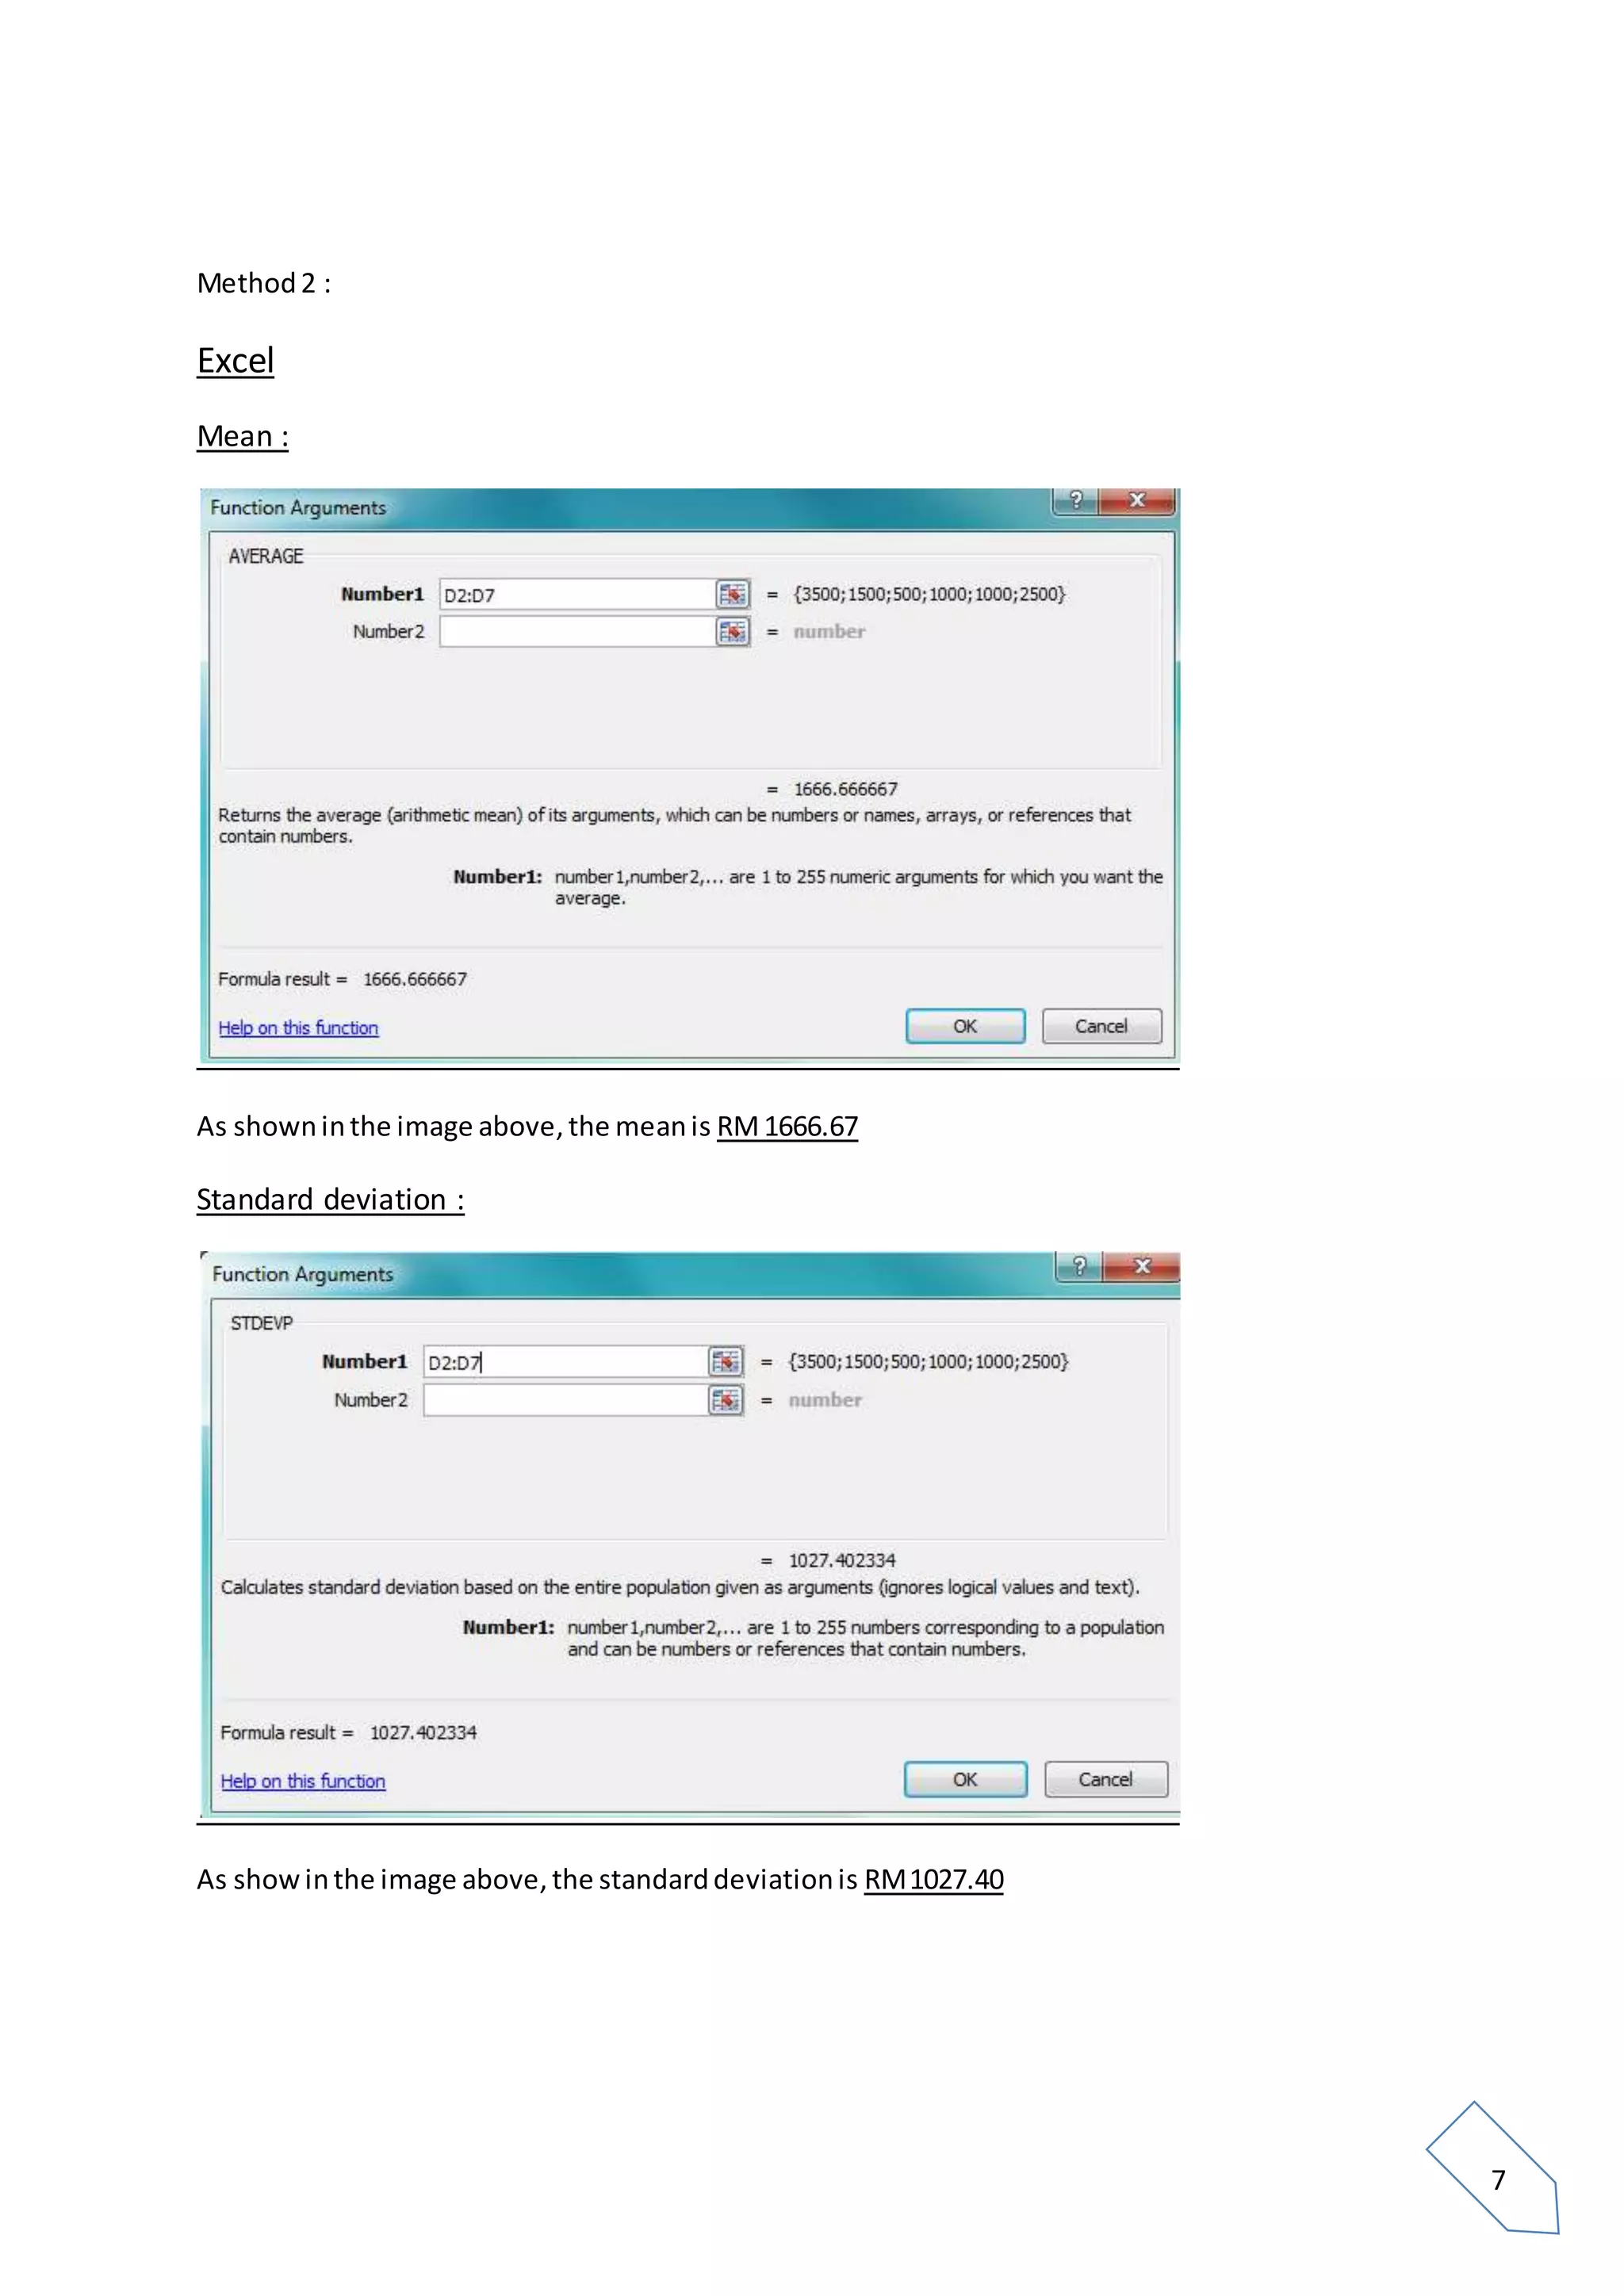
This document summarizes a student's Additional Mathematics project on household expenditure. The project includes:
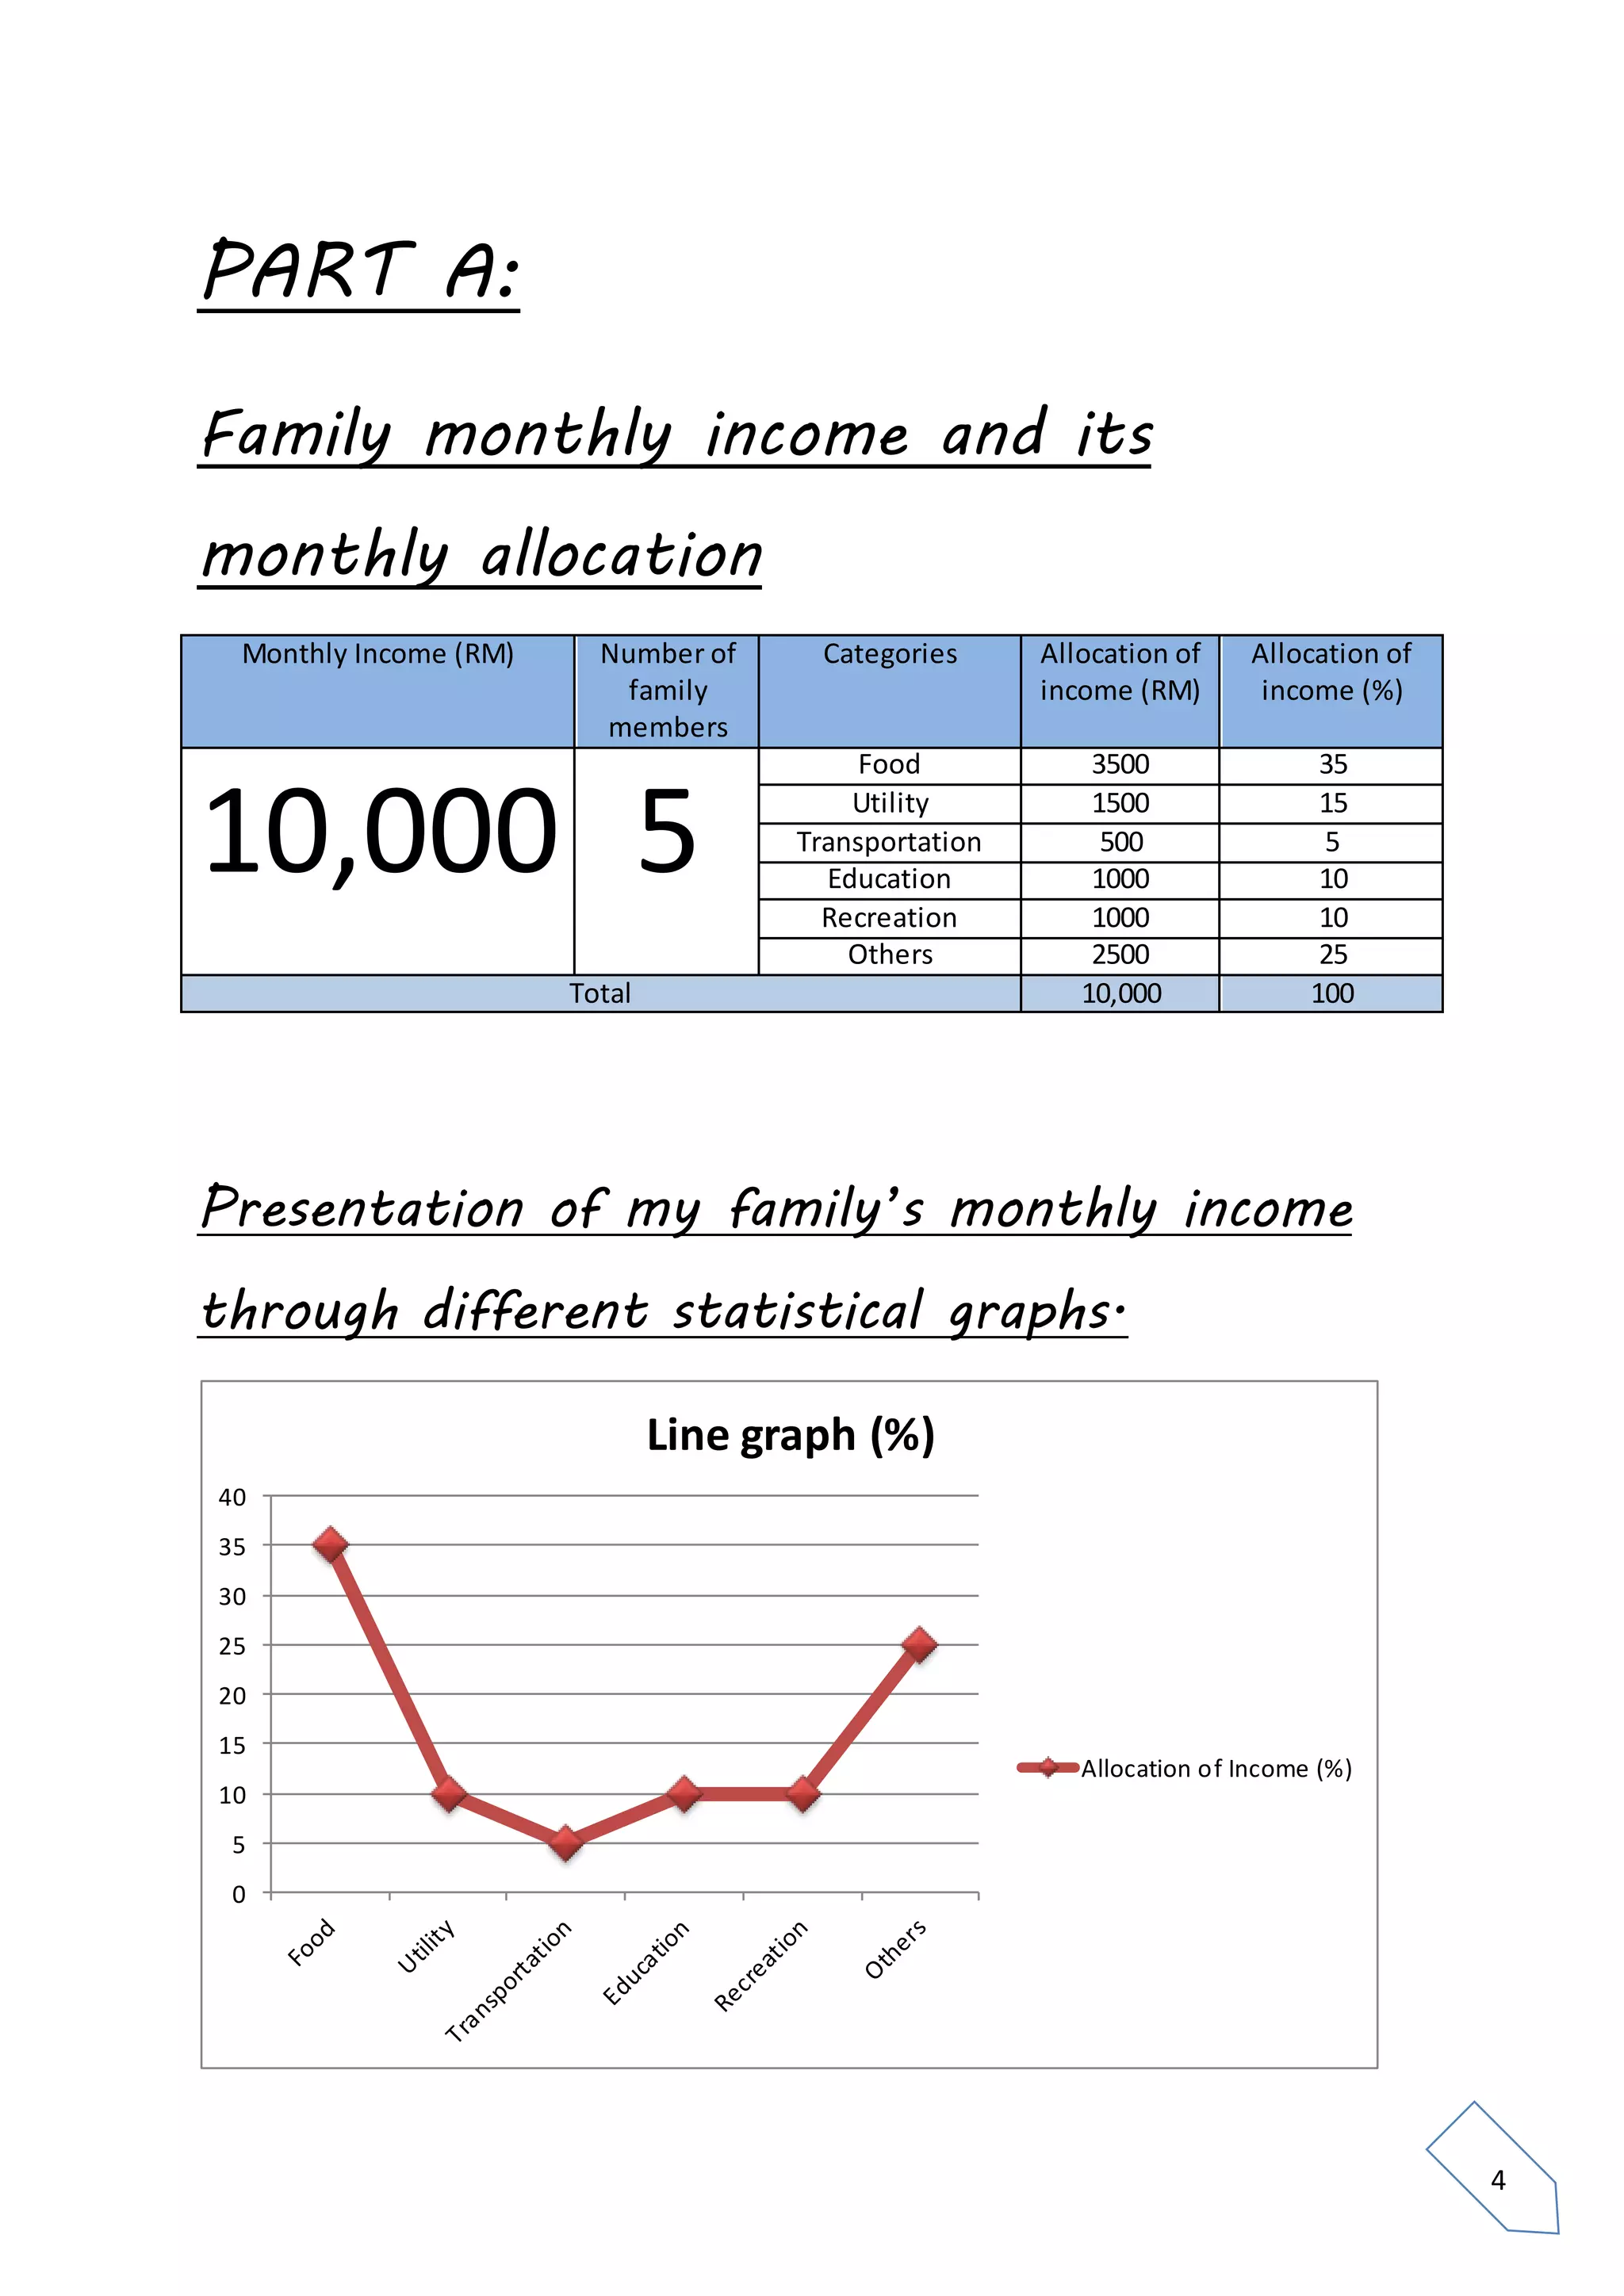
1) Analysis of the student's family monthly income allocation using graphs, mean, and standard deviation.
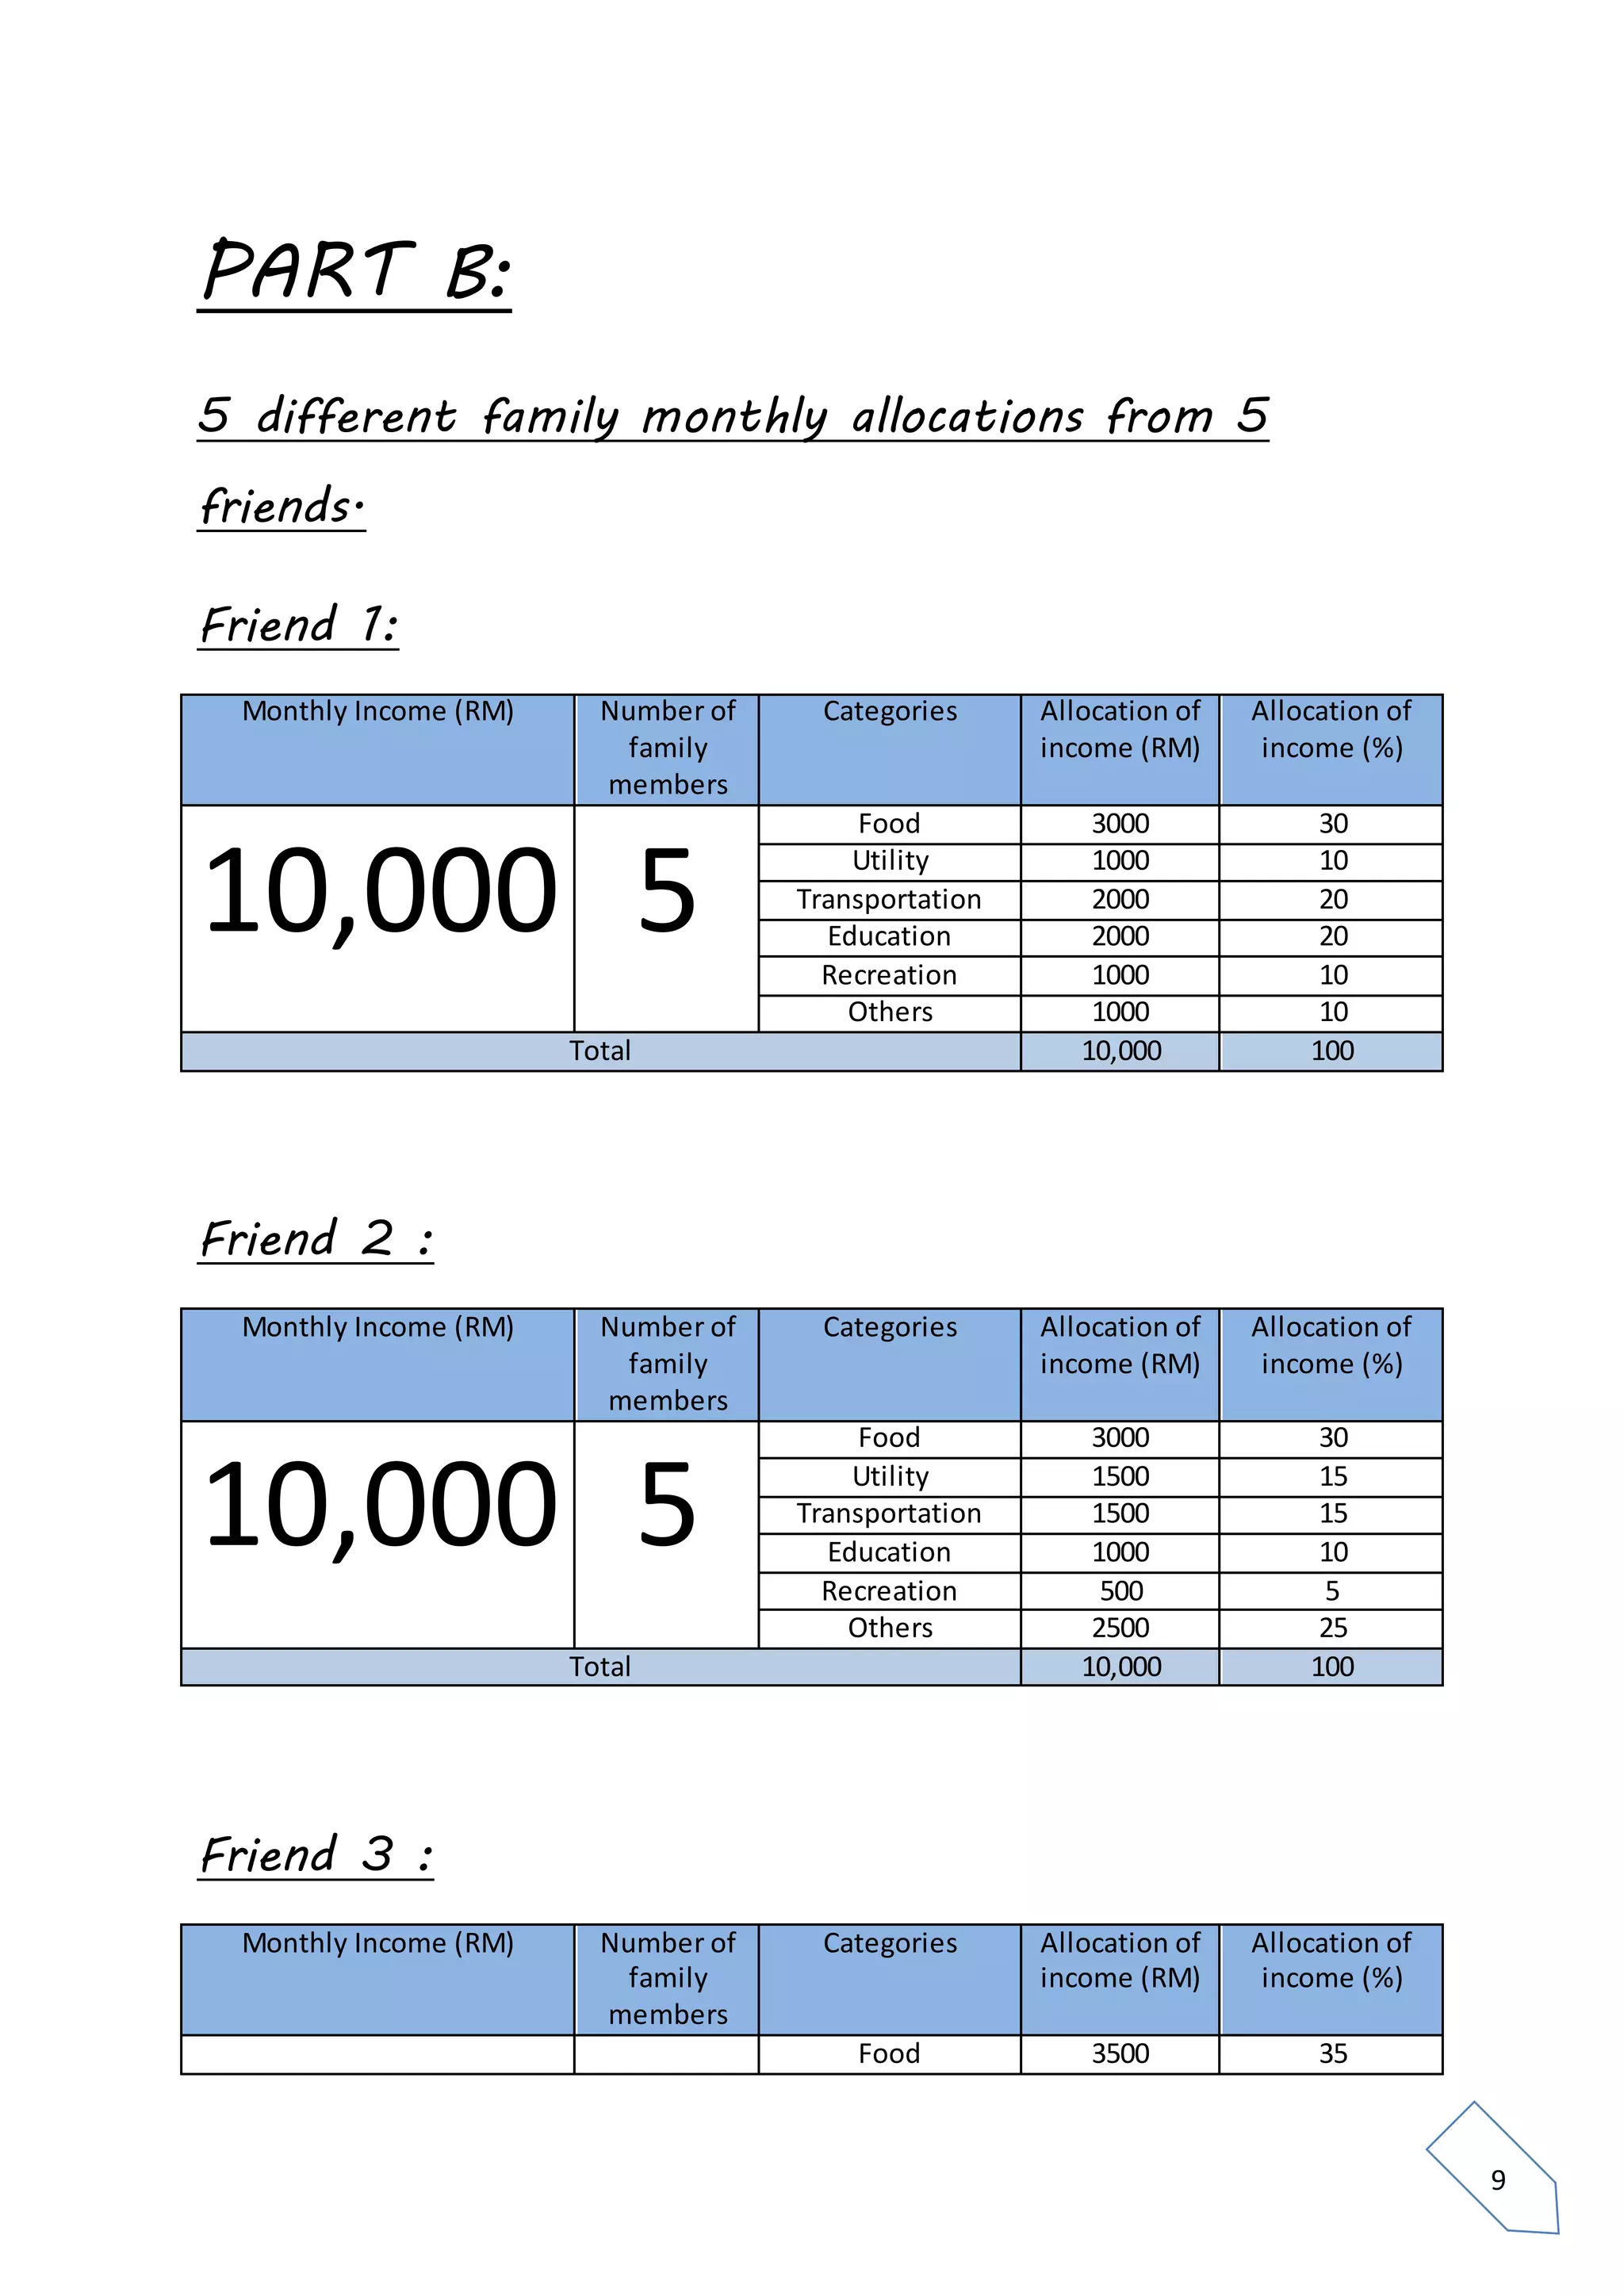
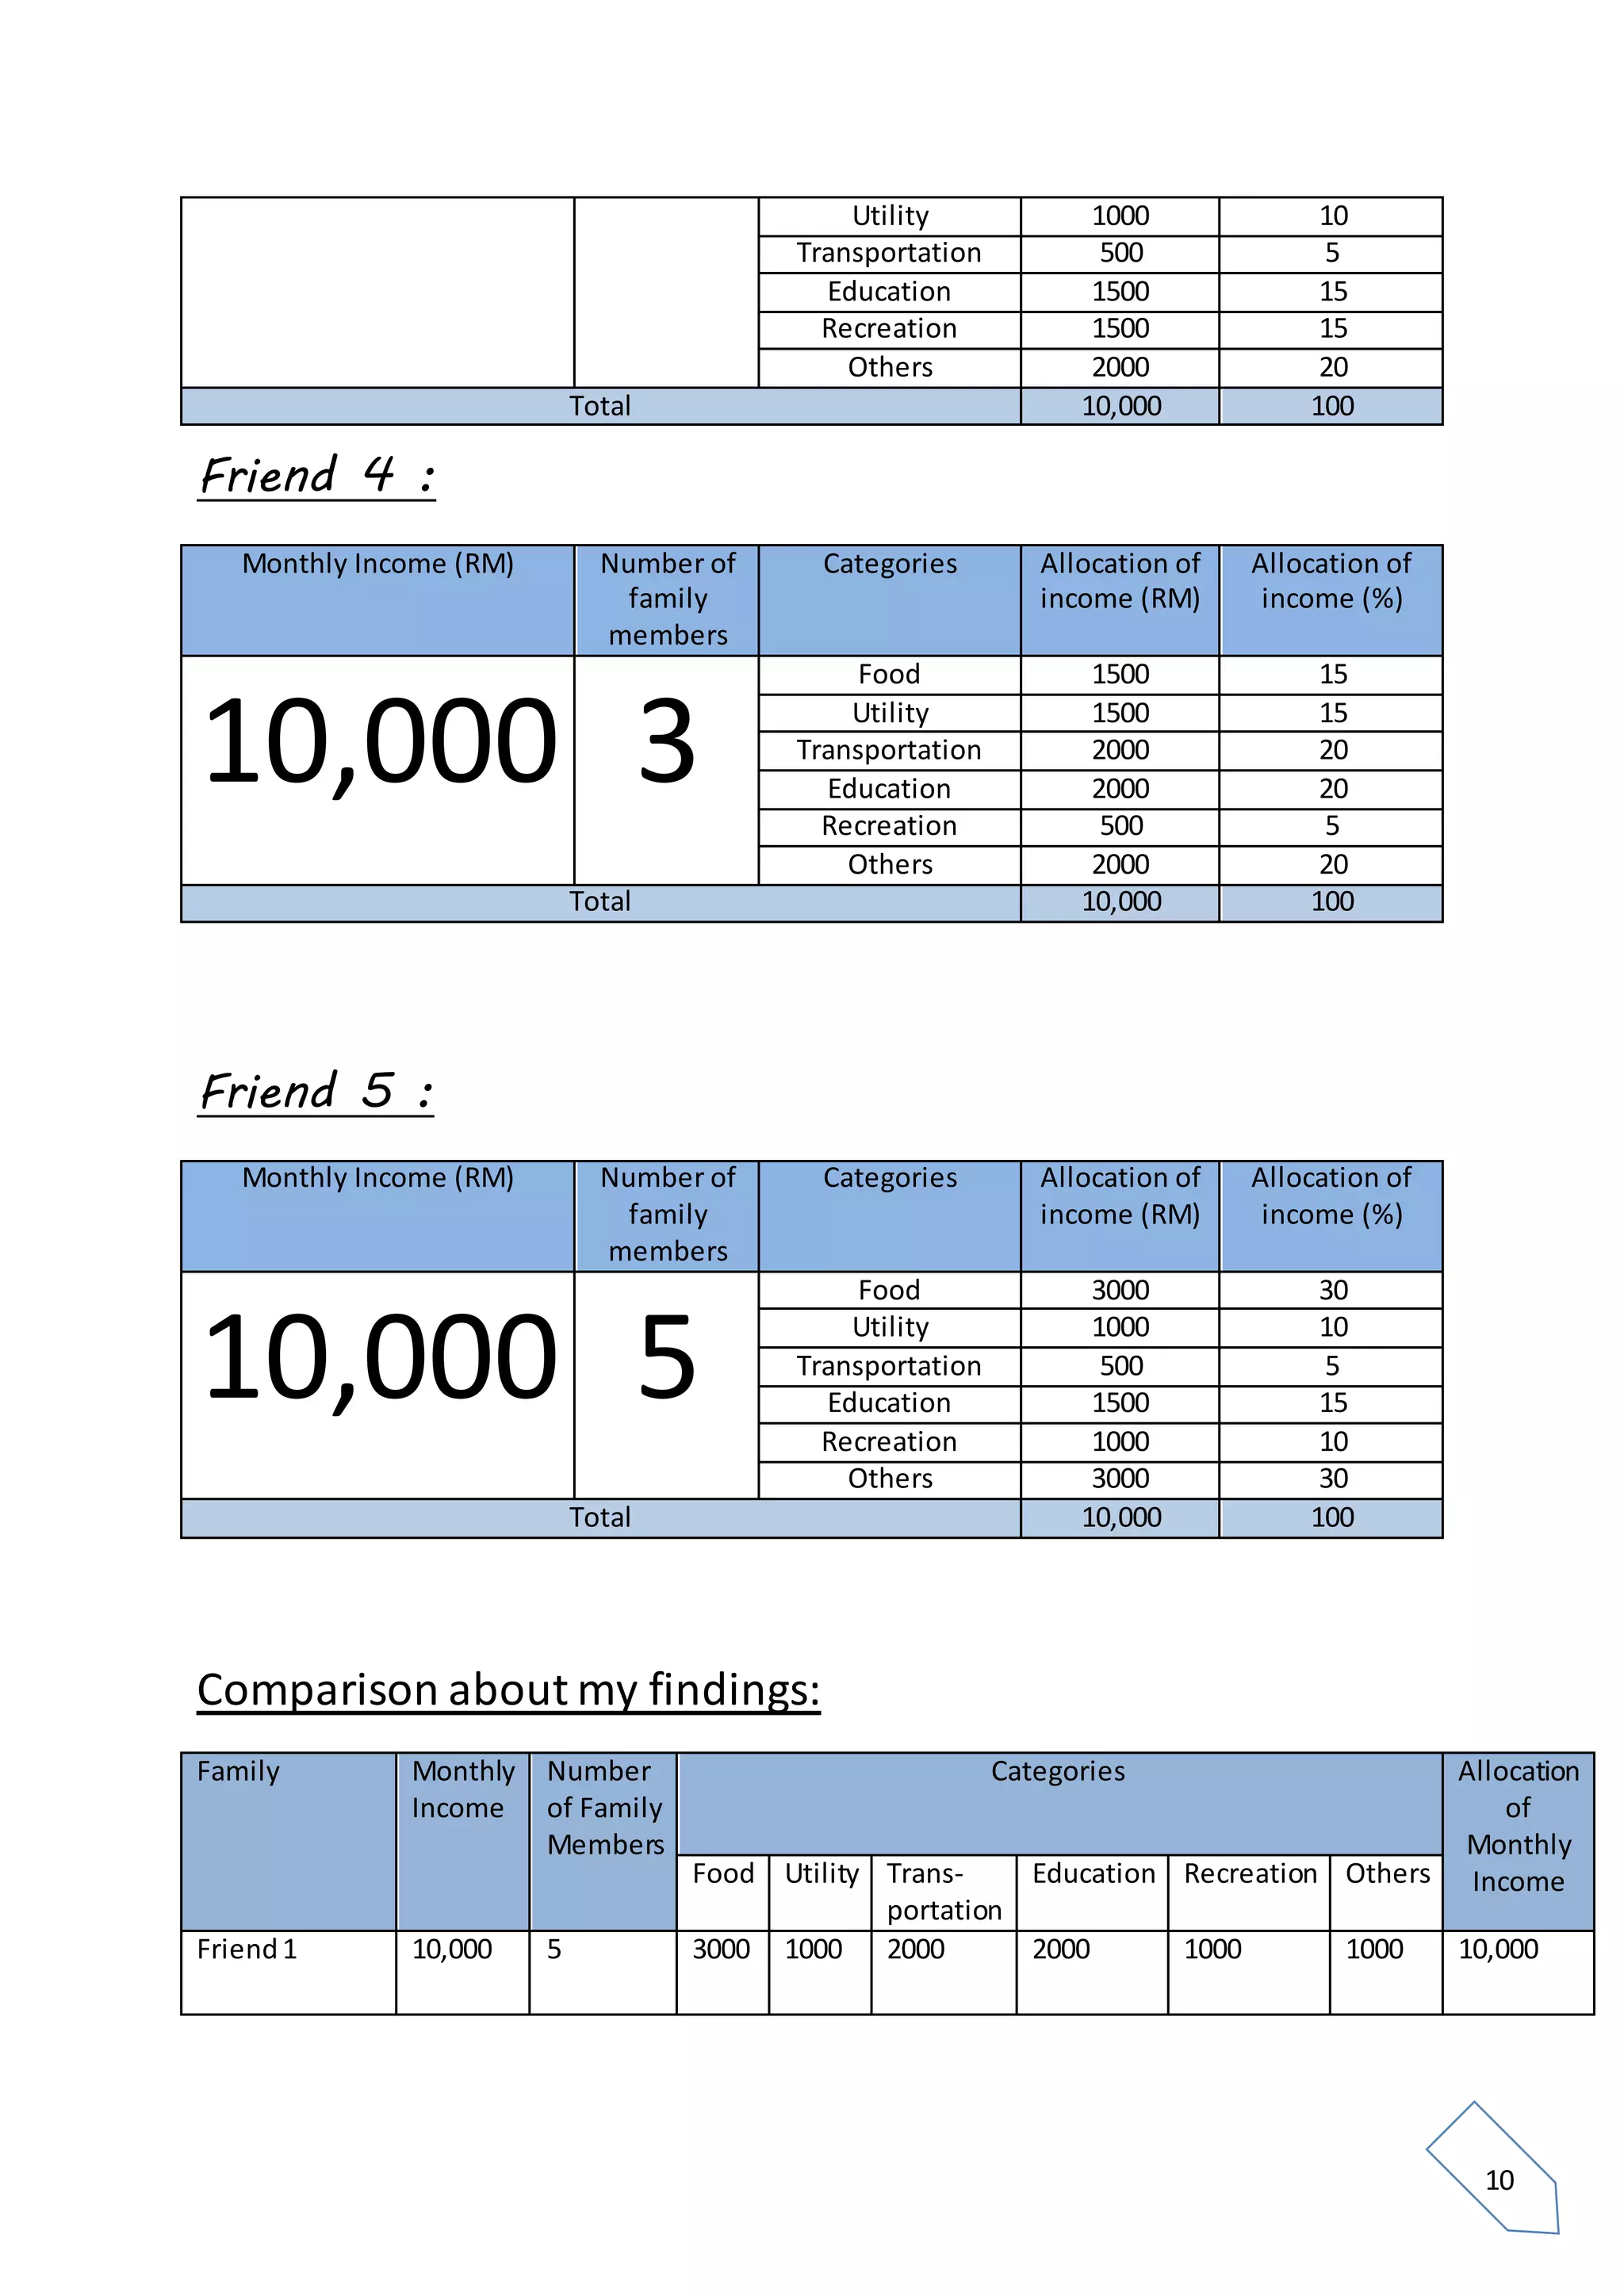
2) Comparison of monthly income allocation for 5 friends using data tables, graphs, and analysis.
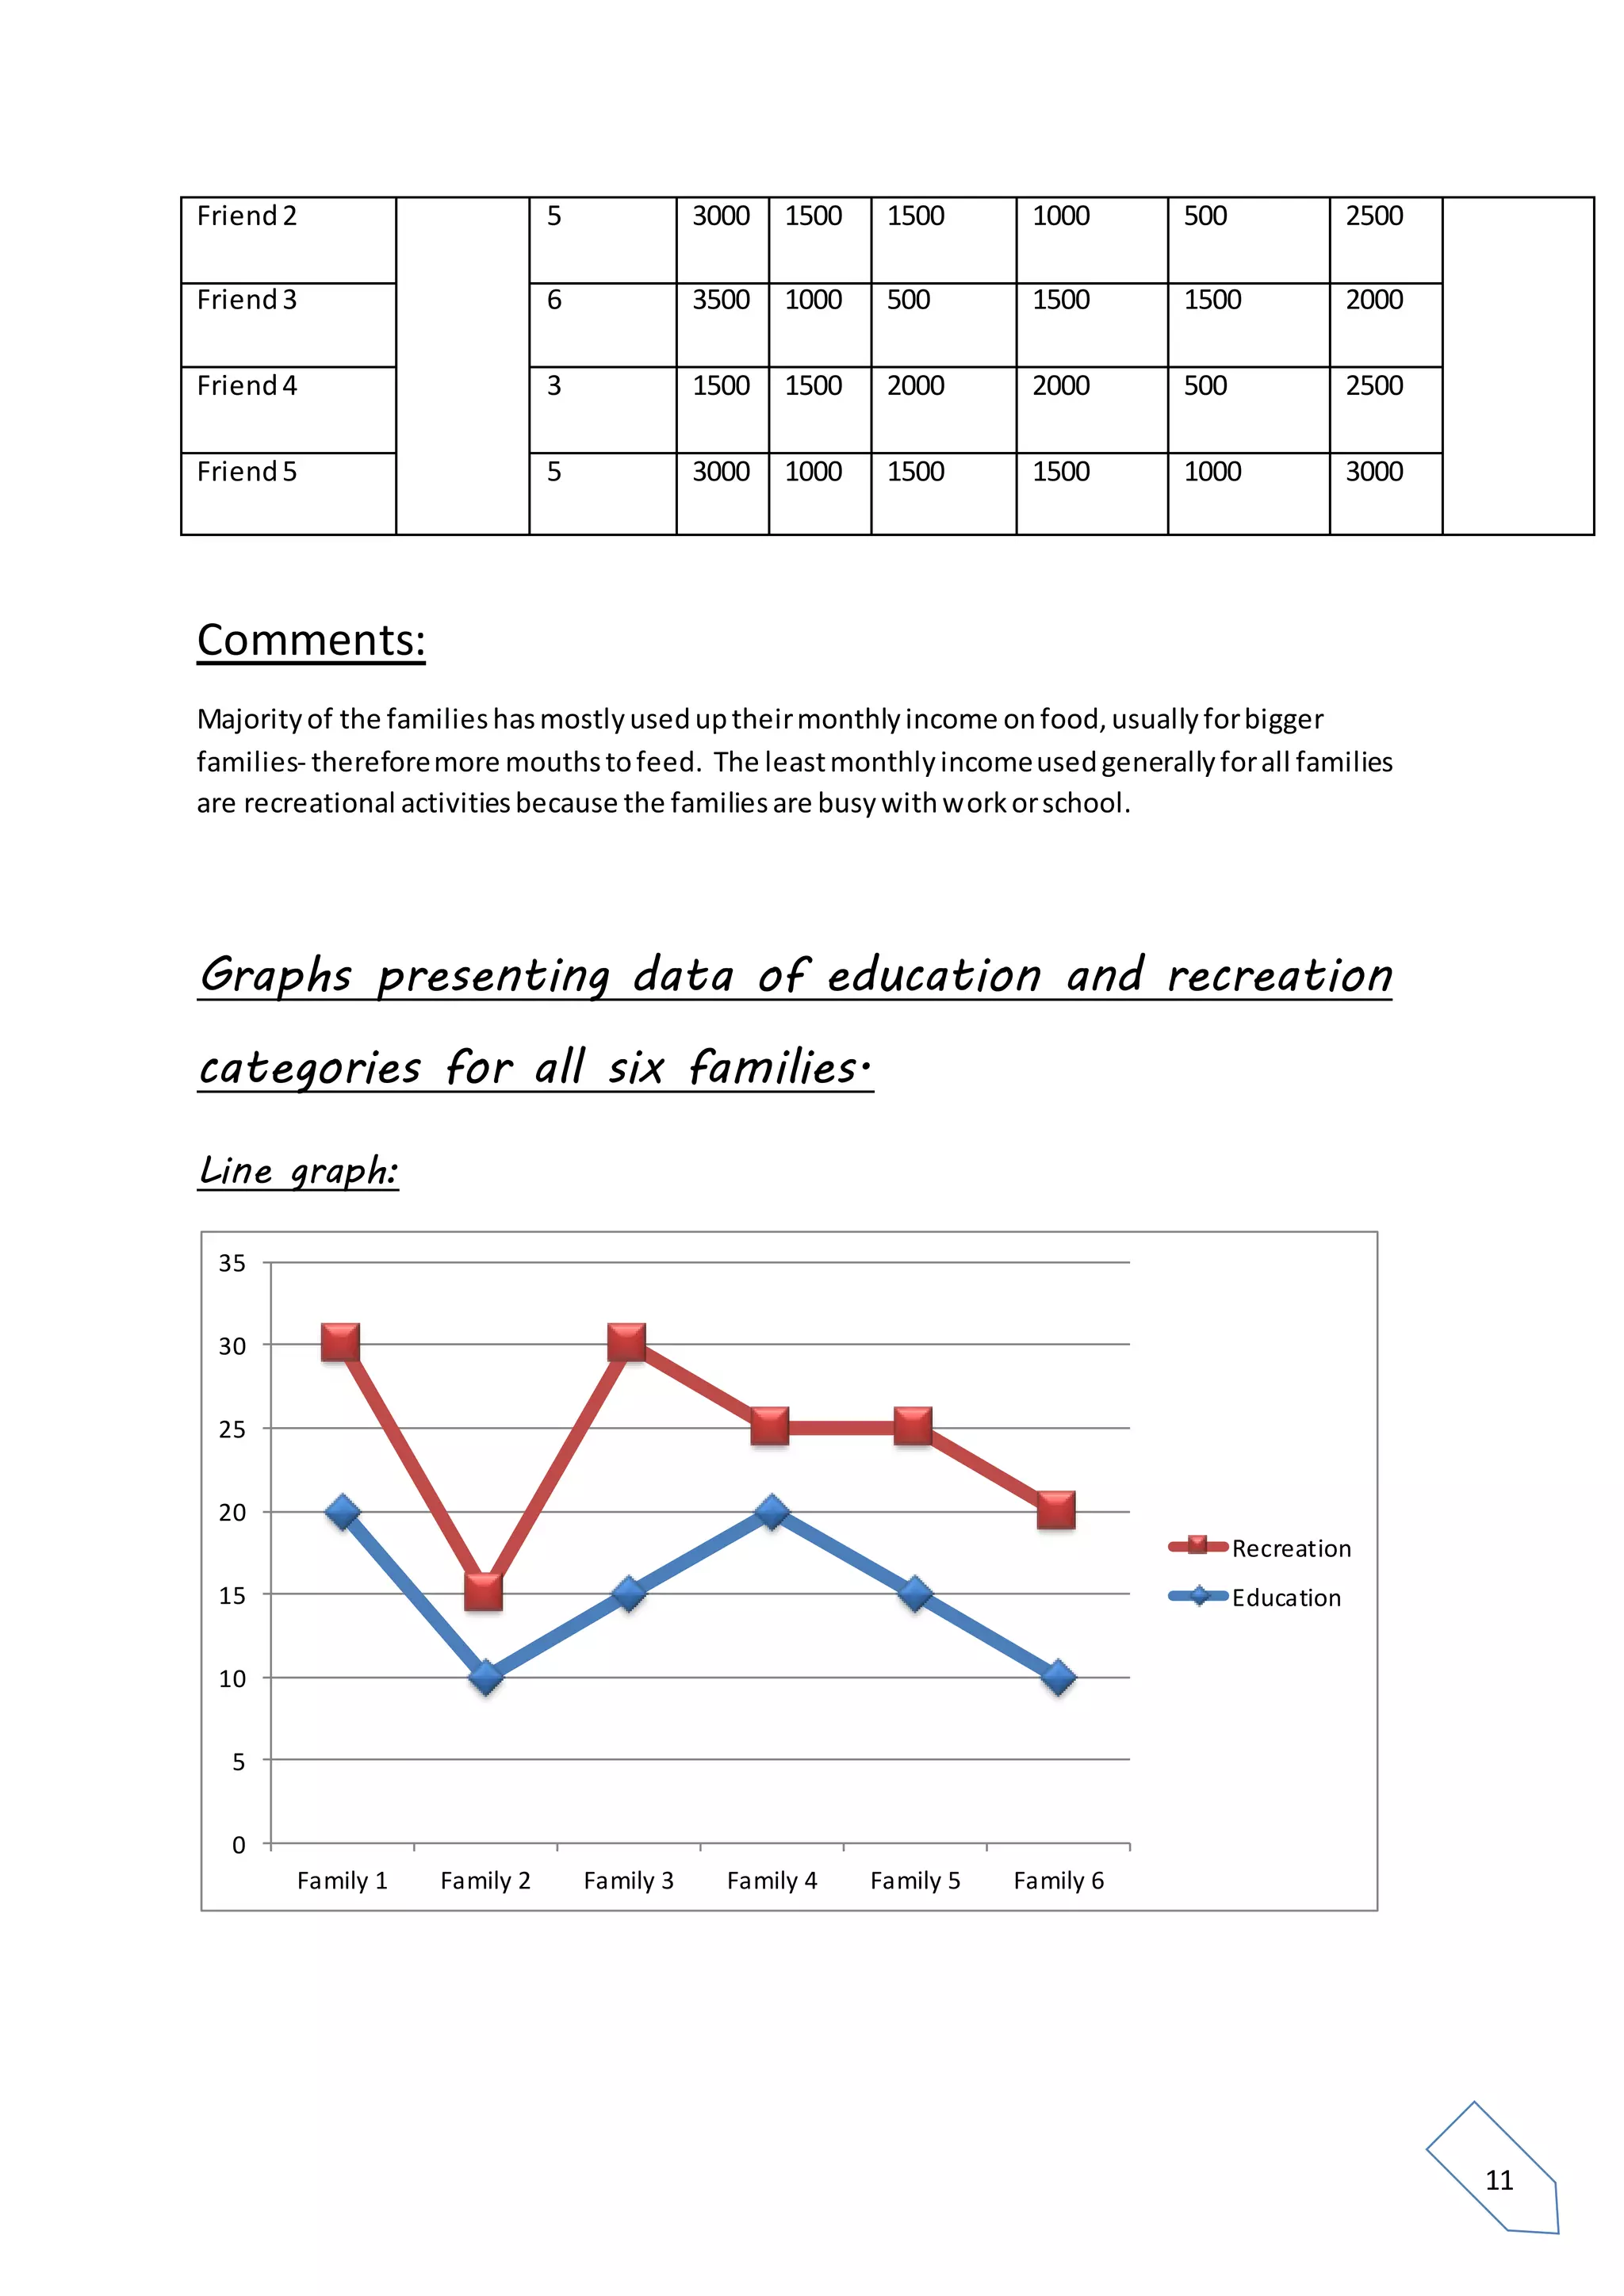
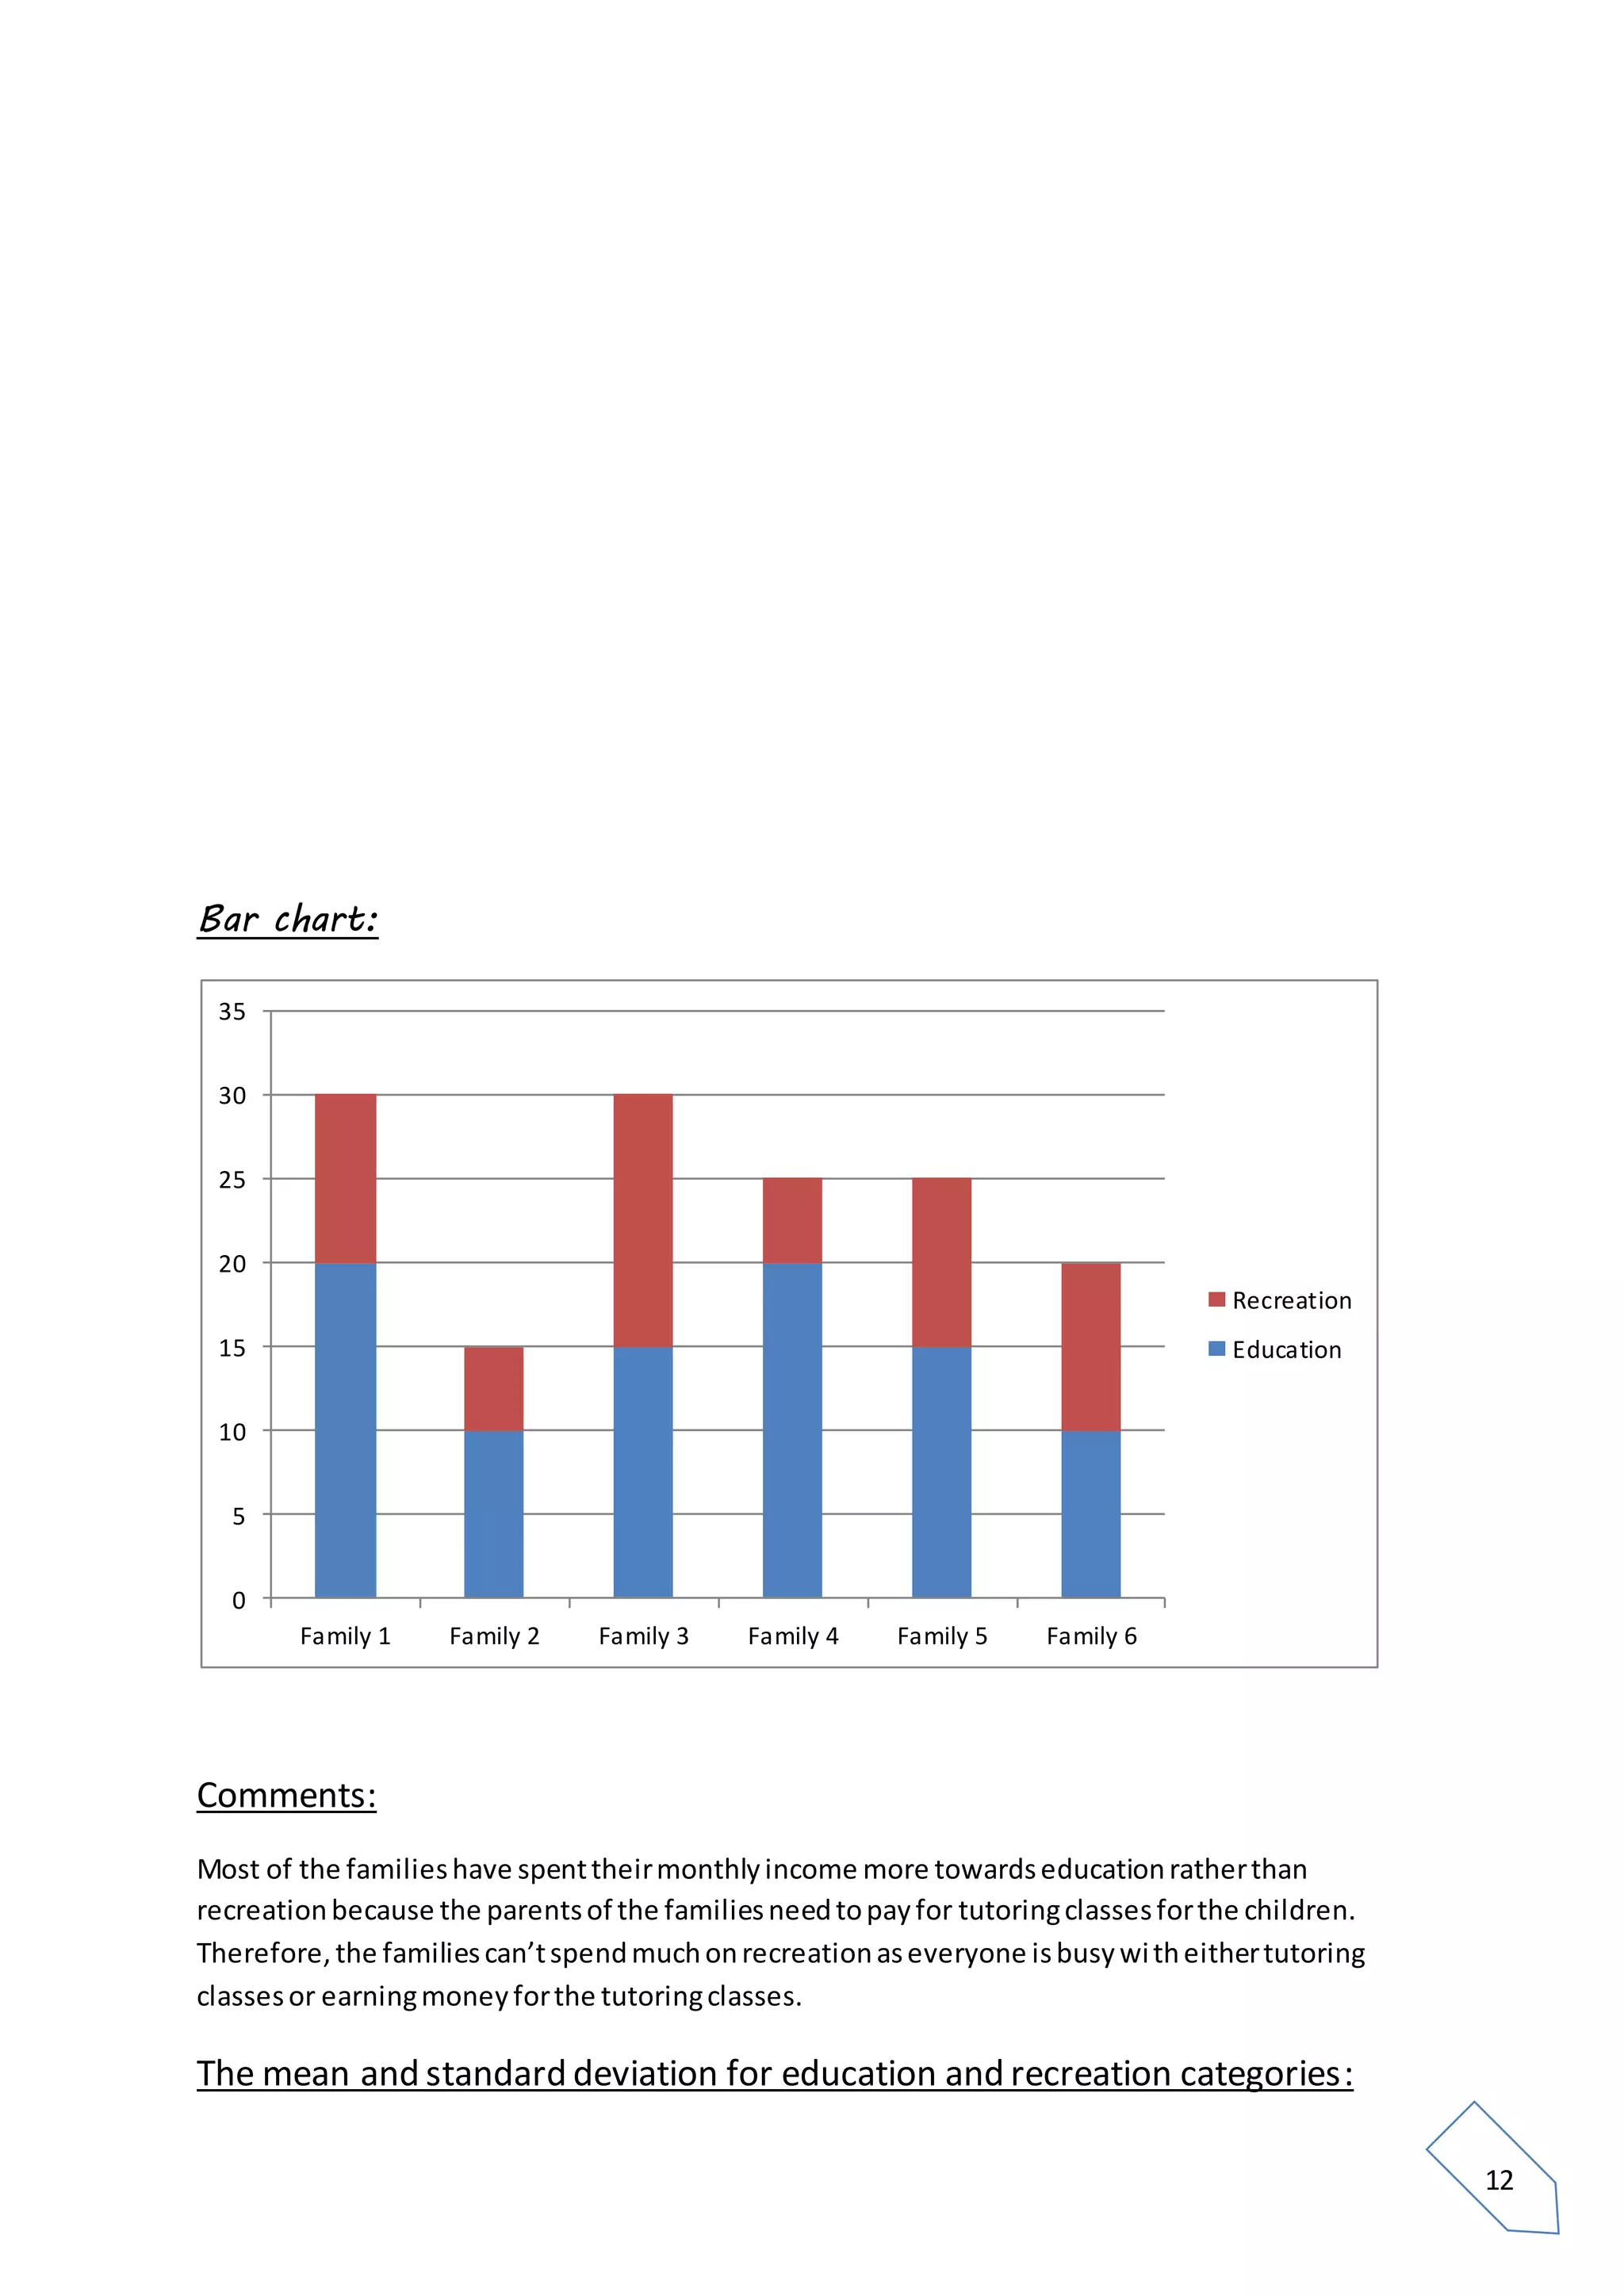
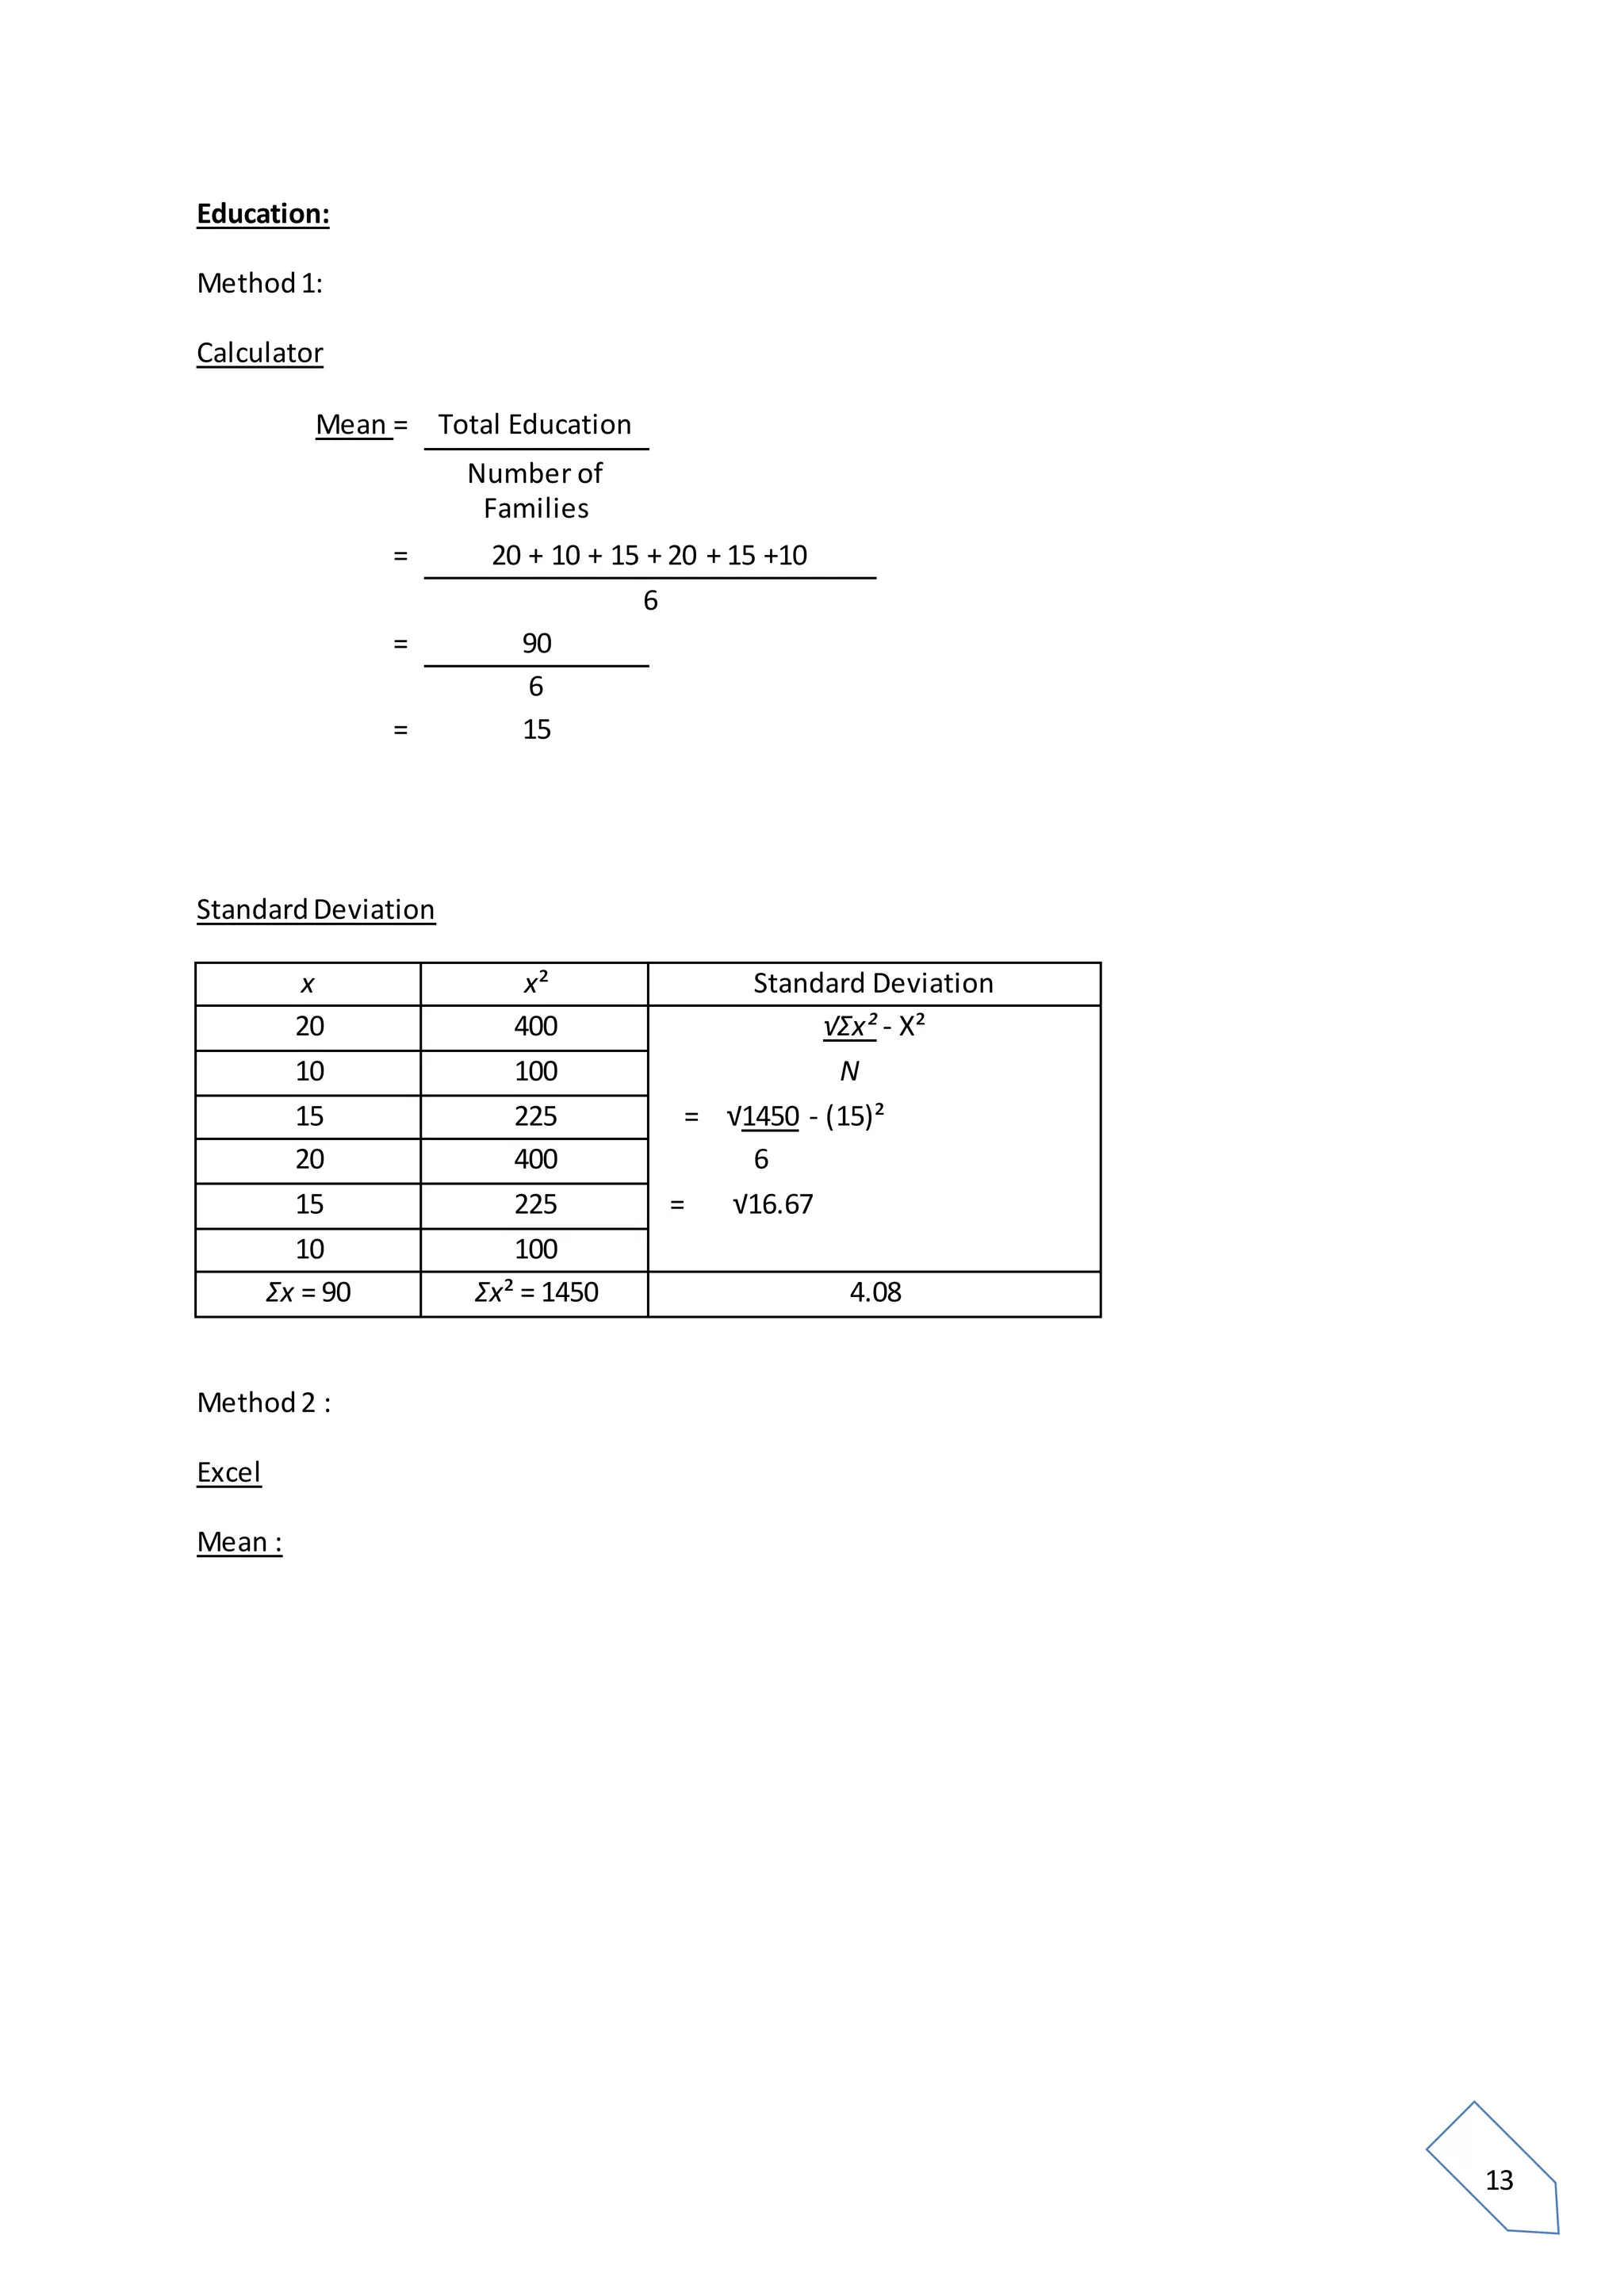
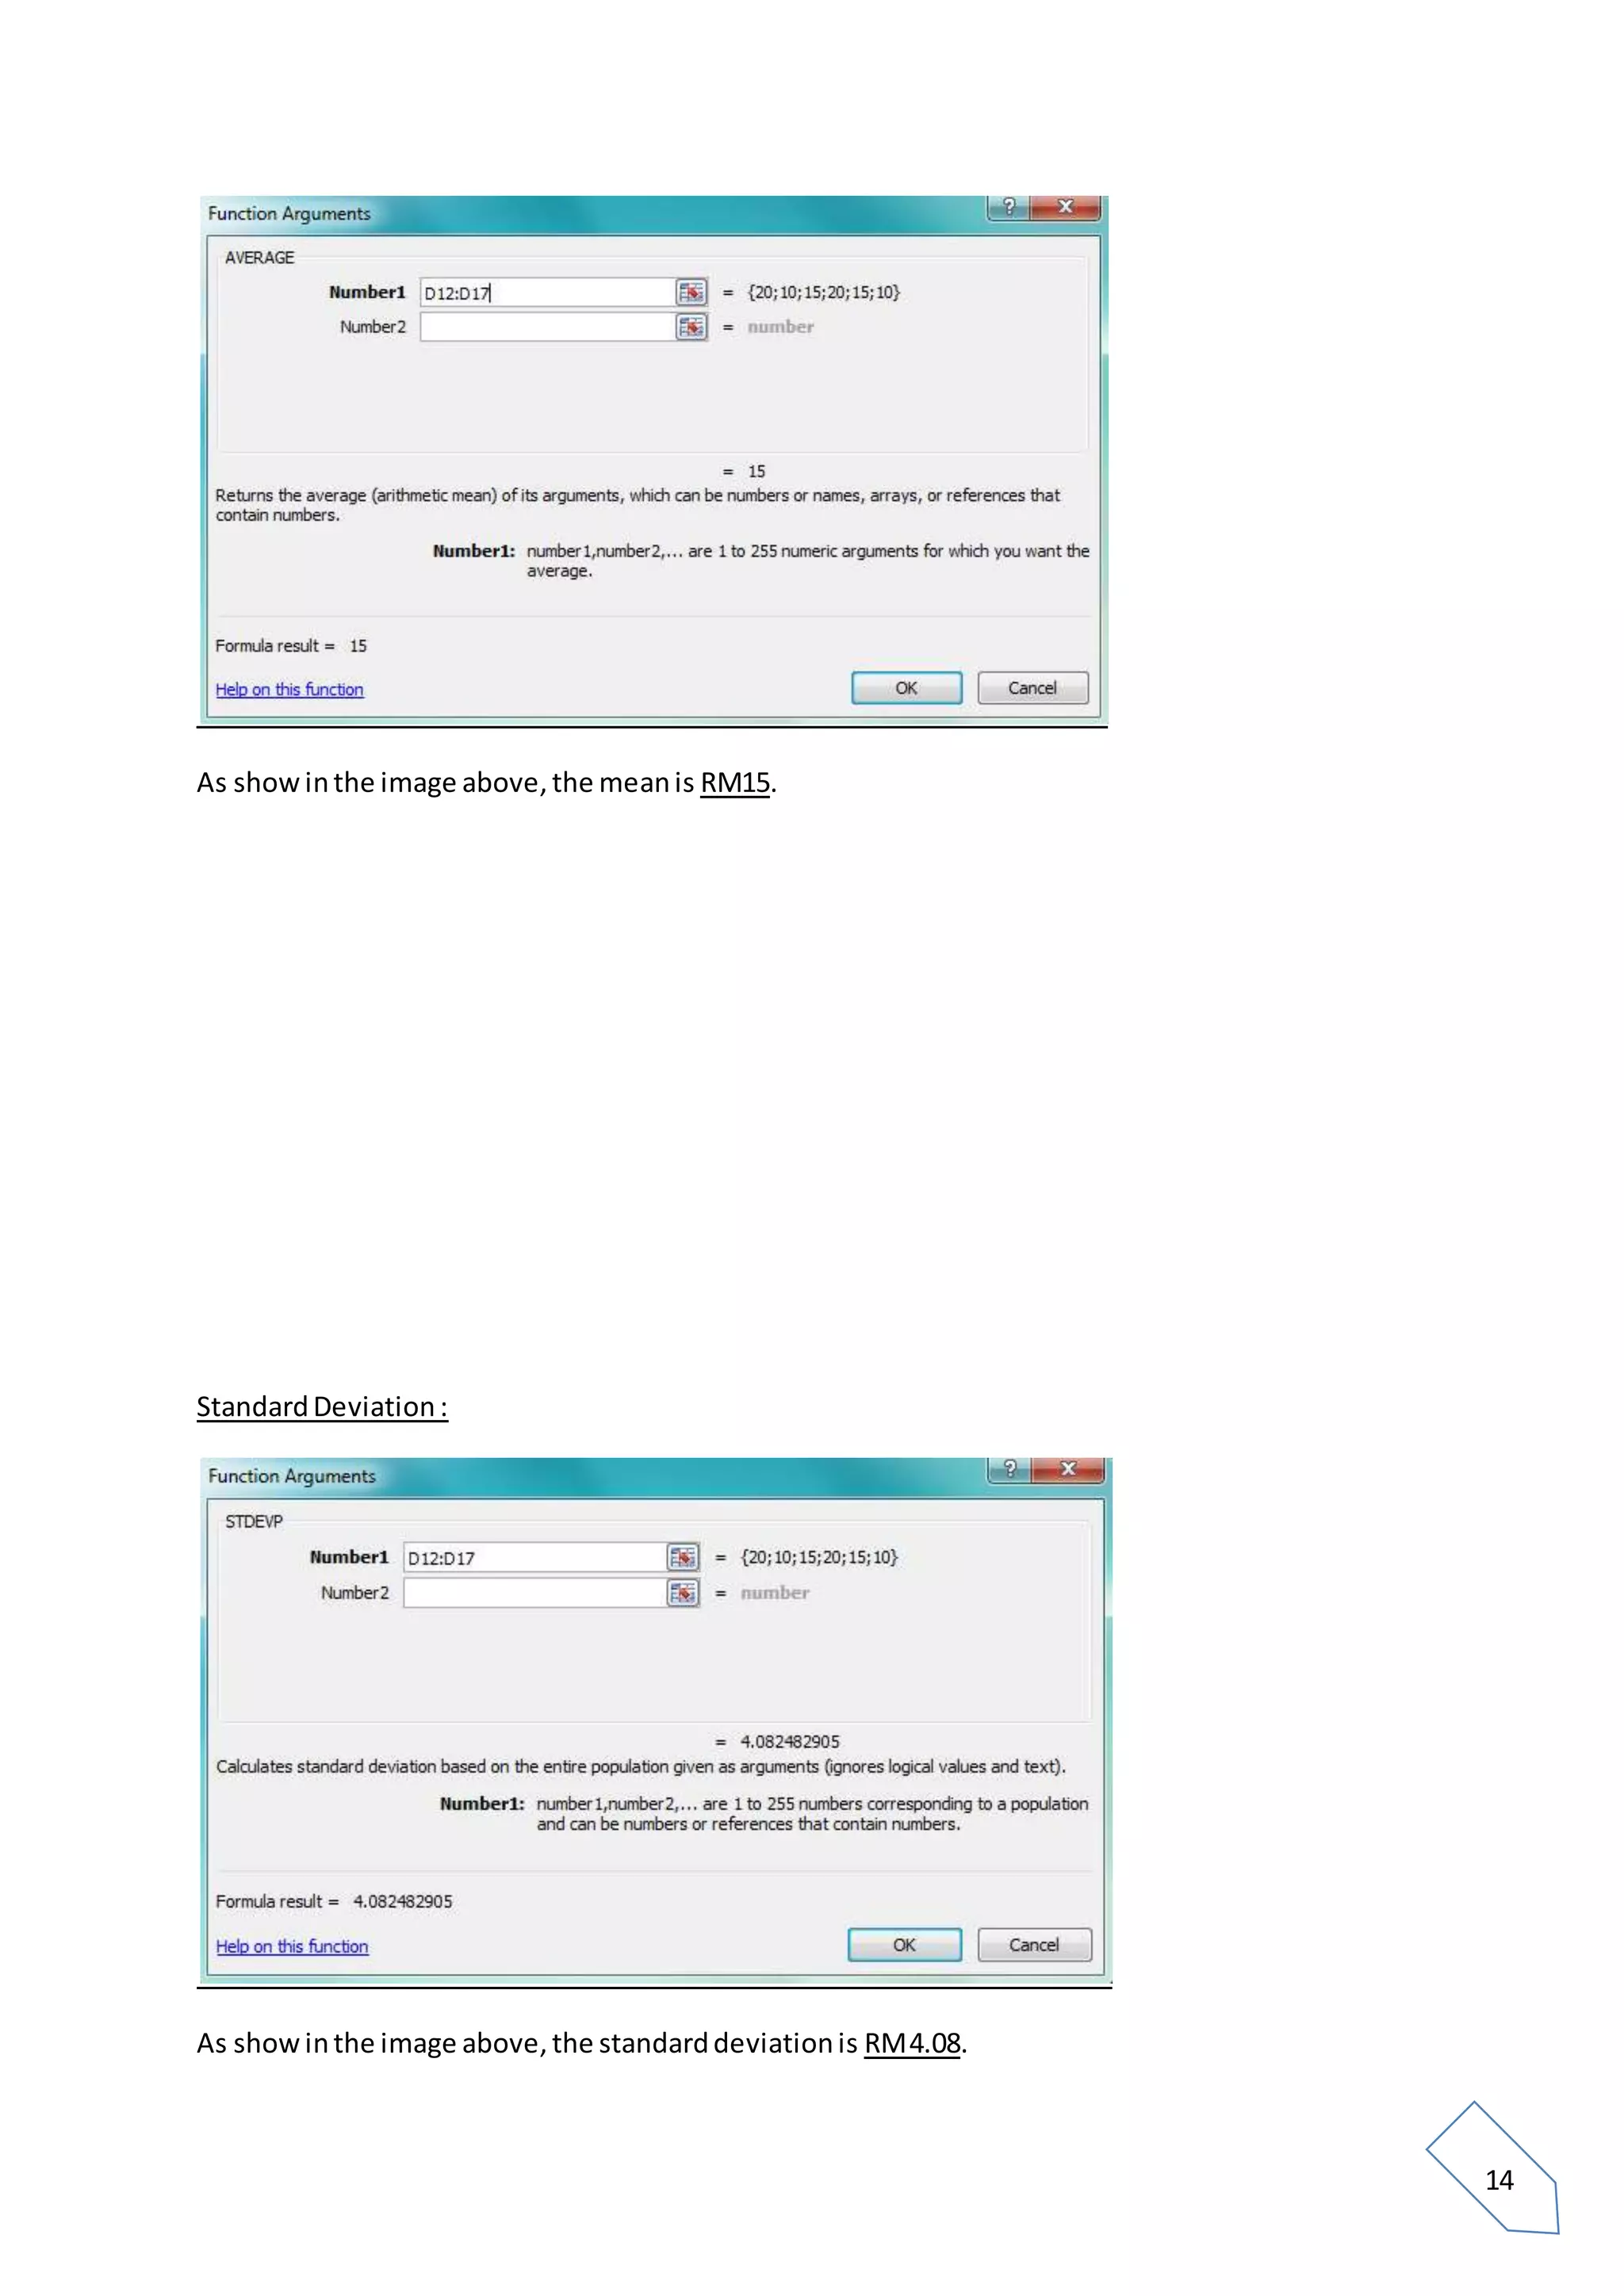
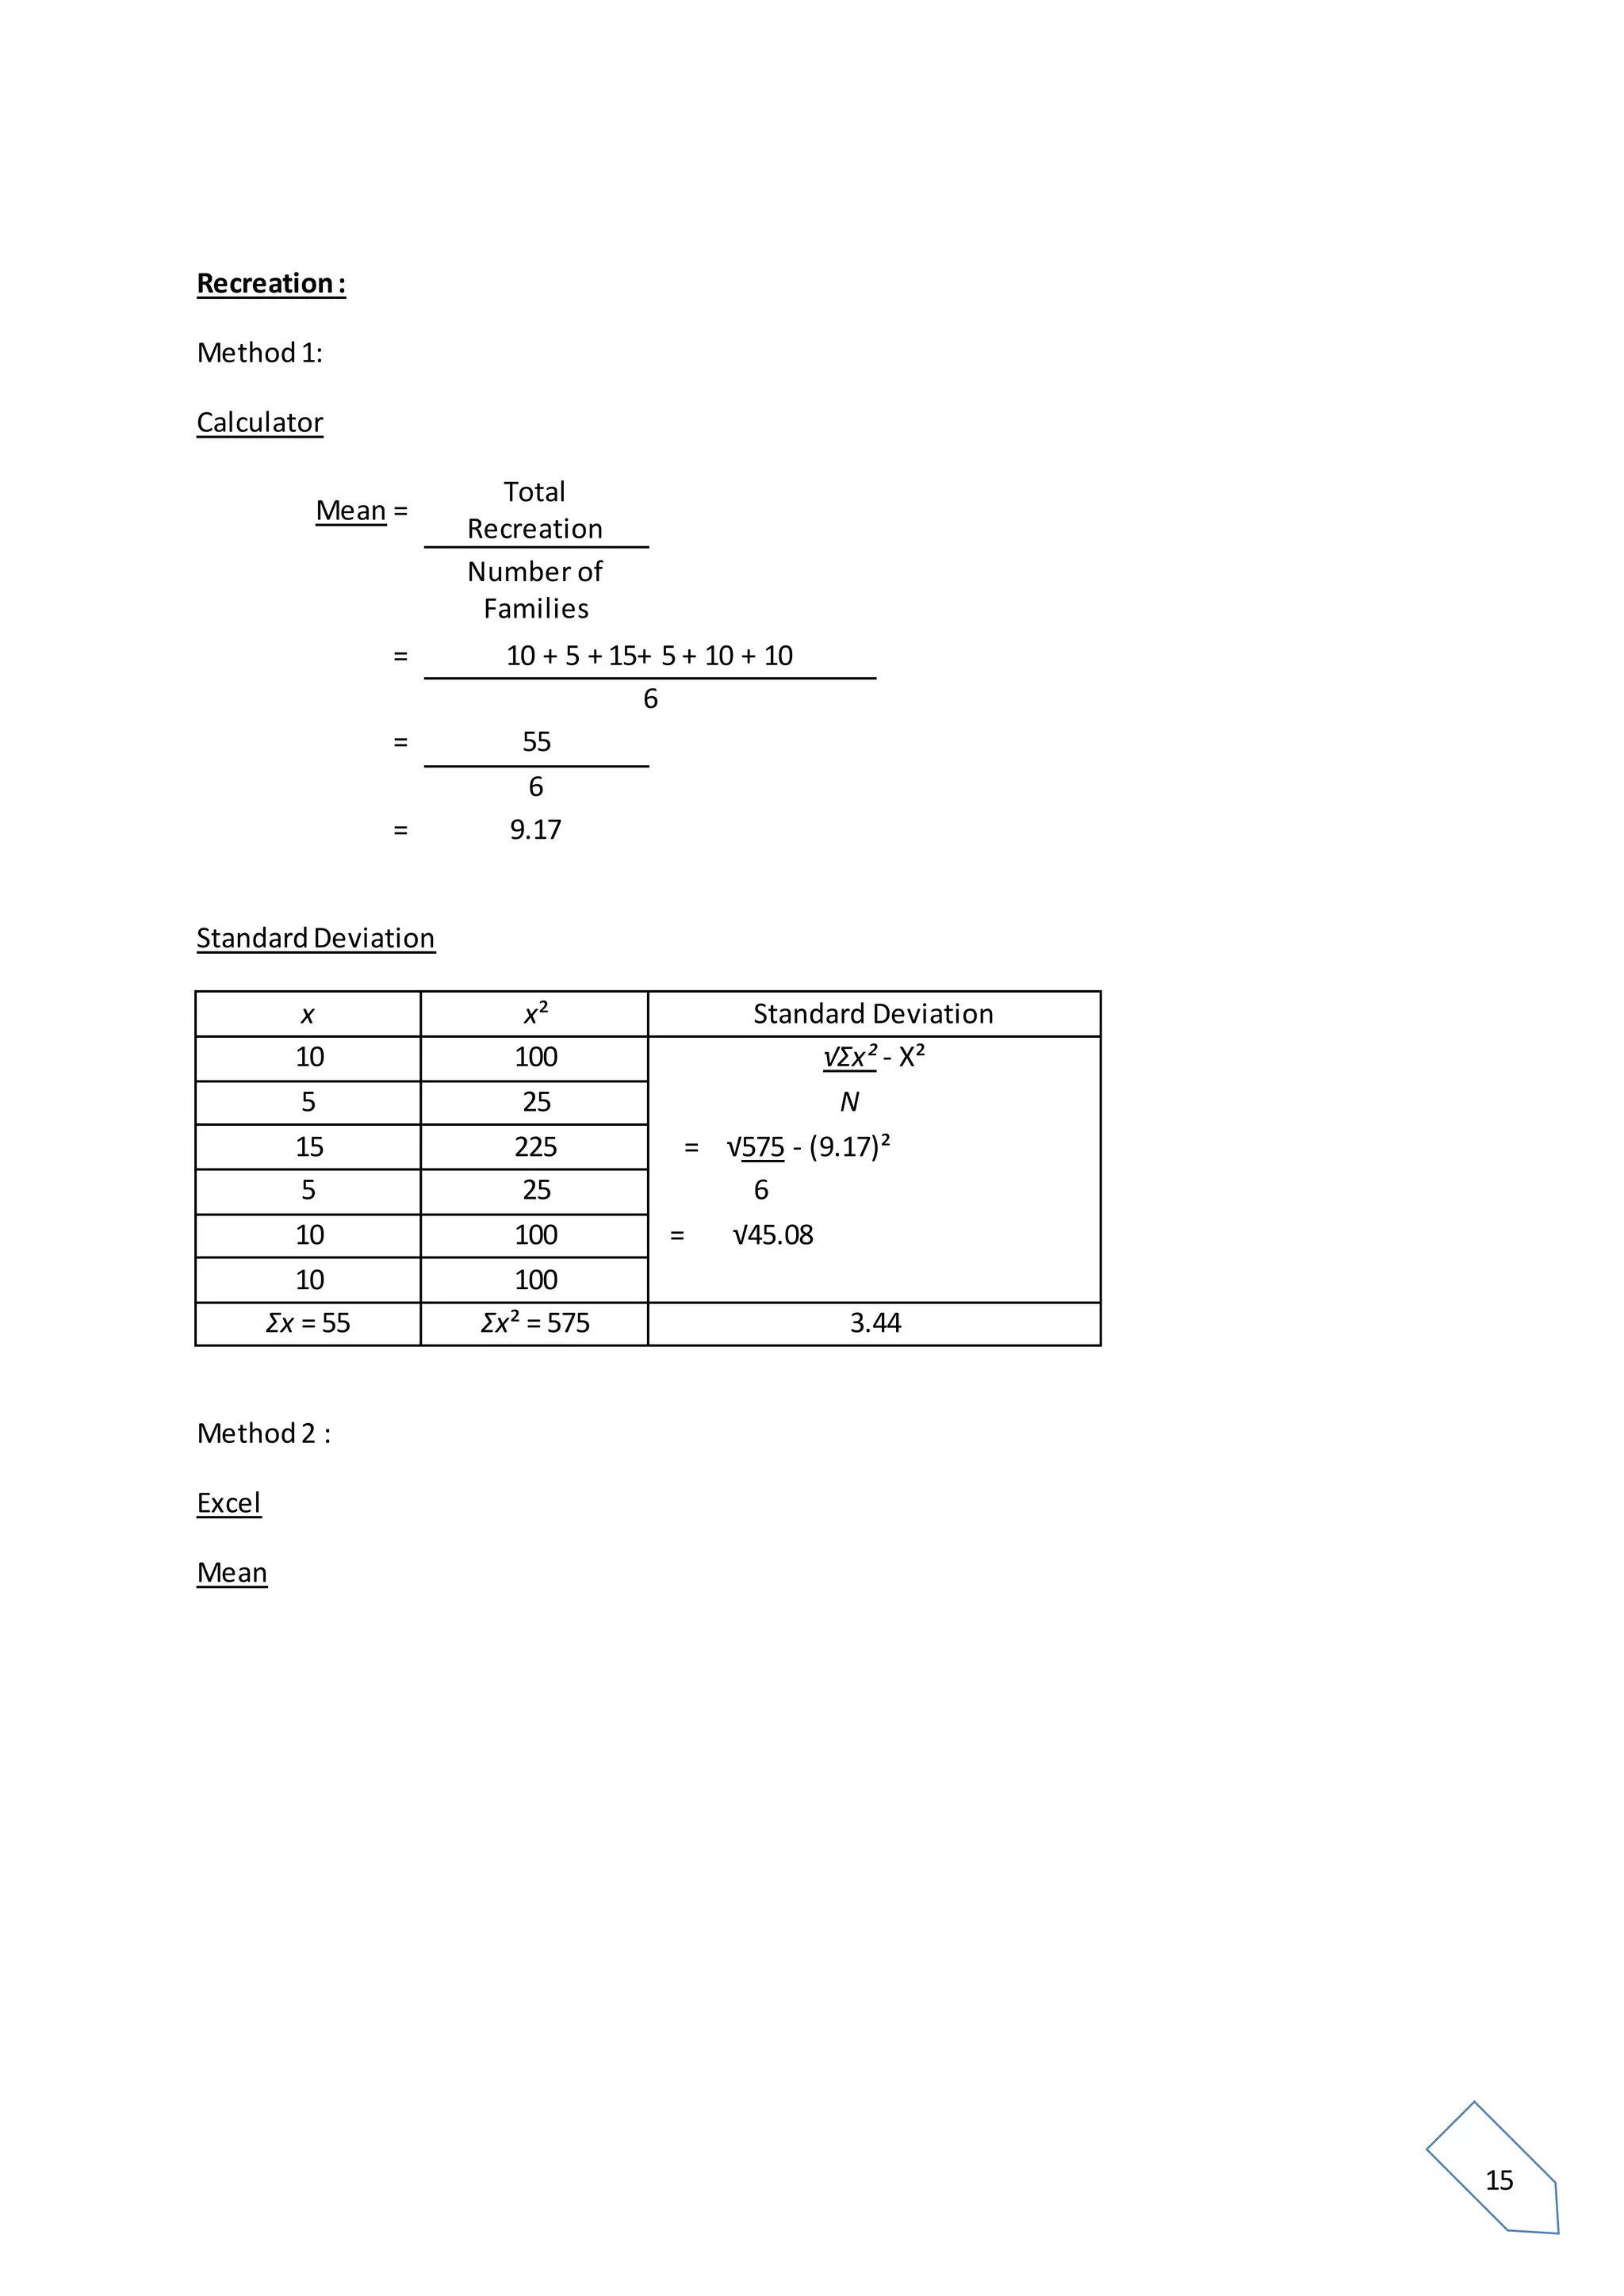
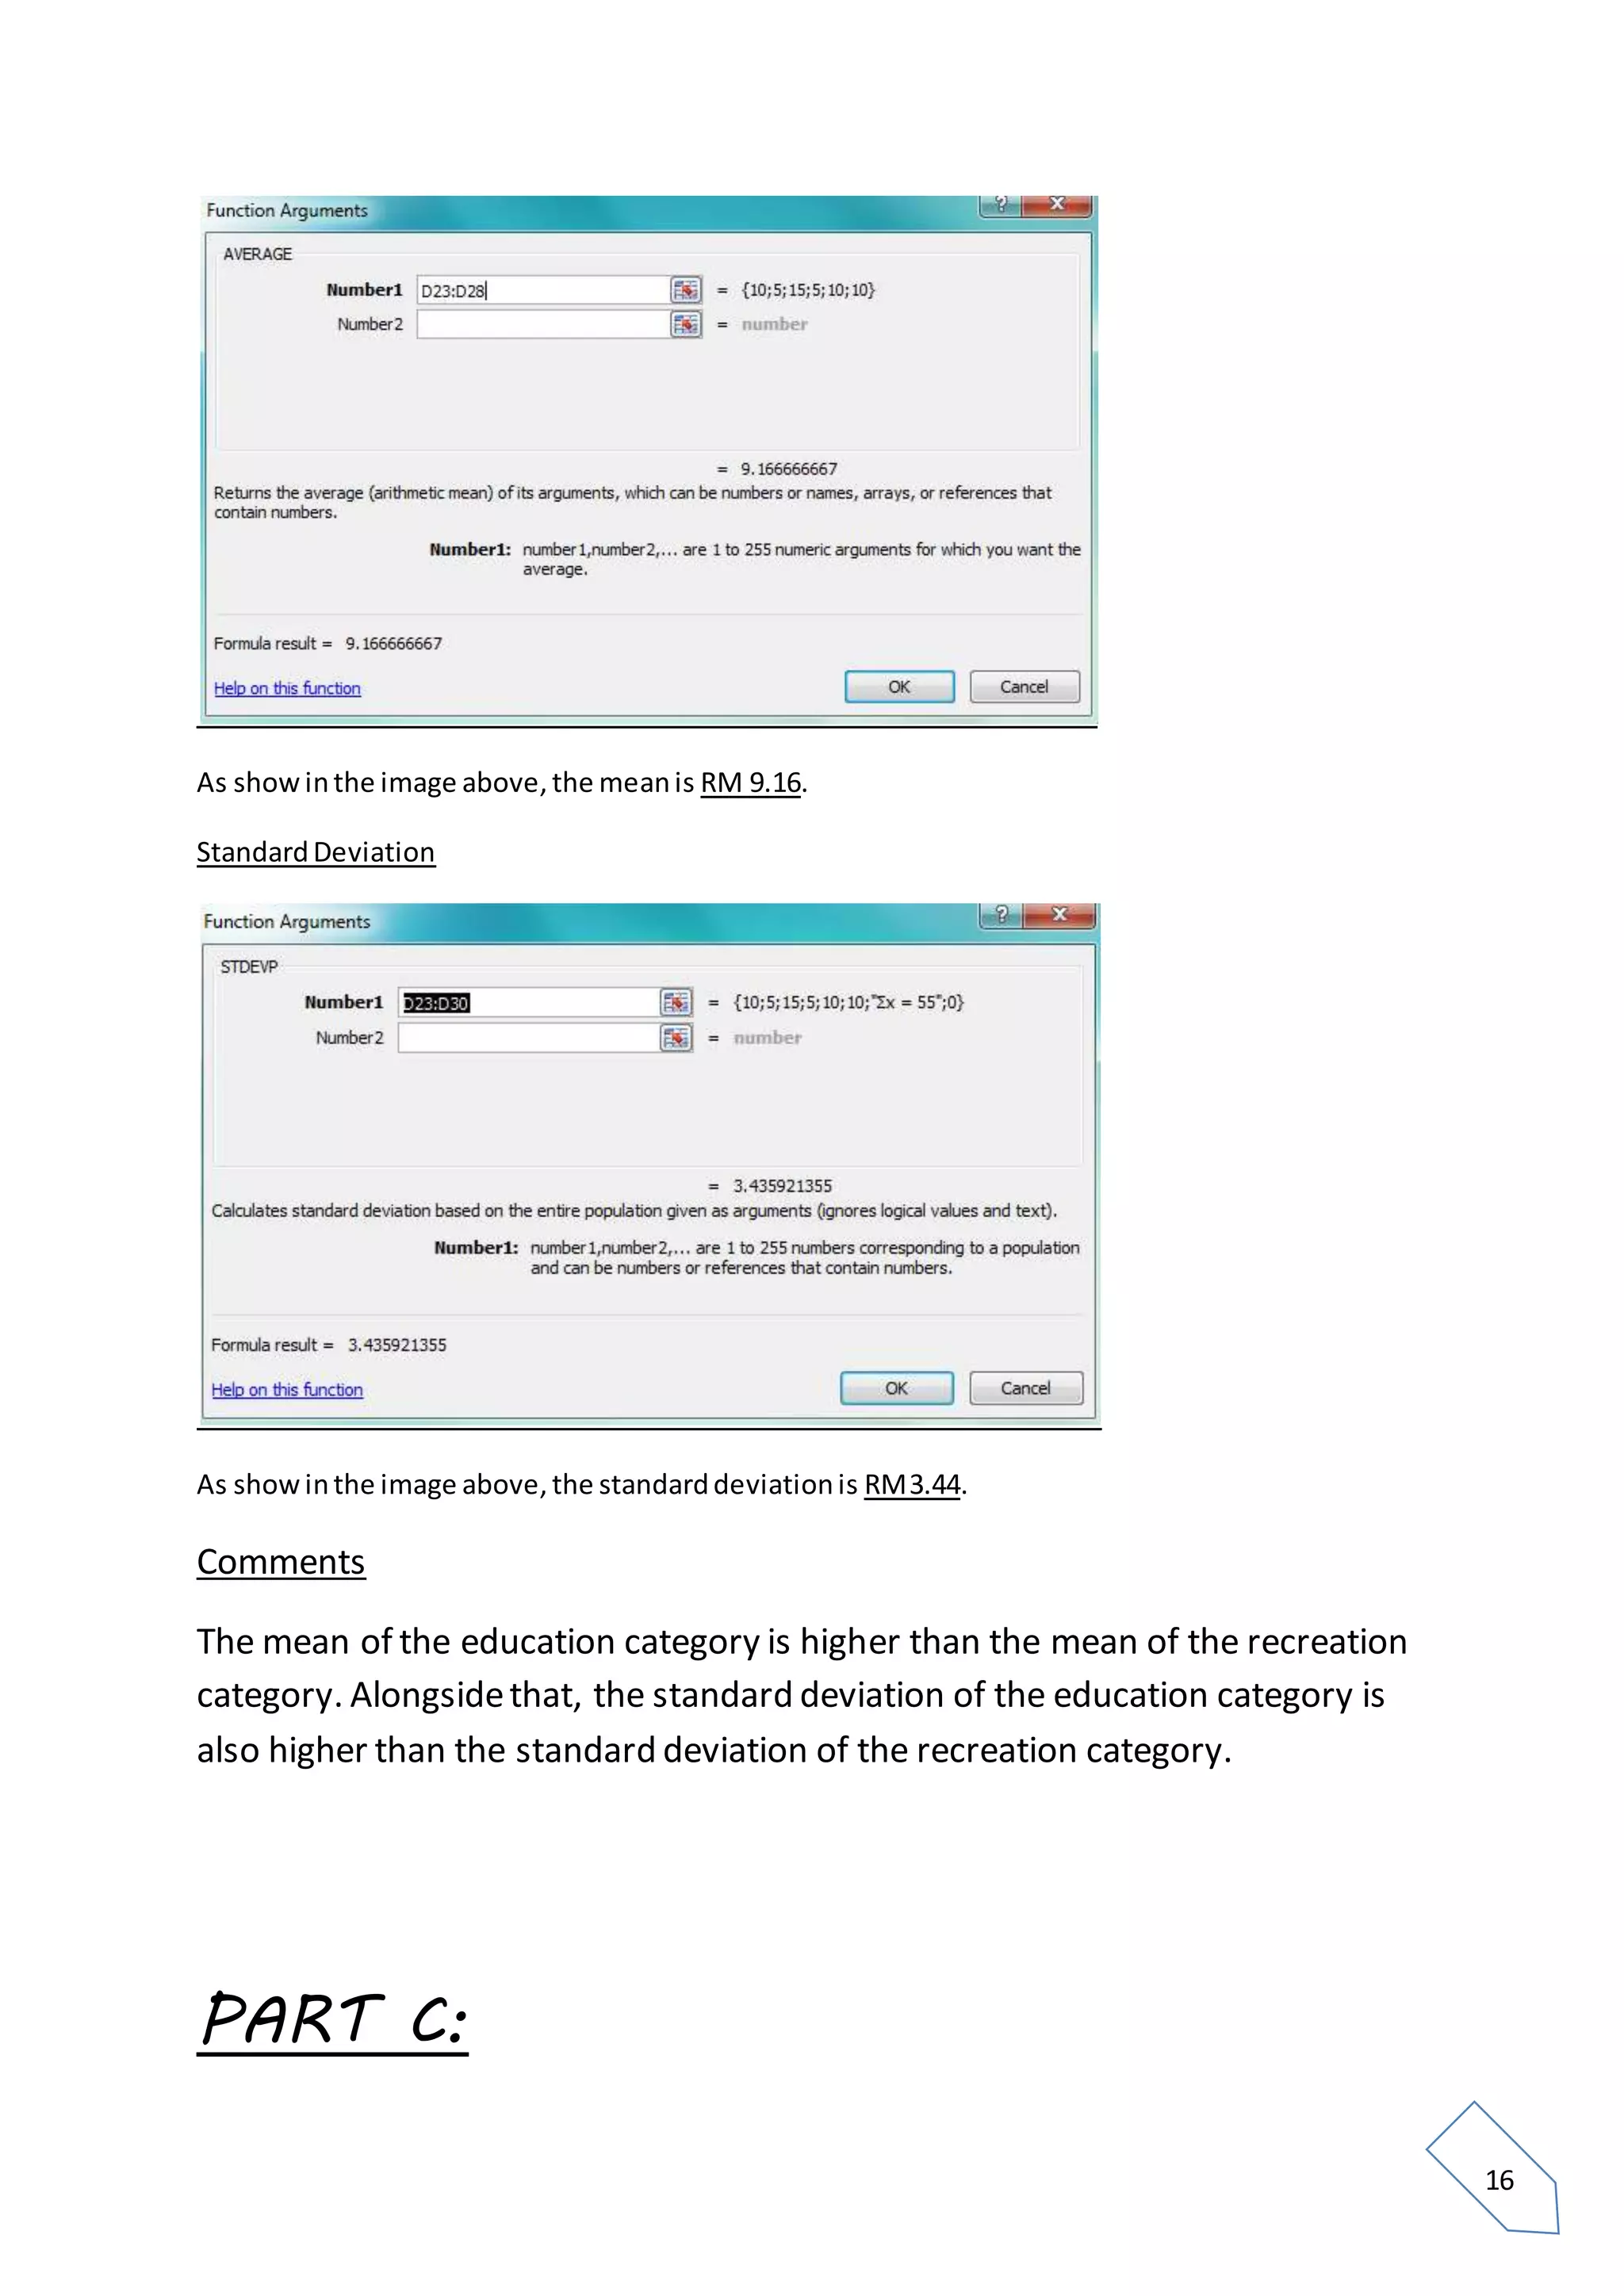
3) Examination of education and recreation spending for 6 families using line graphs, bar charts, and statistical measures.
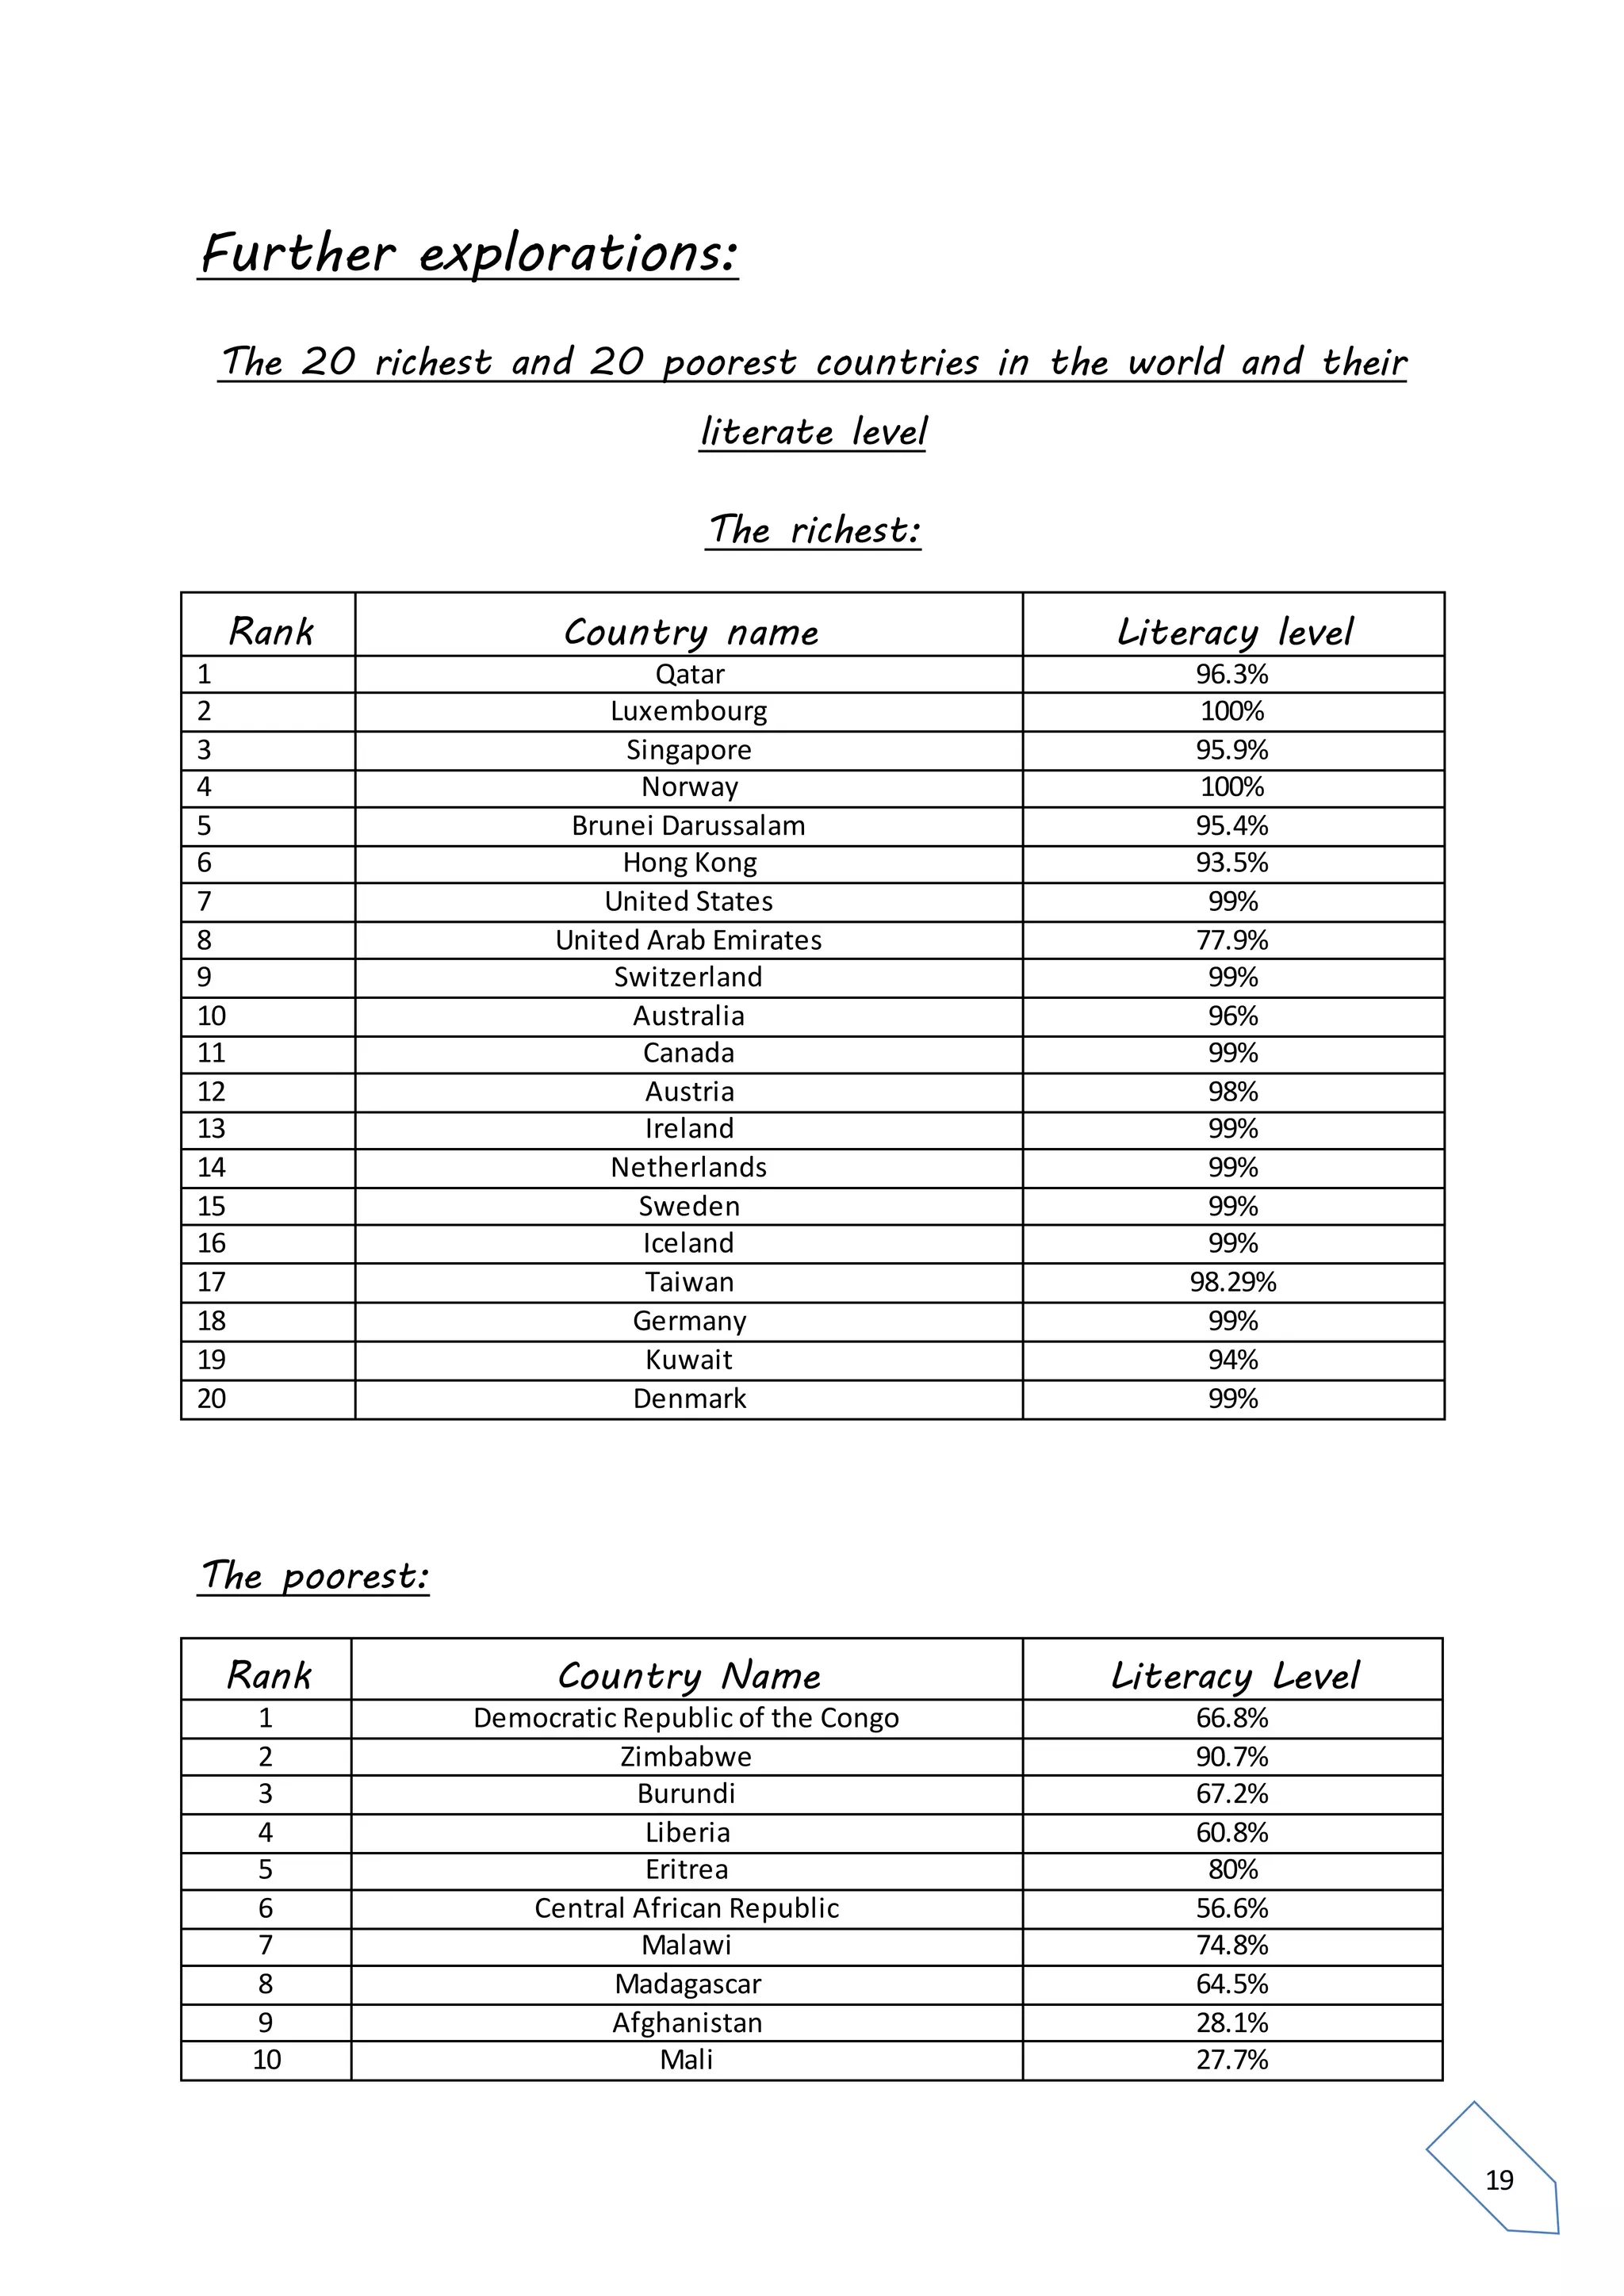
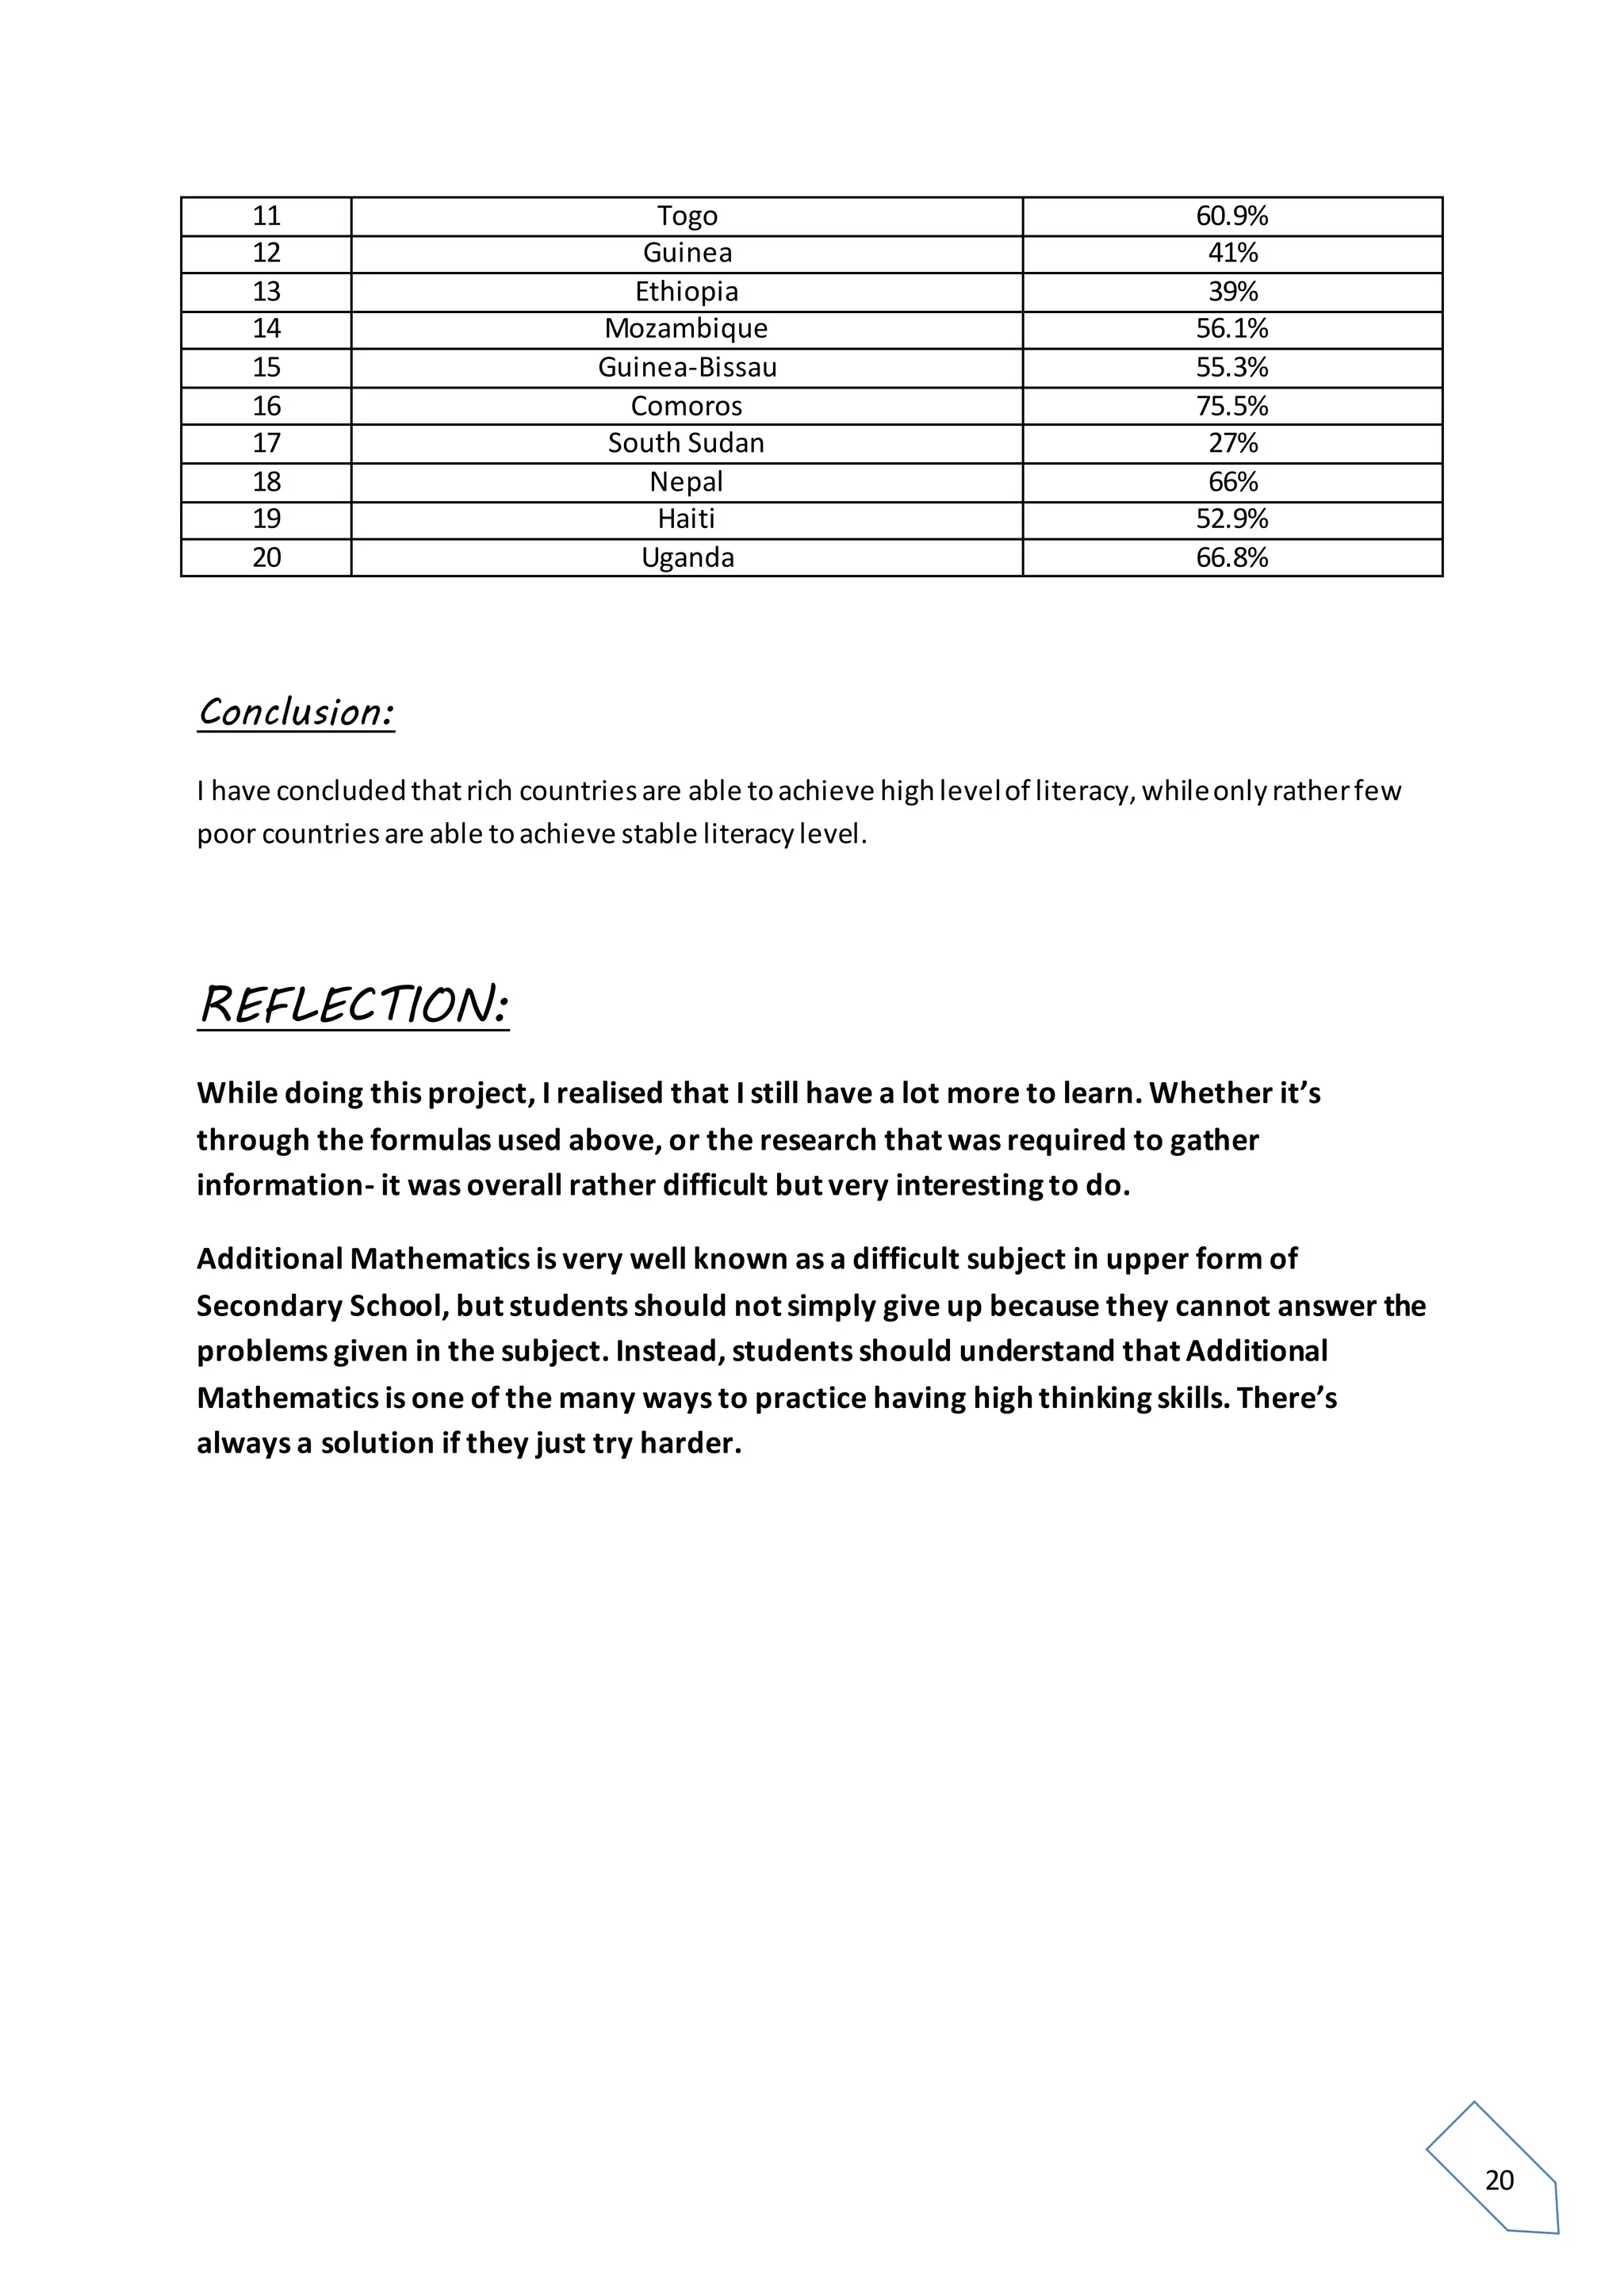
4) Exploration of literacy rates in the 20 richest and 20 poorest countries, finding rich countries achieve higher literacy.
The student concludes Additional Mathematics requires perseverance but helps develop high-level thinking skills.
The document provides instructions for a transpiration lab experiment using Impatiens plants. Students will simulate three environmental conditions: a sunny day using light, a windy day using a fan, and a humid day using a terrarium with water. As a control, one plant will be in regular room conditions without any variable applied. Students are asked to measure the mass of each plant over five days, graph the results, and write a lab report analyzing the effects of the different conditions on transpiration.
This document provides an outline for a research study investigating the causes and effects of ineffective parenting in the community of Canaan Heights. It includes sections on the topic, research questions, data collection methods, instruments used, procedures for collecting data from questionnaires distributed to community members, and plans for presenting and analyzing the data. The goal is to identify the main causes of ineffective parenting in the community and how it affects children, as well as recommendations for addressing the problem.
1. The document describes an experiment to determine the specific heat capacity of a metal using the method of mixtures.
2. A metal sample was boiled in water for 5 minutes and then quickly transferred to a Styrofoam cup containing water.
3. The temperatures of the metal and water were measured before and after mixing to calculate the specific heat capacity of the metal, which was found to be 368°C compared to the theoretical value of 380°C.
Social Studies School Based Assignments (SBA)Errol Hussey
The document is a social studies report on unemployment in the student's community. It investigates the factors contributing to unemployment, its effects on residents, and potential solutions. A questionnaire was administered to 15 unemployed community members. Most unemployed residents were found to be male with secondary education. Lack of job opportunities was the primary contributing factor. Unemployment was shown to cause financial stress for families and increase criminal activity in the community. Recommendations included increasing job and training opportunities as well as establishing an education program on family planning to reduce population growth and future unemployment.
1. The document determines the maximum dimensions of a corn farm that a farmer can fence using 100 meters of wire. The largest area is 625 square meters which occurs when the length and width are both 25 meters, making the field a square.
2. Using recommended spacing of corn seedlings, the document calculates the farmer can plant 4592 seedlings in the 625 square meter field by planting them in 28 rows with 164 seedlings in each row.
3. The calculations allow the farmer to utilize the maximum space available and determine the optimal number of seedlings to plant.
This document is a school-based assessment project examining the effects of a father's absence on female teenagers. It includes an introduction outlining the problem, a literature review, methodology using questionnaires, data collection and analysis, findings, and recommendations. The key findings are: 1) Majority of females are affected by the absence of their father and see this as causing misbehavior. 2) Many females did not grow up with their fathers. 3) Fatherless females prefer male to female company. The recommendations are for family counseling and legal arrangements to ensure father involvement, and for government job training programs.
This document contains a 10 question survey to collect data for a geography student's examination on flooding in Ward Avenue, Mandeville. The survey asks questions about the respondent's business in the area, how flooding affects them, what they believe causes flooding, and what strategies they think could help reduce flooding. Respondents are assured confidentiality and asked to answer all questions truthfully to aid the student's research.
The document summarizes data collected on mobile signal strength for LIME and Digicel networks in the area of Vide-Bouteille, St. Lucia. 15 random areas were selected to measure signal strength using LIME and Digicel phones. For each area, 10 readings were taken and the mean calculated. The data shows most LIME customers received average to good reception, with a few areas of excellent or poor reception. Statistical analysis of the LIME data, including measures of central tendency, variance, and standard deviation, was performed. A similar process was followed to collect and analyze data for the Digicel network. The results will be used to test which provider has better overall coverage in the area using hypothesis
The document is a school assignment on water pollution in East-La Penitence, Guyana. It includes a statement of the problem, reasons for choosing the topic, data collection methods, presentation of survey results, analysis, findings, and recommendations. The survey found unsanitary residents and non-collection of garbage to be major causes of water pollution. It recommends educating residents on proper waste disposal and signage indicating illegal dumping areas to help solve the problem.
This document appears to be a social studies SBA (School Based Assessment) submitted by a student named Adrian Robinson. It investigates the topic of juvenile delinquency in the community of Claremont Drive in St. Catherine, Jamaica. The student conducted research through questionnaires to identify factors contributing to juvenile delinquency in the area, how it affects residents, and potential solutions. Key findings were that dysfunctional families are a major cause, it affects residents through obscene language use, and the best solution is to educate juveniles on building self-esteem. The student makes recommendations to address these issues and help reduce juvenile delinquency in the community.
The document outlines the methodology and findings of a research project on violence in public schools in Guyana. It includes a cover letter, questionnaire, data collection procedures, presentation of data through bar graphs and pie charts, interpretation of the data, findings, and recommendations. The data shows that males are more aggressive than females, peer pressure is the main cause of violence, and suspension is the most common method used to reduce violence.
The document describes an experiment to determine whether an ordinary six-sided die is biased. Students were split into groups and each group performed one of six experiments, throwing the die 120 times on different surfaces. The experiments varied whether the die was shaken in the hand, a Styrofoam cup, or glass cup before being thrown on a varnished or cloth table. The results were combined and frequencies of each face landing uppermost were recorded. Charts and calculations were used to compare results and probabilities across experiments to reach a conclusion on bias.
The document is a school-based assessment submitted by a student named Jamela Shukura. It investigates how marijuana affects the adolescent brain. The assessment includes a plan of investigation, artifacts from research sources, and reflections on the sources. It finds that marijuana can harm adolescent brain development and cause issues with learning. The student learned about the dangers of marijuana abuse and how it is commonly used by teenagers.
This documents is a Caribbean History School Based Assessment that covers the topic: Is it fair to say that the Chinese and Indian immigrants solved the labour problem after 1838?
This document is Rollando Williams' English SBA on healthy lifestyles in Jamaica. It includes an acknowledgment, plan of investigation, three reflections on artifacts chosen, and plans for an oral presentation and group report. The artifacts are a song about healthy living, a poem titled "Health is Wealth", and a video on benefits of a healthy lifestyle. Through this SBA, Rollando aims to improve his English comprehension and research skills while learning about healthy living benefits.
This School Based Assessment was made to fulfill Samantha's Social Studies Course for the Caribbean Secondary Education Certificate. Please do not plagiarize this document in any way. This is solely for the purpose of helping others to improve their grades as a Caribbean student.
The Attorney General is the chief legal adviser to the government and is responsible for instituting legal proceedings on behalf of the government. Judges preside over trials in an impartial manner, determine facts and apply the law. They may also impose sentences in criminal cases. The Registrar administers the court and handles administrative duties such as maintaining records and corresponding on behalf of the court.
Entrepreneurship unit 2 IA Dejon HarrisDejon Harris
I did extremely well on this IA and I wanted to share it with other students who might have difficulty in completing i. I hope it will be helpful to someone who's doing unit 2
ALSO, CAN YOU GUYS SUBSCRIBE TO MY YOUTUBE CHANNEL
https://www.youtube.com/channel/UCAnTpjKrAWT_RspyeCYiXIQ?view_as=subscriber
The document summarizes a geography student's research project on factors affecting banana production in Richmond, St. Vincent. The student conducted a questionnaire with 20 banana farmers to investigate factors like diseases, finances, and government assistance. Key findings include: most farmers were over 27 years old with primary education; the most cited disease was Black Sigatoka but some farmers lacked knowledge of disease dangers; many farmers lacked sufficient finances but felt government assistance for disease control was limited; suggested solutions included more effective disease control, extension officers, transportation assistance, and credit/attention for farmers.
This document provides information about a student project investigating how engagement in extracurricular activities affects academic performance. It includes the project title, purpose, data collection methods, presentation of collected data through tables and graphs, analysis using measures of central tendency, probability, chi-square test, and correlation. The analysis found a low negative correlation between time spent on extracurricular activities and academic performance. The document concludes there is a slight decrease in grades as time on extracurricular activities increases.
CXC Caribbean History School Base Assignment on haitian revolution.
THEME: RESISTANCE AND REVOLTS
TOPIC: What effect did the Haitian Revolution (1791-1804) have on Haiti and the rest of the Caribbean?
The document is a school-based assessment completed by a student named Candacy Mentore for the Caribbean Secondary Certificate Examination. The assessment examines the causes and effects of marriage failure in the village of Paradise. It begins with an acknowledgement section and introduces the topic. The student then describes her methodology which included distributing a 20 question survey to residents and compiling the results. Key findings from analyzing the survey data included financial problems being a major cause of marriage failure in Paradise and love/affection being an important role for spouses. The student's recommendations to address marriage issues focus on counseling, communication skills, and understanding each partner's financial tendencies.
This document outlines a research project on the challenges faced by single parents in a community. It includes a problem statement, justification for selecting the topic, and an outline of the research methodology which will involve distributing questionnaires to single parents. The questionnaires will collect data on demographics, causes of single parenthood, financial and family support, challenges raising children alone, and effects on children. The responses will then be analyzed and presented in graphs, tables and a final report with findings and recommendations.
This document appears to be a student's household expenditure survey project. It includes an introduction to household expenditure surveys in Malaysia. It then presents data on the student's family's monthly income and how it is allocated across various categories. Additional data is presented on the monthly incomes and allocations of 5 of the student's friends. Charts and analyses of the data are provided. The project also looks at literacy rates in the 20 poorest and 20 richest countries in the world. The student concludes by reflecting on lessons learned from completing the project.
The document provides a statistical profile and cluster analysis of customers for Acme Company. It analyzes customers across various demographic variables like age, income, occupation, household type, and interests. Four key customer clusters are identified that differ in characteristics like income, education, and other attributes. The analysis aims to develop targeted marketing recommendations for Acme based on which customer segments are most likely to respond.
The document provides budget details for a charter school over 5 years, including projected enrollment, revenues, expenditures, and staffing plans. It includes student enrollment projections, revenue sources from state, federal, and local funds, and expenditure line items for instructional costs such as salaries, benefits, supplies, and textbooks. Staffing plans provide details on projected staff numbers and costs. Monthly and annual budget breakdowns are included for each of the 5 years.
The 2015 M4M Event saw impressive growth over previous years with a 22% increase in participation over 2014. A total of 588 participants took part in the 1 mile, 5k, 10k, and 10 mile races. The event raised $18,000 total with $14,000 donated locally and $4,000 donated globally. Partners and sponsors contributed $14,573 to help offset event costs. The event was deemed a success with good participation numbers, fundraising goals met, and positive feedback from participants. Planning will begin for the 2016 M4M Event to continue growing the event.
Catholic School Enrollment Strategies That WorkJim Friend
This document summarizes enrollment strategies that have helped increase Catholic school enrollment in the Diocese of Allentown, Pennsylvania. It describes how declining enrollment led to closing schools but new strategies including tuition grants, targeted marketing campaigns, and accountability measures have helped stabilize and grow enrollment in recent years. Data on enrollment trends at the diocesan, elementary, and high school levels from 1990-2014 demonstrate the impacts of these strategies. Recommendations are provided for continued enrollment management.
The document discusses the rising costs of both college and retirement and how the burden of paying for both is creating financial challenges for many families. It provides strategies for families to better plan and pay for both college and retirement by focusing on reducing taxes, leveraging home equity, and hedging retirement funds against market and tax risks to help free up money that can be used for college costs. The case study examines one family's original college funding plan and provides an analysis of projected costs and cash flows to identify ways to improve their financial position.
This document contains a student's homework on life cycle financial planning. It includes responses to questions on topics like calculating future property values, inflation rates, earnings on savings, time value of money, and financial planning cases. The student provides detailed calculations and references tables to support their answers. They also outline short-term and long-term personal financial goals with steps to achieve them.
Solution manual for essentials of business analytics 1st editorvados ji
Full download link :
https://getbooksolutions.com/download/solution-manual-for-essentials-of-business-analytics-1st-edition/
Detail about Essentials of Business : (Click link bellow to view example )
https://getbooksolutions.com/wp-content/uploads/2016/11/Solution-Manual-for-Essentials-of-Business-Analytics-1st-editor.pdf
Table of Contents
Chapter 1. What Is Business Analytics?
Chapter 2. Descriptive Statistics.
Chapter 3. Data Visualization.
4. Linear Regression.
5. Time Series Analysis and Forecasting.
6. Data Mining.
7. Spreadsheet Models.
8. Linear Optimization Models.
9. Integer Linear Optimization.
10. Nonlinear Optimization Models.
11. Monte Carlo Simulation.
12. Decision Analysis.
Dr. Emmanuel Orkoh_2023 AGRODEP Annual Conference - Parallel Session IIIaAKADEMIYA2063
This document summarizes a study on the impact of Namibia's COVID-19 Emergency Income Grant on household food security. The study used a survey of 250 households to collect data. Key findings include:
1) The income grant benefited 39% of households, with higher receipt among female-headed and less educated households.
2) Propensity score matching estimates found the grant significantly improved household food security, as measured by two indices.
3) Effects were larger for female-headed households, suggesting the grant particularly helped vulnerable groups.
4) Over half of households reported being satisfied with the income grant policy. Satisfaction levels were similar across demographic groups.
In 3 sentences, this summary
The document discusses the dance industry in Almaty, Kazakhstan. It outlines market analysis showing growth in potential customers from 2012-2016. It also provides financial projections for opening a dance studio called AlmaDance, including revenue from services, expenses on labor, facilities, marketing and initial investments. The projections estimate total revenue growing from $415,500 in year 1 to $792,250 in year 3, with net income rising from $568,845 to $881,125 over the same period. The studio aims to promote dancing as a lifestyle through diverse dance styles and social activities.
The document outlines a marketing plan for Minute Maid Pulpy Orange Juice. The plan aims to increase market share by 3% and consumer awareness of the new pulpy product from 65% to 75% through TV, print magazine, internet and outdoor advertising. The target audience is families with young children who enjoy time together. The TV advertising strategy focuses on morning and daytime shows to reach parents. Magazine placements will be in publications targeting families and active lifestyles. The total budget allocated for TV advertising is $20,993,110 and $6,986,488 for magazines.
Litchfield, NH School District Deliberative Session 2014Derek Barka
This document provides information for the Litchfield School District's 2015 budget deliberative session. It includes the proposed operating budget totaling $20,931,024.57, which is a 0.3% decrease from the previous year. It also includes estimated tax impacts and breakdowns of revenues and expenditures. Two warrant articles are discussed - the first for approval of the operating budget and the second for approval of a collective bargaining agreement that would increase salaries over the next three years. Concerns around maintaining competitive salaries and reducing health insurance costs are addressed.
National CFA Charterholder Compensation Survey 2015Ryan Renicker CFA
Some insights into the value of successfully completing (and retaining) the CFA Charter.
Source: CFA Societies Canada - 11 August 2015
https://www.cfasociety.org/saskatchewan/JobLine1/CFA%20Charterholder%20Compensation%20Survey%20-%20Summary%20-%20FINAL%20v2.pdf
Data interpretation is an act of analysing data with the objective to gain useful information from it. It
is done to draw conclusions from the given data. Different statistical tools are used to represent the
data in organized structures.
This document provides an overview of key concepts in statistics and probability covered in Chapter 4, including:
- Definitions of mean, median, and mode and how to calculate each from a data set.
- How to calculate probability, including the probability of independent and dependent events.
- Examples of how to determine the probability of outcomes based on given percentages.
- An overview of concepts like sampling, graphs, counting principles, and relationships between data.
This document provides an overview of key concepts in statistics and probability covered in Chapter 4, including:
- Methods for obtaining unbiased samples and representing data in line, bar, and circle graphs.
- Calculating the mean, median, and mode of data sets and understanding their relationships.
- Applying counting principles and calculating probabilities, including for independent vs. dependent events.
- Worked examples are provided to demonstrate computing probabilities and interpreting data distributions and relationships.
This document provides an overview of key concepts in statistics and probability covered in Chapter 4, including:
- Types of graphs like line graphs, bar graphs, and circle graphs for representing data
- Measures of central tendency like the mean, median, and mode
- Calculating probabilities using formulas and the counting principle
- Examples demonstrate computing probabilities for events and selecting random samples from populations.
This document provides an overview of key concepts in statistics and probability covered in Chapter 4, including:
- Methods for obtaining unbiased samples and interpreting line, bar, and circle graphs
- Calculating the mean, median, and mode of data sets and understanding their relationships
- Applying concepts like the counting principle and probability to solve problems
- Worked examples are provided to demonstrate computing probabilities and applying statistical concepts to real-world scenarios.
The analysis of the data has been done using excel statistical sof.docxmattinsonjanel
The analysis of the data has been done using excel statistical software. First, the demand and popularity of each product has been analyzed using pie charts. The extracts from excel shows the distributions of the three product lines across age, sex and education. The three types of bicycles have analyzed in terms of the number of customers using them, sex, and education levels.
The low product line has the highest demand as 80 customers selected, followed by middle product line with 61 customers and finally upper product line. The following extracts shows the demand of the three bicycles on the basis of number of customers, sex, and education.
Analyzing the popularity and demand for three bicycles using sex showed that males have a higher proportion of using bicycles than females. This is show in the following extract and chart.
Also, the level of education determines the use of bicycles. The demand for bicycles varies across the different levels of education. The analysis revealed that non-college high school diploma do not use bicycles. The following pie chart shows the proportion of each education level with respect to the use of bicycles.
Education
Number of Customers
Percentage
Non-High School Diploma
0
0%
High School Diploma
2
1%
Some-College -level work
67
37%
College Degree
97
54%
Graduate Degree at work
14
8%
However, the use of the three products line varied greatly with the age of customers. The following frequency distribution table shows the age group of customers and the frequency of using the three products line.
Bin
Frequency
Cumulative %
Bin
Frequency
Cumulative %
20
10
5.56%
25
62
34.44%
25
62
40.00%
30
45
59.44%
30
45
65.00%
35
32
77.22%
35
32
82.78%
40
16
86.11%
40
16
91.67%
20
10
91.67%
45
8
96.11%
45
8
96.11%
50
7
100.00%
50
7
100.00%
More
0
100.00%
More
0
100.00%
As it can be seen from the histogram, the distribution of age of customers and the frequency on uses of bikes is negatively skewed. That is, at early ages, customers use bicycles more than old ages. At age group 20-25, the demand of bicycles is high and it decreases as age increases. The mean age, median age, mode of an average customer is showed in the following table. The table also shows the average income that most customers receive,
Mean Age
28.98889
Mode Age
25
Median Age
27
Average Income
35672.22
Median Income
34000
More analysis have been done on individual products lines in order to determine the mean age of a customer at a given product line; average salary, average miles/ week, average times/ week among other analysis. The following discussion focuses on each of the three product lines.
a) Lower Product Line.
The following analysis shows the profile of an average customer who chooses to by Low Product Line.
Mean Age
28.6
Sex
Males
55%
Females
45%
Status
Single:
36%
Married.
64%
Mean Salary
30700
Average Miles
88
Average Time/week
3.01 ...
Similar to Additional Mathematics Project 2015 (20)
Temple of Asclepius in Thrace. Excavation resultsKrassimira Luka
The temple and the sanctuary around were dedicated to Asklepios Zmidrenus. This name has been known since 1875 when an inscription dedicated to him was discovered in Rome. The inscription is dated in 227 AD and was left by soldiers originating from the city of Philippopolis (modern Plovdiv).
This presentation was provided by Rebecca Benner, Ph.D., of the American Society of Anesthesiologists, for the second session of NISO's 2024 Training Series "DEIA in the Scholarly Landscape." Session Two: 'Expanding Pathways to Publishing Careers,' was held June 13, 2024.
This presentation was provided by Racquel Jemison, Ph.D., Christina MacLaughlin, Ph.D., and Paulomi Majumder. Ph.D., all of the American Chemical Society, for the second session of NISO's 2024 Training Series "DEIA in the Scholarly Landscape." Session Two: 'Expanding Pathways to Publishing Careers,' was held June 13, 2024.
Elevate Your Nonprofit's Online Presence_ A Guide to Effective SEO Strategies...TechSoup
Whether you're new to SEO or looking to refine your existing strategies, this webinar will provide you with actionable insights and practical tips to elevate your nonprofit's online presence.
Andreas Schleicher presents PISA 2022 Volume III - Creative Thinking - 18 Jun...EduSkills OECD
Andreas Schleicher, Director of Education and Skills at the OECD presents at the launch of PISA 2022 Volume III - Creative Minds, Creative Schools on 18 June 2024.
A Visual Guide to 1 Samuel | A Tale of Two HeartsSteve Thomason
These slides walk through the story of 1 Samuel. Samuel is the last judge of Israel. The people reject God and want a king. Saul is anointed as the first king, but he is not a good king. David, the shepherd boy is anointed and Saul is envious of him. David shows honor while Saul continues to self destruct.
2. 2
No. Content Page Remark
1 Introduction
2 Part A:
FamilyMonthly
Income andIts
Allocation
I Statistical Graphs
II Mean and StandardDeviation
III Comments
3 Part B:
Family Monthly
Income andIts
Allocationof 5
Friends
I Data and Tables
II ComparisonandComments
III a) Line graph and Bar graph representing
educationandrecreationcategories
b) Comments
IV a) Mean andStandard Deviation
b) Comments
4 Part C:
MonthlyIncome
Weightage inSix
Families
I The Weightage inPie chart,Bar chart and Ratio
Form
II The Change of Allocationof MonthlyIncome
5 Further
Explorations
I 20 RichestandPoorestCountriesinthe World
and theirLiteral Level
II Conclusion
6 Reflection
3. 3
INTRODUCTION :
The Household Expenditure Survey (HES) was first conducted in the year of 1957/58. Beginning
1993/94 it was carried out at an interval of five years and the recent survey was undertaken in 2009/10.
The survey covered private households in urban and rural areas.
The main objective of HES was to collect information on the level and pattern of consumption
expenditure by households on a comprehensive range of goods and services. This information served
as the basis for determining the goods and services to be included in the basket of the Consumer Price
Index (CPI). It was also used to represent the expenditure pattern of households in Malaysia.
However,over the years, demand for data from the survey has increased and it is now used for several
purposes. HES has become an invaluable source of information for government and private sectors,
researchers and university students.
4. 4
PART A:
Family monthly income and its
monthly allocation
Monthly Income (RM) Number of
family
members
Categories Allocation of
income (RM)
Allocation of
income (%)
10,000 5
Food 3500 35
Utility 1500 15
Transportation 500 5
Education 1000 10
Recreation 1000 10
Others 2500 25
Total 10,000 100
Presentation of my family’s monthly income
through different statistical graphs.
0
5
10
15
20
25
30
35
40
Line graph (%)
Allocation of Income (%)
6. 6
The mean and standard deviation of allocation of income:
Method 1
Calculator :
Mean =
Allocation of
Income
Number of
Categories
= 3500 + 1500 + 500 + 1000 + 1000 + 2500
6
= 10,000
6
= 1666.67
Standard deviation:
x x² Standard Deviation
3500 12,250,000 √Σx² - X²
1500 2,250,000 N
500 250,000 = √23,000,000 - (1666.67)²
1000 1,000,000 6
1000 1,000,000 = √1055544.44
2500 6,250,000
Σx = 10,000 Σx² = 23,000,000 1027.40
7. 7
Method2 :
Excel
Mean :
As showninthe image above,the meanis RM1666.67
Standard deviation :
As showinthe image above,the standarddeviationis RM1027.40
8. 8
Comments:
My family mostly use our monthly income on food as there are a lot of people
to feed. We cook a lot of big meals that require a lot of ingredients, which can
be quite costly. Though, my family used the least money on transportation
because petrol costs have not been really high lately, compared to every other
item’s cost.
9. 9
PART B:
5 different family monthly allocations from 5
friends.
Friend 1:
Monthly Income (RM) Number of
family
members
Categories Allocation of
income (RM)
Allocation of
income (%)
10,000 5
Food 3000 30
Utility 1000 10
Transportation 2000 20
Education 2000 20
Recreation 1000 10
Others 1000 10
Total 10,000 100
Friend 2 :
Monthly Income (RM) Number of
family
members
Categories Allocation of
income (RM)
Allocation of
income (%)
10,000 5
Food 3000 30
Utility 1500 15
Transportation 1500 15
Education 1000 10
Recreation 500 5
Others 2500 25
Total 10,000 100
Friend 3 :
Monthly Income (RM) Number of
family
members
Categories Allocation of
income (RM)
Allocation of
income (%)
10,000 6
Food 3500 35
10. 10
Utility 1000 10
Transportation 500 5
Education 1500 15
Recreation 1500 15
Others 2000 20
Total 10,000 100
Friend 4 :
Monthly Income (RM) Number of
family
members
Categories Allocation of
income (RM)
Allocation of
income (%)
10,000 3
Food 1500 15
Utility 1500 15
Transportation 2000 20
Education 2000 20
Recreation 500 5
Others 2000 20
Total 10,000 100
Friend 5 :
Monthly Income (RM) Number of
family
members
Categories Allocation of
income (RM)
Allocation of
income (%)
10,000 5
Food 3000 30
Utility 1000 10
Transportation 500 5
Education 1500 15
Recreation 1000 10
Others 3000 30
Total 10,000 100
Comparison about my findings:
Family Monthly
Income
Number
of Family
Members
Categories Allocation
of
Monthly
IncomeFood Utility Trans-
portation
Education Recreation Others
Friend1 10,000 5 3000 1000 2000 2000 1000 1000 10,000
11. 11
Friend2 5 3000 1500 1500 1000 500 2500
Friend3 6 3500 1000 500 1500 1500 2000
Friend4 3 1500 1500 2000 2000 500 2500
Friend5 5 3000 1000 1500 1500 1000 3000
Comments:
Majorityof the familieshasmostlyuseduptheirmonthlyincome onfood,usuallyforbigger
families- thereforemore mouthstofeed. The leastmonthlyincomeusedgenerallyforall families
are recreational activitiesbecause the familiesare busywithworkorschool.
Graphs presenting data of education and recreation
categories for all six families.
Line graph:
0
5
10
15
20
25
30
35
Family 1 Family 2 Family 3 Family 4 Family 5 Family 6
Recreation
Education
12. 12
Bar chart:
Comments:
Most of the familieshave spenttheirmonthlyincome more towardseducationratherthan
recreationbecause the parentsof the familiesneedtopayfor tutoringclassesforthe children.
Therefore,the familiescan’tspendmuchonrecreationaseveryone isbusywitheithertutoring
classesor earningmoneyforthe tutoringclasses.
The mean and standard deviation for education and recreation categories:
0
5
10
15
20
25
30
35
Family 1 Family 2 Family 3 Family 4 Family 5 Family 6
Recreation
Education
13. 13
Education:
Method1:
Calculator
Mean = Total Education
Number of
Families
= 20 + 10 + 15 + 20 + 15 +10
6
= 90
6
= 15
StandardDeviation
x x² Standard Deviation
20 400 √Σx² - X²
10 100 N
15 225 = √1450 - (15)²
20 400 6
15 225 = √16.67
10 100
Σx = 90 Σx² = 1450 4.08
Method2 :
Excel
Mean :
14. 14
As showinthe image above,the meanis RM15.
StandardDeviation:
As showinthe image above,the standarddeviationis RM4.08.
16. 16
As showinthe image above,the meanis RM 9.16.
StandardDeviation
As showinthe image above,the standarddeviationis RM3.44.
Comments
The mean of the education category is higher than the mean of the recreation
category. Alongsidethat, the standard deviation of the education category is
also higher than the standard deviation of the recreation category.
PART C:
17. 17
Monthly Income: Weightage in Degrees for
six families
Family Categories Allocation
of Monthly
Income
Food Utility Trans-
portation
Education Recreation Other
My
family
126 54 18 36 36 90
360
Friend1 109 36 72 72 36 36
Friend2 108 54 54 36 18 90
Friend3 126 36 18 54 54 72
Friend4 54 54 72 72 18 90
Friend5 108 36 18 54 36 108
Weightages of any two families in the form of:-
Pie chart:
Bar chart:
126
5418
36
36
90
My family
Food
Utility
Trans-
portation
Education
Recreation
Others
Friend 1
Food
Utility
Trans-
portation
Education
Recreation
Others
18. 18
Ratio form:
Family Categories
Food Utility Trans-
portation
Education Recreation Others
Friend4 15 15 20 20 5 25
Friend5 30 10 5 15 10 30
Ratio 1:2 3:2 4:1 4:3 1:2 5:6
The corresponding expected monthly income based on the information that
was given for me and five other friends:
Family Categories Allocationof
Monthly
Income
Food Utility Trans-
portation
Education Recreation Others
My family 3850 1575 500 1030 1020 2750 10725
Friend1 3300 1050 2000 2060 980 1100 10490
Friend2 3300 1575 1500 1030 490 2750 10645
Friend3 3850 1050 500 1545 1530 2200 10675
Friend4 1650 1575 2000 2060 490 2200 9975
Friend5 3300 1050 500 1545 980 3300 10675
0
20
40
60
80
100
120
Friend 2
Friend 3
19. 19
Further explorations:
The 20 richest and 20 poorest countries in the world and their
literate level
The richest:
Rank Country name Literacy level
1 Qatar 96.3%
2 Luxembourg 100%
3 Singapore 95.9%
4 Norway 100%
5 Brunei Darussalam 95.4%
6 Hong Kong 93.5%
7 United States 99%
8 United Arab Emirates 77.9%
9 Switzerland 99%
10 Australia 96%
11 Canada 99%
12 Austria 98%
13 Ireland 99%
14 Netherlands 99%
15 Sweden 99%
16 Iceland 99%
17 Taiwan 98.29%
18 Germany 99%
19 Kuwait 94%
20 Denmark 99%
The poorest:
Rank Country Name Literacy Level
1 Democratic Republic of the Congo 66.8%
2 Zimbabwe 90.7%
3 Burundi 67.2%
4 Liberia 60.8%
5 Eritrea 80%
6 Central African Republic 56.6%
7 Malawi 74.8%
8 Madagascar 64.5%
9 Afghanistan 28.1%
10 Mali 27.7%
20. 20
11 Togo 60.9%
12 Guinea 41%
13 Ethiopia 39%
14 Mozambique 56.1%
15 Guinea-Bissau 55.3%
16 Comoros 75.5%
17 South Sudan 27%
18 Nepal 66%
19 Haiti 52.9%
20 Uganda 66.8%
Conclusion:
I have concludedthatrich countriesare able toachieve highlevelof literacy,whileonlyratherfew
poor countriesare able toachieve stable literacylevel.
REFLECTION:
While doing this project, I realised that I still have a lot more to learn. Whether it’s
through the formulas used above, or the research that was required to gather
information- it was overall rather difficult but very interesting to do.
Additional Mathematics is very well known as a difficult subject in upper form of
Secondary School, but students should not simply give up because they cannot answer the
problems given in the subject. Instead, students should understand that Additional
Mathematics is one of the many ways to practice having high thinking skills. There’s
always a solution if they just try harder.