Improving Houston's State of Place: The Economic Case for Making Houston more Walkable

Dr. Alfonzo’s presentation will describe how State of Place, an urban data analytics platform helps both public and private entities understand how to make economic investments in walkability that will pay off in the marketplace. Walkability is increasingly tied to both emerging market preferences and business success. Some 80% of Millenials want to live in walkable places and in 2011 58% of venture capital in the Top 5 U.S. markets went to firms located in walkable areas. Yet walkability seems out of reach in many American cities – especially Houston. Two key barriers account for this difficulty. First, stakeholders often lack mechanisms by which to identify the most effective interventions or investments, especially in light of fiscal constraints. Second, and perhaps more pressing, stakeholders find it difficult to communicate and justify the benefits – especially economic benefits – of walkability. Dr. Alfonzo’s presentation will show how data-driven storytelling can pave the road for people-first urban design, even in face of auto-dominated landscapes like Houston.

Recommended
Recommended
More Related Content
Similar to Improving Houston's State of Place: The Economic Case for Making Houston more Walkable
Similar to Improving Houston's State of Place: The Economic Case for Making Houston more Walkable (20)
More from State of Place
More from State of Place (10)
Recently uploaded
Recently uploaded (20)
Improving Houston's State of Place: The Economic Case for Making Houston more Walkable
- 1. I have a confession to make. I was asked to come here today because people have come to think of me as the methods girl, a data geek, a methodholic. But actually, I'm a placeoholic Methods, data, definition, rationalism, are just my drugs of choice I use to feed my place addiction I very much embrace the notion that If you cannot measure it, it doesn't exist but not for the sake of measurement itself' but for the sake of changing it for the sake of convincing other people to change it for the sake of communicating the value of urban design But I didn't start out this way. Improving Houston’s The Economic Case for Making Houston more Walkable TM Mariela Alfonzo, Ph.D. Founder, State of Place TM Research Assistant Professor, NYU Rice Kinder Institute April 13th, 2015
- 2. This is my hometown - westchester meeyame Where my most exhilarating memory is playing an ersatz game of frogger as i tightroped down pencil thin sidewalks dogging cars as I crossed strip-mall lined highways masquerading as streets all to get to a chicken teriyaki sub. Growing up in Miami - especially as a carless teenager sucked.
- 11. So in the end, we identified 241 items and after reliability testing, 162 ended up in the original IMI. It was GREAT! We had done it. We had measured urban design! BUT We had built a tool for measurements sake. I’ve since fielded dozens of calls from researchers and practitioners asking us how to use this thing – and as the grad student on the project, I was really the only one who knew what to do with it! IRVINE MINNESOTA INVENTORY Date 1 2 3 4 5 6 7 Time Observer Segment # Answer questions 1-6 based on this end of the segment Intersection Neighborhood Identification 1. Are there monuments or markers including neighborhood entry signs that indicate that one is entering a special district or area? 1 yes = 1; no = 0 Street Crossing 2a. Consider the places on the segment that are intended for pedestrians to cross the street. Are these places marked for pedestrian crossing? Mark N/A if there are no intended places to cross. 2 all = 2; some = 1; none = 0; NA = 8 2b. What type of marking do the crosswalks have? Mark all that apply. Mark N/A if 2a= 0 or 8 White painted lines 3 yes = 1; no = 0; NA = 8 Colored painted lines 4 yes = 1; no = 0; NA = 8 Zebra striping 5 yes = 1; no = 0; NA = 8 Different road surface or paving (e.g. tiles, colored concrete, marble, etc) 6 yes = 1; no = 0; NA = 8 Other 7 yes = 1; no = 0; NA = 8 3. Are there curb cuts at all places where crossing is expected to occur? Mark N/A if there are no intended places to cross. 8 all = 2; some = 1; none = 0; NA = 8 4. What type of traffic/pedestrian signal(s)/system(s) is/are provided? Mark all that apply. Traffic signal 9 yes = 1; no = 0 Stop sign 10 yes = 1; no = 0 Yield sign 11 yes = 1; no = 0 Pedestrian activated signal 12 yes = 1; no = 0 Pedestrian crossing sign 13 yes = 1; no = 0 Pedestrian overpass/underpass/bridge 14 yes = 1; no = 0 5. For an individual who is on this segment, how safe (traffic wise) do you think it is to cross the street from this segment? 15 pretty/very safe = 1; not very safe/ unsafe = 0; cul de sac = 8 6. For an individual who is on this segment, how convenient (traffic wise) do you think it is to cross the street from this segment? 16 pretty/very convenient =1; not very/inconvenient= 0; cul de sac = 8 Answer questions 7-11 while standing at the beginning of the segment Neighborhood Identification 7. Does the segment have banners that identify the neighborhood? 17 some/a lot = 2; few = 1; none = 0 Street Characteristics 8a. Is this a pedestrianized street? 18 yes = 1; no = 0 8b. Is the street a … 19 one way = 1; two way = 2 9. Is this segment an alley? 20 yes = 1; no = 0 10. How many vehicle lanes are there for cars? (Include turning lanes). 21 six or more = 6; five = 5; four = 4; three = 3; two = 2; one = 1; NA (no lanes for car travel) = 8 Views 11a. Is this segment characterized by having a significant open view of an object or scene that is not on the segment? The view must be a prominent one. 22 yes = 1; no = 0 11b. How attractive is the open view? 23 attractive = 3; neutral = 2; unattractive = 1; NA (no views) = 8 Begin walking along segment to answer questions 12-68 12a. What types of land uses are present on this area? Mark all that apply. Residential Single family home - detached 24 yes = 1; no = 0 Single family home/duplex - attached (2 units or fewer) 25 yes = 1; no = 0 Town home/condo/apartment housing (3 units or more) 26 yes = 1; no = 0 Mobile homes (includes manufactured homes) 27 yes = 1; no = 0 Residential, other 28 yes = 1; no = 0
- 12. But even before the ink was dry on the IMI, I met a group of “urban brokers” – renegades – from Houston that wanted to tell the story of place, or lack of thereof in their case. They planned to rank several neighborhoods in Houston based on their sense of place. As the purported methods girl, I asked them how they planned to do that. They had no clue – they were planning to have a group of “experts” subjectively judge these places. Enter light bulb moment – so hey, I have this tool… I was forced to come up with a quick and dirty methodology – the very first version of my State of Place algorithm (which I’ll get to later) – to use the IMI to tell a story about neighborhoods' Sense of Place! We gave each of the 12 neighborhoods grades and everything. In 2005! Now I really thought I had my eureka moment…we thought this would incite these neighborhoods to think about Place, to compete on the basis on Place. But again, this was 10 years ago. Even if we had begun to define the nuts and bolts of great places It couldn’t just be about health. It couldn’t just be about sense of place. I STILL had to show them the money if I wanted them to consider place in the equation. I realized I had to learn a whole new language – and method. The language of real estate economics and finance. I audited a real estate development class, jumped feet first into an intense relationship with the Urban Land Institute, got countless headaches from trying to figure out all of the jargon and oh my God, the acronyms. If you think we urban planners and designers have acronyms. Wow.
- 13. Rockport (shoe company) advertisement
- 14. 80% OF 18-34 SURVEYED WANT TO LIVE IN WALKABLE NEIGHBORHOODS YEAR OLDS 40% W I T H I N OF DAILY GOODS & SERVICES1 WANT TO LIVE > 50 YRS OLD MI 5 INVESTMENT M A R K E T S 58% IN TOP VC OF CAPITAL W E N T T OCE NTE R CI TY O R WALKABLE SUBURBS
- 15. 172% Retail Sales 3 YearsDumbo Brooklyn, NY
- 21. Property values within walking distance of public transit stations are 40% higher than other properties in the same region.
- 22. Residential values in walkable neighborhoods experienced less than half the average decline in value from the housing peak in the mid 2000s
- 23. Residential values more stable in walkable neighborhoods Have experienced less than half the average decline in value from the housing peak A 10pt increase in Walk Score linked to 5-8% increase in commercial values A 1pt increase in Walk Score linked to $700-$3000 for-sale residential premiums Avg. operating cost /yr., Bike: $308 Avg. operating cost/yr. Car: $8,220 Urban mixed-use developments generate 25-59x revenue/acre than suburban counterparts 1% rise in urban sprawl index increases obesity risk by 0.5% In 2008, medical $$ to treat obesity in US, approx. $147B
- 24. Municipal Property Tax Yield (per acre) in Raleigh, NC, 2011 $2,078 $2,837 $22,175 $26,098 $30,057 $110,461 Walmart Single-family residential Crabtree Valley Mall 3-4 story Residential 3 story Office 6 story Mixed-use Outside central business district Within central business district Silver, M. (2012). Presentation for the City of Raleigh.
- 25. Mixed Use Development vs. Sprawl
- 26. 141 AVERAGE WALKSCORE OF US CITIESWITH POPULATIONS OVER 200K
- 28. When you aggregate what that means in terms of going from the lowest to the highest level of State of Place, the numbers are quite startling.FISCAL CONSTRAINTS SETTING PRIORITIES BUY-IN POLITICAL WILL COMMUNITY SUPPORT MEASURING IMPACT FROM HERE TO THERE
- 29. And then came Brookings! I finally had the opportunity to truly tie built environment features not just to walking, health, sense of place and community, but to economic value. We gathered IMI and real estate data from over 60 neighborhoods in the Washington DC Metro area that were sampled from over 240 neighborhoods along a continuum of walkability, from the auto-dominated exurbs to the highly walkable core. A meta-analyses examining the results of dozens of studies evaluating the relationship between the built environment and walking guided the development of the first official State of Place algorithm – finally! I created a comprehensive index, ranging from 0 to 100, to make sense out of the 162 data points we were gathering with the IMI. I’ll go into that more in just a little bit, but first the real Eureka moment:
- 30. Very Low State of Place™ Index Tied to Economic Value 0 - 20 Low Moderate Good Very Good21 - 40 41 - 60 61 - 80 81 - 100 *PREMIUMS FOR EACH LEVEL INCREASE + $9 SF OFFICE RENTS + $7 SF RETAIL RENTS +80% RETAIL REVENUES + $300 UNIT RES. RENT +$81 SF FOR-SALE RES. VALUE
- 31. When you aggregate what that means in terms of going from the lowest to the highest level of State of Place, the numbers are quite startling. + $37 sq. ft. Office Rents + $30 sq. ft. Retail Rents +340% Retail Revenues + $1281/Unit Residential Rent +$347 sq. ft. For-sale Residential State of Place™ Index: 90, Very Good State of Place™ Index: 5, Very Low
- 32. And all in all, these premiums have serious implications for economic development in terms of retail and property tax bases WASHINGTON, DC
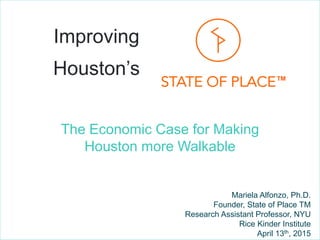
- 33. Existing: $14.59 Avg. Retail Rent/sq. ft. $17.17 Avg. Office Rent/ sq. ft. Potential: $30.18 Retail Rents $31.81 Office Rents HOUSTON
- 34. HOUSTON Existing: $124B Total Retail Sales 8.25% Houston Tax Rate $10.2B Tax Revenues Potential (Two level increase): $282B Total Retail Sales $23.3B Tax Revenues
- 35. TM
- 37. TRAINING VIDEO + INTERACTIVE QUIZ TRAINED COMMUNITY MEMBERS OR STAFF COLLECT DATA MINUTES/B L O C K 10-15 STATE OF PLACE APP SEAMLESSLY TRANSFERS DATA TO SERVERS
- 38. 0% 20% 40% 60% 80% 100% DENSITY FORM CONNECTIVIT Y PROXIMITY PARKS & PUBLIC SPACES RECREATIONAL FACILITIES PEDESTRIAN & BIKE AMENITIES TRAFFIC SAFETY AESTHETICS PERSONAL SAFETY URBAN FABRIC DESTINATIONS HUMAN NEEDS & COMFORT LIVELINESS & UPKEEP STATE OF PLACE™ INDEX & PROFILE
- 39. For Density, we are measuring building compactness and height, not so much population density – this is particularly important in terms of making it feasible to have enough destinations to walk to within a reasonable walking distance. It can also influence the scale of city – is it for cars or people? DENSITY Compactness & Height
- 40. Related to that is Urban Form. Here we are measuring streetscape continuity, so we take into account building setbacks, how the building meets the street, the siting of buildings, and the number and width of buildings. This is what I like to call the hugability of a street. If the form is off, a street can feel aloof or it can feel suffocating. You know you’ve achieved the right proportions of setbacks, street width, and building height when it feels like the street is hugging you. FORM Streetscape Continuity
- 42. Proximity refers to the diversity of the land use mix – the number of non-residential land uses there are to walk to. So literally, how many of your daily needs, services, and amenities are present within a certain distance of you PROXIMITY Land Use Mix Photo Credit Nakeva Corothers
- 43. With parks and public spaces, we include the presence hard and soft scape public spaces, as well as their quality and accessibility. These are often the soul and life of neighborhoods, they are the city’s living rooms. Along with museums and monuments, these are the places you bring your friends and families to when they come visit. I can tell a lot about a city based on how people use their public spaces. PARKS & PUBLIC SPACES
- 44. We also look at recreational facilities – separately. This is getting a bit more at recreational walking, but the literature found this to be an important determinant for physical activity, so we measure the presence of outdoor and indoor physical activity facilities. RECREATIONAL FACILITIES Photo Credit Bill Cotter
- 45. Pedestrian and bike amenities refer to aspects of the built environment that make it comfortable or pleasant to be a pedestrian, so sidewalk presence and quality, seating, bike lane presence and type, street trees, etc. Along with form, these are the features that truly help distinguish car-focused neighborhoods from people-first places – they are the things that make you want to linger… PEDESTRIA N & BIKE
- 46. Along with that, we look at traffic safety. Here we are mainly focusing on the quality and safety of the intersection as well as the presence of traffic calming features. These include the presence of curbcuts, crosswalk markings, traffic standards, and on-street parking. These are the features that help manage all of the mobile members of the public realm – people, strollers, bicyclists, scooters, cars, and buses. TRAFFIC SAFETY
- 47. Aesthetics goes beyond the visually pleasing; it also includes aspects of urban design that make places more dynamic and inviting. We look at the transparency of buildings, colors, outdoor dining, street trees, building maintenance, ground floor uses, etc. This is charm, character, the wow factor – the things you’ll most remember about places. AESTHETIC S Liveliness & maintenance
- 48. Finally, personal safety refers not to actual crime data but rather the aspects of the built environment that influence our perception of safety – these are called physical incivilities and include features like graffiti, litter, broken windows, abandoned buildings and lighting. These features actually influence walking rates more than the rates of crime incidents. PERSONAL SAFETY
- 49. Identify Priorities State of Place Index State of Place Profiles Scenario Analysis Run Analytics
- 50. Platform conducts “multi-criterion assessment” to identify top priorities. Example, Walkability as a Goal: Dimension Performanc e Ranking for Goal (Walkability) Impact* Feasibilit y Communit y Score Density 76.5 9 .432 1 4.3 91.4 Form 65.4 9 .543 1 7.1 169.1 Connectivity 55.8 9 .342 1 6.3 136.0 Proximity 74.3 9 .765 2 9.5 353.9 Parks & Public Spaces 23.5 9 .634 2 7.4 873.0 Recreational Facilities 13.4 9 .548 2 5.7 854.2 Pedestrian Amenities 55.4 9 .813 3 8.6 979.0 Traffic Safety 43.1 9 .745 3 8.8 1144.5 Aesthetics 58.4 9 .436 4 7.5 962.3 Personal Safety 71.3 9 .512 4 9.3 529.0 *Impact scores listed here are for explanatory purposes only; the actual impact scores are proprietary.
- 51. Identify Priorities State of Place Index State of Place Profiles Scenario Analysis Run Analytics
- 52. Compare Interventions See Recommendations Compare Projects
- 53. Choose Dimensions To Compare Density Form Connectivity Proximity Parks & Public Spaces Recreational Facilities Pedestrian & Bicyclist Amenities Traffic Safety Aesthetics Personal Safety ✓ ✓ ✓
- 54. Parks & Public Spaces $80,000 Pedestrian & Bicyclist Amenities Traffic Safety Add Park Add Plaza New PlazaPark Maintenance Arcades Benches Sidewalk Buffers Street Trees Sidewalk Buffers Crosswalks Curbcuts Midblock Crossing Pedestrian Countdown CurbCuts Enter Project Cost Enter Project Cost Select Interventions
- 55. Com. property tax For-sale residential Office rents Retail rents Residential rents Res. property taxes Vacancy Rates Retail Rents Enter Baseline Select Goal Calculate Predicted ROI
- 56. Parks & Public Spaces $80,000 Pedestrian & Bicyclist Amenities Traffic Safety $300,000 $150,000 $1.09/sf $0.89/sf Park Maintenance Sidewalk Buffers Curbcuts $1.43/sf Predicted ROI: Retail Rents +4.3% +3.1% +3.7% Impact on State of Place Index
- 57. Parks & Public Spaces $80,000 Pedestrian & Bicyclist Amenities Traffic Safety $300,000 $150,000 $1.09/sf $0.89/sf Park Maintenance Sidewalk Buffers Curbcuts $1.43/sf Predicted ROI: Retail Rents +4.3% +3.1% +3.7% Impact on State of Place Index $1.36/dollar $.03/dollar $.10/dollar Value for Money: 100k sqft $109k $89k $143k Total Value Captured: 100k sqft
- 58. Compare Interventions See Recommendations Compare Projects
- 59. Enter Project Cost Enter Project Cost Enter Project Information Neighborhood 1 $1,800,000 Neighborhood 1 Neighborhood 1 Project 1 Project 2 Project 3
- 60. Com. property tax For-sale residential Office rents Retail rents Residential rents Res. property taxes Vacancy Rates Retail Rents Enter Baseline Select Goal Calculate Predicted ROI
- 61. Neighborhood 1 $1,800,000 Neighborhood 1 Neighborhood 1 $2,700,000 $2,300,000 $1.43/sf $0.99/sf Project 1 Project 2 Project 3 $1.56/sf Predicted ROI: Retail Rents +6.0% +2.0% +11.0% Impact on State of Place Index Map It
- 62. We are doing this currently for one of our clients who is managing a $30M equity fund focusing on underserved neighborhoods in Boston. They are using State of Place to help identify which development projects will have the most impact on Place – and ultimately informing which ones they will fund. Predicted ROI Impact of Proposed Projects
- 64. TM mariela@stateofplace.org www.stateofplace.org For full demo: bit.ly/DemoSoP
Editor's Notes
- This is my hometown - westchester meeyame Where my most exhilarating memory is playing an ersatz game of frogger as i tightroped down pencil thin sidewalks dogging cars as I crossed strip-mall lined highways masquerading as streets all to get to a chicken teriyaki sub. Growing up in Miami - especially as a carless teenager sucked.
- This was life
- This was work
- This was play
- This was place But what miami lacked in place, I made up for in passion Ironically, I owe my intimate understanding of the power of place, or lack thereof, to Miami. I desperately wanted to fix Miami, to help create place I thought if you could only convince people, show them the power of place…its value…that things could change. Even then I was convinced better places did better, all around. I just needed to find a way to prove that to people. To prove the value of urban design, of walkability, of place.. Given my experience with place growing up, it’s no wonder I took to Houston the first time I came here 10 years ago…
- I mean, this is literally the first street I clicked on in Google Street view when I was looking for Houston images for this presentation…not too far off from the downtown Miami I once knew
- Large monolithic buildings with blank facades, seas of parking everywhere
- Wide streets with discontinuous streetscapes, sidewalks that are mere afterthoughts
- No-name strip malls, retail pod anchored intersections The desire for place was definitely something I had in common with the three “urban brokers” – renegades – from Houston that I met at a ULI retail conference ten years ago These three urban brokers wanted to tell the story of place, or lack of thereof in their case. They planned to rank several neighborhoods in Houston based on their sense of place. As the consummate academic, I asked them how they planned to do that. They had no clue – they were planning to have a group of “experts” subjectively judge these places. And as the budding entrepreneur and consultant, I said – so hey, I have this tool… I had been working on creating an objective audit tool to measure the built environment elements that made places walkable, that made them great. I came to Houston on a whirlwind week trip.
- I had to figure out a way to weave 6 pages of this – of the 162 data points that this audit tool collected - into a story about place – for 12 neighborhoods! In one week!
- Enter State of Place Round 1 I came up with a quick and dirty methodology – the very first version of my State of Place algorithm (which I’ll get to later) – to use the this tool tell a story about neighborhoods' Sense of Place! We gave each of the 12 neighborhoods grades and everything. In 2005! I was so excited! It wasn’t Miami, but I thought I was helping to push forward the case for place in another city that needed as much help, or more, than my own hometown. And these urban broker’s energy was infectious. We were all convinced that this story would incite these neighborhoods to think about Place, to compete on the basis on Place. But this was 2005. Even if we had begun to define the nuts and bolts of great places, of walkability, at the time it couldn’t just be about sense of place. But I was going to have to show them the money if I truly wanted developers and investors to consider place in the equation…
- Fast forward ten years later. Today walkability is such a known commodity that it’s even made its way onto a shoe ad! I cannot tell you how happy this makes me – when I first told my friends in Miami I was moving to Southern California to study walkability, they thought I was nuts! We’ve come a long way in the past 15 years. The health benefits of walkability are now well known – people walk more when it’s, well, easier to walk! And that has huge impacts on obesity rates and associated chronic diseases. The environmental benefits of reduced GHGs and air quality have also come to light in the recent years. People now talk about sustainability and resiliency in the same breath they talk about walkability. And recent studies have even extolled the happiness factor that walkability brings, not to mention sense of community and sense of place. But it’s really the economic story that has pushed walkability to the real estate limelight…
- Today, walkability is no longer a nice to have or a luxury, it’s key to economic competitiveness. Survey after survey now show that an increasing number of both Millennials and older adults want to live in lively, dynamic places where it’s safe, convenient, and pleasurable to walk to everyday destinations and amenities. Walkability now even has a role in the innovation and startup economy, with a large majority of Venture Capital money going to center cities or walkable suburbs. Even the CEO of Twitter talks about the appeal of an urban campus – and he’s not alone. Facebook, Google and other major tech players are increasingly locating in the walkable core of cities. I cannot tell you how many stories I hear about cities going the “walkability” route after losing bids to lure large firms to other cities in their regions that offered employees a better quality of life, specifically walkability – this was the case for Oklahoma City, where I just gave a talk about the power of place at their second biannual Placemaking conference. Again, walkability is no longer a nice to have, it’s a need to have.
- Over the past few years, New York City has made a concerted effort to focus on place and walkability – even though by all measures, they were already pretty walkable. But this dedication and focus has paid off. This is an example of a redevelopment of an under-used parking lot – you guys know those well, no? The City decided to convert it into a small pedestrian plaza – using very inexpensive materials, may I add. In a matter of three years, the businesses around the plaza had experienced an 172% increase in retail sales. But that’s the tip of the iceberg.
- In a study by the NYC DOT, they found that protected bike lanes not only had significant safety benefits, they also translated to dollars and cents – a 49% increase in retail sales compared to 3% borough wide.
- In Union Square, a small expansion of the turning radii – literally going from a curvilinear pattern to a 90 degree angle and giving that space over to pedestrians reduced commercial vacancies by 49% compared to 5% citywide! That’s just some concrete and planters.
- Again, with the parking. In Brooklyn, they converted yet another underused parking area – that translated into a 172% increase in retail sales. And even a more modest project – converting a curb lane into outdoor seating for pedestrians not only increased their volumes by more than ¾ but also increased sales at bordering businesses by 14%
- And finally, back to the bike lanes, in Manhattan, my neighborhood, dedicated bike lanes not only had positive benefits in terms of safety and traffic flow but also reduced commercial vacancies by 47% compared to 2% borough wide.
- But this isn’t just in NYC. In a study by Ceos for Cities of the 30 top metros, they found that an increase of 1 pt in Walkscore – a proxy for walkability that measures proximity to different commercial destinations ranging from 1-100 – translated into price premiums ranging from $700 to $3000 in terms of for sale residential values. In a different study out of Arizona State University, they found that an increase of 10pts in Walkscore was associated with an increase of 5-8% in commercial values
- Transit enters the equation as well – with property values within walking distance to a transit station had a 40% premium – now a lesson there – there cannot just be a transit stop, it has to be connected to destinations and amenities. Think about all of the empty lots near Houston’s light rail – they are ripe with opportunity…
- And walkability doesn’t just mean price premiums – it means resiliency too. Since the housing peak in the mid 2000s, residential values in walkable neighborhoods had less than half the decline in value.
- To that end, not only did values decline less in walkable neighborhoods during the recession, they have rebounded that much more since, as you can see here in an interactive tool by Moody’s and Real Capital Analytics, prices have risen more sharply in highly walkable CBDs, followed by walkable suburbs, with car dependent suburbs still struggling to get get back to peak prices
- But this isn’t just about individual price premiums. As I mentioned before, there are serious economic development implications of walkability for city’s bottom lines as well. A study for Raleigh, NC, concluded that a six-story building downtown produces 50 times as much property tax revenue per acre as an average Walmart store. Even a three-story residential building produces more property tax revenue per-acre than a major shopping mall.
- And in yet another study conducted by SGA in 2013, mixed-use downtown development was found to generate 10 times the tax revenue per acre, saves 38 percent on upfront infrastructure costs per unit, and saves 10 percent on ongoing delivery of services compared to sprawl. Walkability impacts budgets as well…
- But while the supply side is telling one story, the demand side does not match up. Despite the resounding evidence of the multiple benefits of walkability, it is still out of reach for most of the US. Again, based on walk score, the average walkscore of US cities with populations over 200k is only 47 out of 100, which walkscore defines as a car dependent city where most trips – even those to get milk – require the car. When I go back home to visit, it’s the starkest contrast. I’ve lived car free for nearly 8 years – and one of the things I most relish is that it takes me a total of 7 minutes roundtrip to walk to the store to get milk, and that includes walking up and down four flights of stairs! – something I particularly appreciate those mornings when I wake up and realize that I’ve run out of milk for my coffee! In Miami, I have to drive to starbucks and back – which takes me a whopping 25-30 minutes total, and that’s not due to the baristas messing up my order!
- The state of place in Houston mirrors that of the average US city. This is no doubt influencing Houston’s economic development potential. That is not to say that Houston doesn’t have a lot to offer – including more affordability – but it cannot afford to rest on its laurels in the near future. Young people are making decisions based on place – that State of Place study we did in 2005 might have been before its time. I am confident, however, that its time has more than come. The question is, how will you face this challenge? How do you go from the home of giant one-way streets and more parking lots than I can count to a dynamic, livable, walkable city?
- Houston is not alone in this challenge. There are many barriers keeping most US cities from going from here to there…from anywhere USA to powerful places. Cities grapple with fiscal contraints and setting priorities in the face of these Getting buy-in from the real estate community – even in the face of all the evidence of the value of walkability – is still a challenge. It’s been decades where business as usual did not include walkability Political will is still tricky – especially in terms of establishing the rationale for a decision There is still resistance from communities that equate walkability with traffic, density, and “the other” And even for those that have already bought into the concept of walkability, it’s still hard to measure the impact
- Well, these are the issues that I’ve been trying to address through my research and with State of Place. So after years of extolling the value of walkability, I finally had the opportunity to show them the money. Nearly three years ago, I co-authored a Brookings study with Chris Leinberger about the value of of urban design and walkability. We gathered built environment and real estate data from over 60 neighborhoods in the Washington DC Metro area that were sampled from over 240 neighborhoods along a continuum of walkability, from the auto-dominated exurbs to the highly walkable core. And I developed the first official State of Place algorithm! I created a comprehensive index, ranging from 0 to 100, to make sense out of the 162 data points we were gathering with the audit tool – the same one we had used in Houston.
- As the State of Place Index increased, so did a variety of other real estate values. Specifically, we divided the Index into five levels of walkability – or quality of place – and for each level increase, we saw premiums of nearly $9/sqft in office rents, $7/sqft in retail rents, an 80% increase in retail sales, a $300/unit increase in residential rents, and more than $81/sqft in for sale residential value.
- When you aggregate what that means in terms of going from the lowest to the highest level of State of Place, the numbers are quite startling.
- And all in all, these premiums have serious implications for economic development in terms of retail and property tax bases
- I took the liberty of applying these numbers to Houston. In terms of magnitude of impact, if it were to move up four levels, it really starts to weave a tale of why place matters. If this slide doesn’t create an objective narrative for the power of place, I’m not sure what else can.
- And when it comes to economic development potential, this shows the impact of just going up two levels in terms of State of Place/walkability.
- I think what was most exciting about the Brookings study for me was the immediate applicability of its findings not just to showcase the value of place – but to be able to weave a data-driven story to support not just the why – but the how. And for me, it was the perfect way to blend the consummate academic with the energetic entrepreneur in me. Today, state of place is an urban data analytics platform that allows placemakers – cities, developers, investors, planners and designers – to identify and economically justify the optimal design, planning, and development projects that create thriving places people love. I’m going to briefly guide you through how we are doing that.
- So in the last three years since the Brookings study, we got the opportunity to update the underlying audit tool when we applied it to the Chinese context. We refined many of the existing inventory items, deleted extraneous items, and added items mainly related to pedestrian and bicycle barriers and architectural and building quality. In the end, we ended up with 286 items, all collected at the block level.
- We collect this data on-site (or using Google street view). We use “people-power” to collect this data. All raters must go through a training process to ensure the integrity and reliability of the data, including a video training and quiz. It takes about 10-15 minutes per block, and the data is collected using our State of Place app, which significantly streamlines the process relative to our paper and pencil days! One of advantages is that virtually anyone can be trained to collect this data, including high school students and community members, allowing the opportunity to foster community engagement along with collecting quantitative data.
- As I mentioned previously, the State of Place Index itself is a score from o to 100 – you do not need to have every single item present to achieve a score of 100. Rather, 100 represents the highest observed score from our continuum of very low to very high walkable neighborhoods – it’s a realistic goal. The Index is broken down into ten urban design dimensions, all of which have been empirically linked to whether or not people walked, identified in the metaanalysis I mentioned earlier. Each of the individual sub dimensions is also scored from o to 100. The algorithm is structured in such a way as to capture urban design elements as part of a whole, so it’s not additive but interactional – it calculates if, then, what scenarios. Overall, this creates the State of Place profile, which provides a quick snapshot of how a neighborhood is doing from an urban design perspective – see, there, I said it again! One can identify its built environment assets and needs, starting to set priorities for how best to address the needs of a neighborhood – more on that later. It’s also broken up into four sets of urban design features –the Urban Fabric, or the nuts and bolts of the neighborhood, its bones; various types of Destinations to walk to; the level of Human Comfort for the pedestrian; and Liveliness and Upkeep. These are organized in terms of their level of resiliency, or how hard it would be to change them once they are in place. It’s much harder to fix and existing urban fabric than to add some sidewalks and trees.
- For Density, we are measuring building compactness and height, not so much population density – this is particularly important in terms of making it feasible to have enough destinations to walk to within a reasonable walking distance. It can also influence the scale of city – is it for cars or people?
- Related to that is Urban Form. Here we are measuring streetscape continuity, so we take into account building setbacks, how the building meets the street, the siting of buildings, and the number and width of buildings. This is what I like to call the hugability of a street. If the form is off, a street can feel aloof or it can feel suffocating. You know you’ve achieved the right proportions of setbacks, street width, and building height when it feels like the street is hugging you.
- In terms of Connectivity, we are measuring the relative ease of getting from one part of the neighborhood to another, as well as the presence of barriers to pedestrians or bicyclists within the block itself. I know you’ve all been there – if there wasn’t a fence, road, highway, insert barrier of choice between you and your neighborhood restaurant, you could totally walk there. But instead, what could be effectively a 5-minute walk becomes a 25-minute one, and you take the car instead.
- Proximity refers to the diversity of the land use mix – the number of non-residential land uses there are to walk to. So literally, how many of your daily needs, services, and amenities are present within a certain distance of you
- With parks and public spaces, we include the presence hard and soft scape public spaces, as well as their quality and accessibility. These are often the soul and life of neighborhoods, they are the city’s living rooms. Along with museums and monuments, these are the places you bring your friends and families to when they come visit. I can tell a lot about a city based on how people use their public spaces.
- We also look at recreational facilities – separately. This is getting a bit more at recreational walking, but the literature found this to be an important determinant for physical activity, so we measure the presence of outdoor and indoor physical activity facilities.
- Pedestrian and bike amenities refer to aspects of the built environment that make it comfortable or pleasant to be a pedestrian, so sidewalk presence and quality, seating, bike lane presence and type, street trees, etc. Along with form, these are the features that truly help distinguish car-focused neighborhoods from people-first places – they are the things that make you want to linger…
- Along with that, we look at traffic safety. Here we are mainly focusing on the quality and safety of the intersection as well as the presence of traffic calming features. These include the presence of curbcuts, crosswalk markings, traffic standards, and on-street parking. These are the features that help manage all of the mobile members of the public realm – people, strollers, bicyclists, scooters, cars, and buses.
- Aesthetics goes beyond the visually pleasing; it also includes aspects of urban design that make places more dynamic and inviting. We look at the transparency of buildings, colors, outdoor dining, street trees, building maintenance, ground floor uses, etc. This is charm, character, the wow factor – the things you’ll most remember about places.
- Finally, personal safety refers not to actual crime data but rather the aspects of the built environment that influence our perception of safety – these are called physical incivilities and include features like graffiti, litter, broken windows, abandoned buildings and lighting. These features actually influence walking rates more than the rates of crime incidents.
- So State of Place is an urban data analytics platform – we are currently taking steps to convert the analytics I’ve been conducting on the backend into a user-facing software. And by the way, we’re currently recruiting “strategic clients” that want to work with us to build this out with us. What we are doing with State of Place is: First, helping set priorities among the landscape of neighborhoods within a region – what level of investments or interventions are needed across the region and what kind of investment structure is called for – private, public-private, or non-profit/NGO
- Next, helping set priorities within a neighborhood itself – we use something called Multi-criterion assessment for that. Imagine if you had a certain budget for an airline ticket but you wanted to get the most bang for your buck, balancing your preferred airline, preferred airport, specific times, dates, non-stop vs layovers, duration of layovers, etc. If there was an app that weighed the importance of each of these factors and pointed to your ideal flight given your budget – that’s basically what we do for neighborhoods. We weigh five things 1) the performance of a neighborhood along each of the ten urban design dimensions (the index score); 2) how important certain outcomes are to you – like walkability, retail rents, office rents, etc. – at this moment, we incorporate goals for which we have data, what I outlined for you earlier in terms of the Brookings findings, but we are partnering with researchers to expand this list to include broader economic development factors like number of jobs, number of startups, etc.; 3) the predicted impact of improving a certain urban design dimension on each goal or outcome – this is based on regression analyses we’ve conducted from which we’ve extrapolated a standardized magnitude of impact that ranges from 0 to 1 – Happy to chat more about this later but I don’t want to geek out too much and lose you here!; 4) the feasibility of changing a specific urban design dimension – so something like connectivity is harder to fix than something like pedestrian amenities, as I mentioned earlier; and finally 5) if the community was involved in the data collection process, we compute an average score that measures how important and satisfied the community is with each of the urban design dimensions. In the end, the dimension with the highest “score” is prioritized, as it will essentially give you the biggest bang for your – likely limited – buck, same as with the flight ticket. It’s sort of like an exponentially better version of an existing conditions analyses – we go beyond the State of Place profile itself and use methods to help you set and justify evidence-based priorities.
- The other key thing we do with State of Place is identify the specific interventions and/or development proposals that would have the biggest impact on State of Place and also create an economic justification for those projects.
- If you were to compare interventions,
- you would choose different urban design dimensions to compare,
- Then choose from different types of interventions that would boost the scores for those dimensions, and enter their project costs
- You would choose a benchmarking goal by which to compare them – again, these are the metrics for which we currently can predict the relationship to State of Place
- And we then calculate how those interventions would change the State of Place score and what the corresponding predicted return on investment would be for each project. We use that same impact score (the relationship between State of Place and these key outcomes) to calculate this number .00001363 .00000297 .00000953
- Extending that in terms of what it means for value for money and total value capture…gives you an objective way to compare scenarios AND communicate and justify its value
- We can do the same for development proposals
- Entering the different project costs
- Choosing the benchmark or goal
- And then calculating the ROI on place!
- We are doing this currently for one of our clients who is managing a $30M equity fund focusing on underserved neighborhoods in Boston. They are using State of Place to help identify which development projects will have the most impact on Place – and ultimately informing which ones they will fund.
- This is not out of reach for Houston. We can weave this narrative for Houston as well. I’d love nothing more than to bring State of Place back to it’s birth right – to fulfill the vision of those urban brokers, who today are a little less renegade and a little more trail blazer. I am eager to create a data-driven story to make the case for place in Houston.
- Ultimately, my mission has been not only to create the academic evidence to put place – and walkability – into the equation, but to transform that evidence into an accessible, real-world tool to advance the state of place of real communities. Ever-driven by my Westchester story – my aim, my passion, has been to offer the choice of place. No one should have to go through that much effort to get a chicken terriyaki sub (even if it was mighty tasty) or a gallon of milk – or a cocktail, or place to gather with friends or family. Everyone should have the option of experiencing the infectiousness of powerful places. Thanks very much