
Recommended
Recommended
More Related Content
Similar to The motion picture industry is a competitive business. More than 50 .docx
Similar to The motion picture industry is a competitive business. More than 50 .docx (14)
More from mallisonshavon
More from mallisonshavon (20)
Recently uploaded
Recently uploaded (20)
The motion picture industry is a competitive business. More than 50 .docx
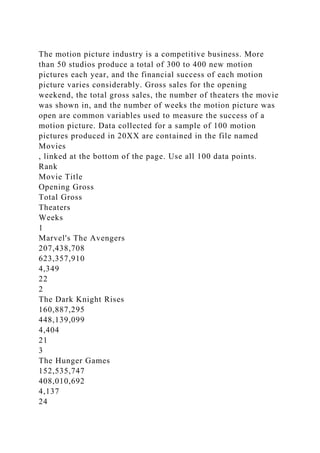
- 1. The motion picture industry is a competitive business. More than 50 studios produce a total of 300 to 400 new motion pictures each year, and the financial success of each motion picture varies considerably. Gross sales for the opening weekend, the total gross sales, the number of theaters the movie was shown in, and the number of weeks the motion picture was open are common variables used to measure the success of a motion picture. Data collected for a sample of 100 motion pictures produced in 20XX are contained in the file named Movies , linked at the bottom of the page. Use all 100 data points. Rank Movie Title Opening Gross Total Gross Theaters Weeks 1 Marvel's The Avengers 207,438,708 623,357,910 4,349 22 2 The Dark Knight Rises 160,887,295 448,139,099 4,404 21 3 The Hunger Games 152,535,747 408,010,692 4,137 24
- 2. 4 Skyfall 88,364,714 304,360,277 3,526 17 5 The Hobbit: An Unexpected Journey 84,617,303 303,003,568 4,100 19 6 The Twilight Saga: Breaking Dawn Part 2 141,067,634 292,324,737 4,070 16 7 The Amazing Spider-Man 62,004,688 262,030,663 4,318 15 8 Brave 66,323,594 237,283,207 4,164 30 9 Ted 54,415,205 218,815,487 3,303 17
- 3. 10 Madagascar 3: Europe's Most Wanted 60,316,738 216,391,482 4,263 19 11 Dr. Seuss' The Lorax 70,217,070 214,030,500 3,769 21 12 Wreck-It Ralph 49,038,712 189,422,889 3,752 26 13 Lincoln 944,308 182,207,973 2,293 24 14 MIB 3 54,592,779 179,020,854 4,248 15 15 Django Unchained 30,122,888 162,805,434 3,012 20
- 4. 16 Ice Age: Continental Drift 46,629,259 161,321,843 3,886 30 17 Snow White and the Huntsman 56,217,700 155,332,381 3,777 14 18 Les Miserables (2012) 27,281,735 148,809,770 2,927 14 19 Hotel Transylvania 42,522,194 148,313,048 3,375 22 20 Taken 2 49,514,769 139,854,287 3,706 20 21 21 Jump Street 36,302,612 138,447,667 3,148 15
- 5. 22 Argo 19,458,109 136,024,128 3,247 28 23 Silver Linings Playbook 443,003 132,092,958 2,809 29 24 Prometheus 51,050,101 126,477,084 3,442 15 25 Safe House 40,172,720 126,373,434 3,121 14 26 The Vow 41,202,458 125,014,030 3,038 14 27 Life of Pi 22,451,514 124,987,023 2,946 35
- 6. 28 Magic Mike 39,127,170 113,721,571 3,120 13 29 The Bourne Legacy 38,142,825 113,203,870 3,753 13 30 Journey 2: The Mysterious Island 27,335,363 103,860,290 3,500 20 31 Rise of the Guardians 23,773,465 103,412,758 3,672 20 32 Zero Dark Thirty 417,150 95,720,716 2,946 15 33 Flight 24,900,566 93,772,375 2,638 15
- 7. 34 Think Like a Man 33,636,303 91,547,205 2,052 11 35 The Campaign 26,588,460 86,907,746 3,302 15 36 The Expendables 2 28,591,370 85,028,192 3,355 14 37 Wrath of the Titans 33,457,188 83,670,083 3,545 13 38 Jack Reacher 15,210,156 80,070,736 3,352 13 39 Dark Shadows 29,685,274 79,727,149 3,755 14
- 8. 40 Parental Guidance 14,554,053 77,267,296 3,368 21 41 John Carter 30,180,188 73,078,100 3,749 16 42 Act of Valor 24,476,632 70,012,847 3,053 15 43 This Is 40 11,579,175 67,544,505 2,931 10 44 Contraband 24,349,815 66,528,000 2,870 9 45 Looper 20,801,522 66,486,205 2,993 14
- 9. 46 Tyler Perry's Madea's Witness Protection 25,390,575 65,653,242 2,161 12 47 Battleship 25,534,825 65,422,625 3,702 11 48 Pitch Perfect 5,149,433 65,001,093 2,787 20 49 Mirror Mirror 18,132,085 64,935,167 3,618 20 50 Chronicle (2012) 22,004,098 64,575,175 2,908 18 51 Hope Springs 14,650,121 63,536,011 2,441 11
- 10. 52 Underworld Awakening 25,306,725 62,321,039 3,078 7 53 The Lucky One 22,518,358 60,457,138 3,175 13 54 The Dictator 17,435,092 59,650,222 3,014 10 55 Total Recall (2012) 25,577,758 58,877,969 3,601 9 56 Titanic 3D 17,285,453 57,884,114 3,674 9 57 American Reunion 21,514,080 57,011,521 3,203 8
- 11. 58 ParaNorman 14,087,050 56,003,051 3,455 20 59 This Means War 17,405,930 54,760,791 3,189 17 60 Project X 21,051,363 54,731,865 3,055 11 61 The Woman in Black 20,874,072 54,333,290 2,856 13 62 Paranormal Activity 4 29,003,866 53,921,300 3,412 11 63 The Devil Inside 33,732,515 53,261,944 2,551 11
- 12. 64 The Odd Life of Timothy Green 10,822,903 51,854,875 2,717 22 65 Ghost Rider: Spirit of Vengeance 22,115,334 51,774,002 3,174 12 66 The Grey 19,665,101 51,580,236 3,208 12 67 Red Tails 18,782,154 49,876,377 2,573 20 68 The Possession 17,732,480 49,130,154 2,860 12 69 Diary of a Wimpy Kid: Dog Days 14,623,599 49,008,662 3,401 20
- 13. 70 Sinister 18,007,634 48,086,903 2,542 12 71 Beauty and the Beast (3D) 17,751,905 47,617,067 2,625 16 72 Savages (2012) 16,016,910 47,382,068 2,635 9 73 The Best Exotic Marigold Hotel 737,051 46,412,041 1,298 25 74 Moonrise Kingdom 522,996 45,512,466 924 23 75 Here Comes the Boom 11,816,596 45,290,318 3,014 18
- 14. 76 Red Dawn (2012) 14,276,668 44,806,783 2,781 13 77 The Three Stooges 17,010,125 44,338,224 3,482 18 78 Star Wars: Episode I - The Phantom Menace (in 3D) 22,469,932 43,456,382 2,655 15 79 Resident Evil: Retribution 21,052,227 42,345,531 3,016 8 80 The Cabin in the Woods 14,743,614 42,073,277 2,811 13 81 What to Expect When You're Expecting 10,547,068 41,152,203 3,021 11
- 15. 82 Finding Nemo (3D) 16,687,773 41,128,283 2,904 18 83 End of Watch 13,152,683 41,003,371 2,780 17 84 Rock of Ages 14,437,269 38,518,613 3,470 9 85 Abraham Lincoln: Vampire Hunter 16,306,974 37,519,139 3,109 13 86 Lawless 10,001,982 37,400,127 3,138 13 87 The Guilt Trip 5,290,629 37,134,215 2,431 11
- 16. 88 That's My Boy 13,453,714 36,931,089 3,030 5 89 Trouble with the Curve 12,162,040 35,763,137 3,212 12 90 The Watch 12,750,297 35,353,000 3,168 12 91 Frankenweenie 11,412,213 35,291,068 3,005 21 92 Step Up Revolution 11,731,708 35,074,677 2,606 10 93 Tyler Perry's Good Deeds 15,583,924 35,025,791 2,132 12
- 17. 94 Monsters, Inc. (3D) 4,774,686 34,043,006 2,618 19 95 2016 Obama's America 31,610 33,449,086 2,017 13 96 House at the End of The Street 12,287,234 31,611,916 3,083 13 97 The Pirates! Band of Misfits 11,137,734 31,051,126 3,358 14 98 Joyful Noise 11,225,190 30,932,113 2,735 10 99 Chimpanzee 10,673,748 28,972,764 1,567 16
- 18. 100 The Five-Year Engagement 10,610,060 28,835,528 2,941 8 Managerial Report Prepare a report (see below) using the numerical methods of descriptive statistics presented in this module to learn how each of the variables contributes to the success of a motion picture. Be sure to include the following three (3) items in your report. Descriptive statistics (mean, median, range, and standard deviation) for each of the four variables along with an explanation of what the descriptive statistics tell us about the motion picture industry. Use the z-score to determine which movies, if any, should be considered high-performance outliers in each of the four variables. If there are any outliers in any category, please list them and state for which category they are an outlier. Describe which method you used to make your determination. Descriptive statistics (correlation coefficient) showing the relationship between total gross sales and each of the other three variables. Evaluate the relationships between total gross sales and each of the other three variables. Use tables, charts, graphs, or visual dashboards to support your conclusions. Your report must contain the following: A title page in APA style. An introduction that summarizes the problem. The body of the paper should answer the questions posed in the problem by communicating the results of your analysis. Include results of calculations, as well as charts and graphs, where appropriate. A conclusion paragraph that addresses your findings and what you have determined from the data and your analysis. Submit your Excel file in addition to your report.