Downloaded 238 times
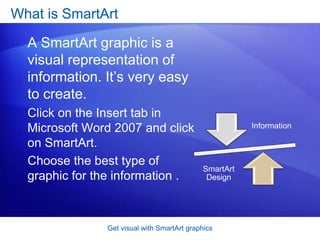
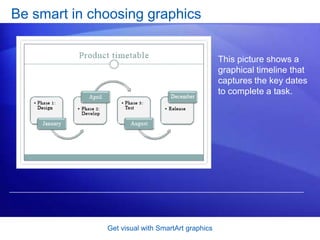
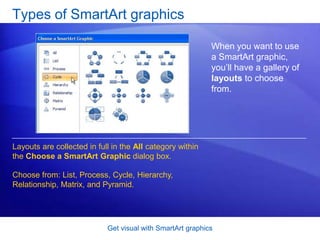
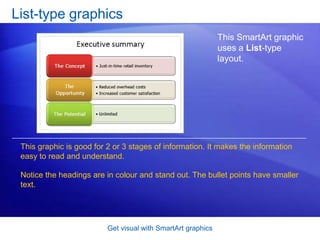

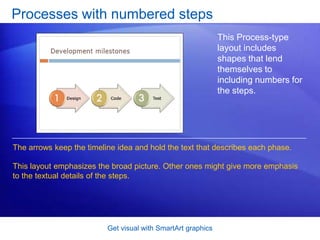

SmartArt graphics are visual representations of information in Microsoft Word 2007, easily created using the insert tab. Various types of layouts are available, including lists, processes, hierarchies, and relationships, each with unique features tailored for different presentation needs. The document details the characteristics and use cases of these layouts to enhance visual communication.


![74676371-Coagulation-and-Flocculation[1].ppt](https://cdn.slidesharecdn.com/ss_thumbnails/74676371-coagulation-and-flocculation1-260116154109-a3cbf55e-thumbnail.jpg?width=640&height=640&fit=bounds)


