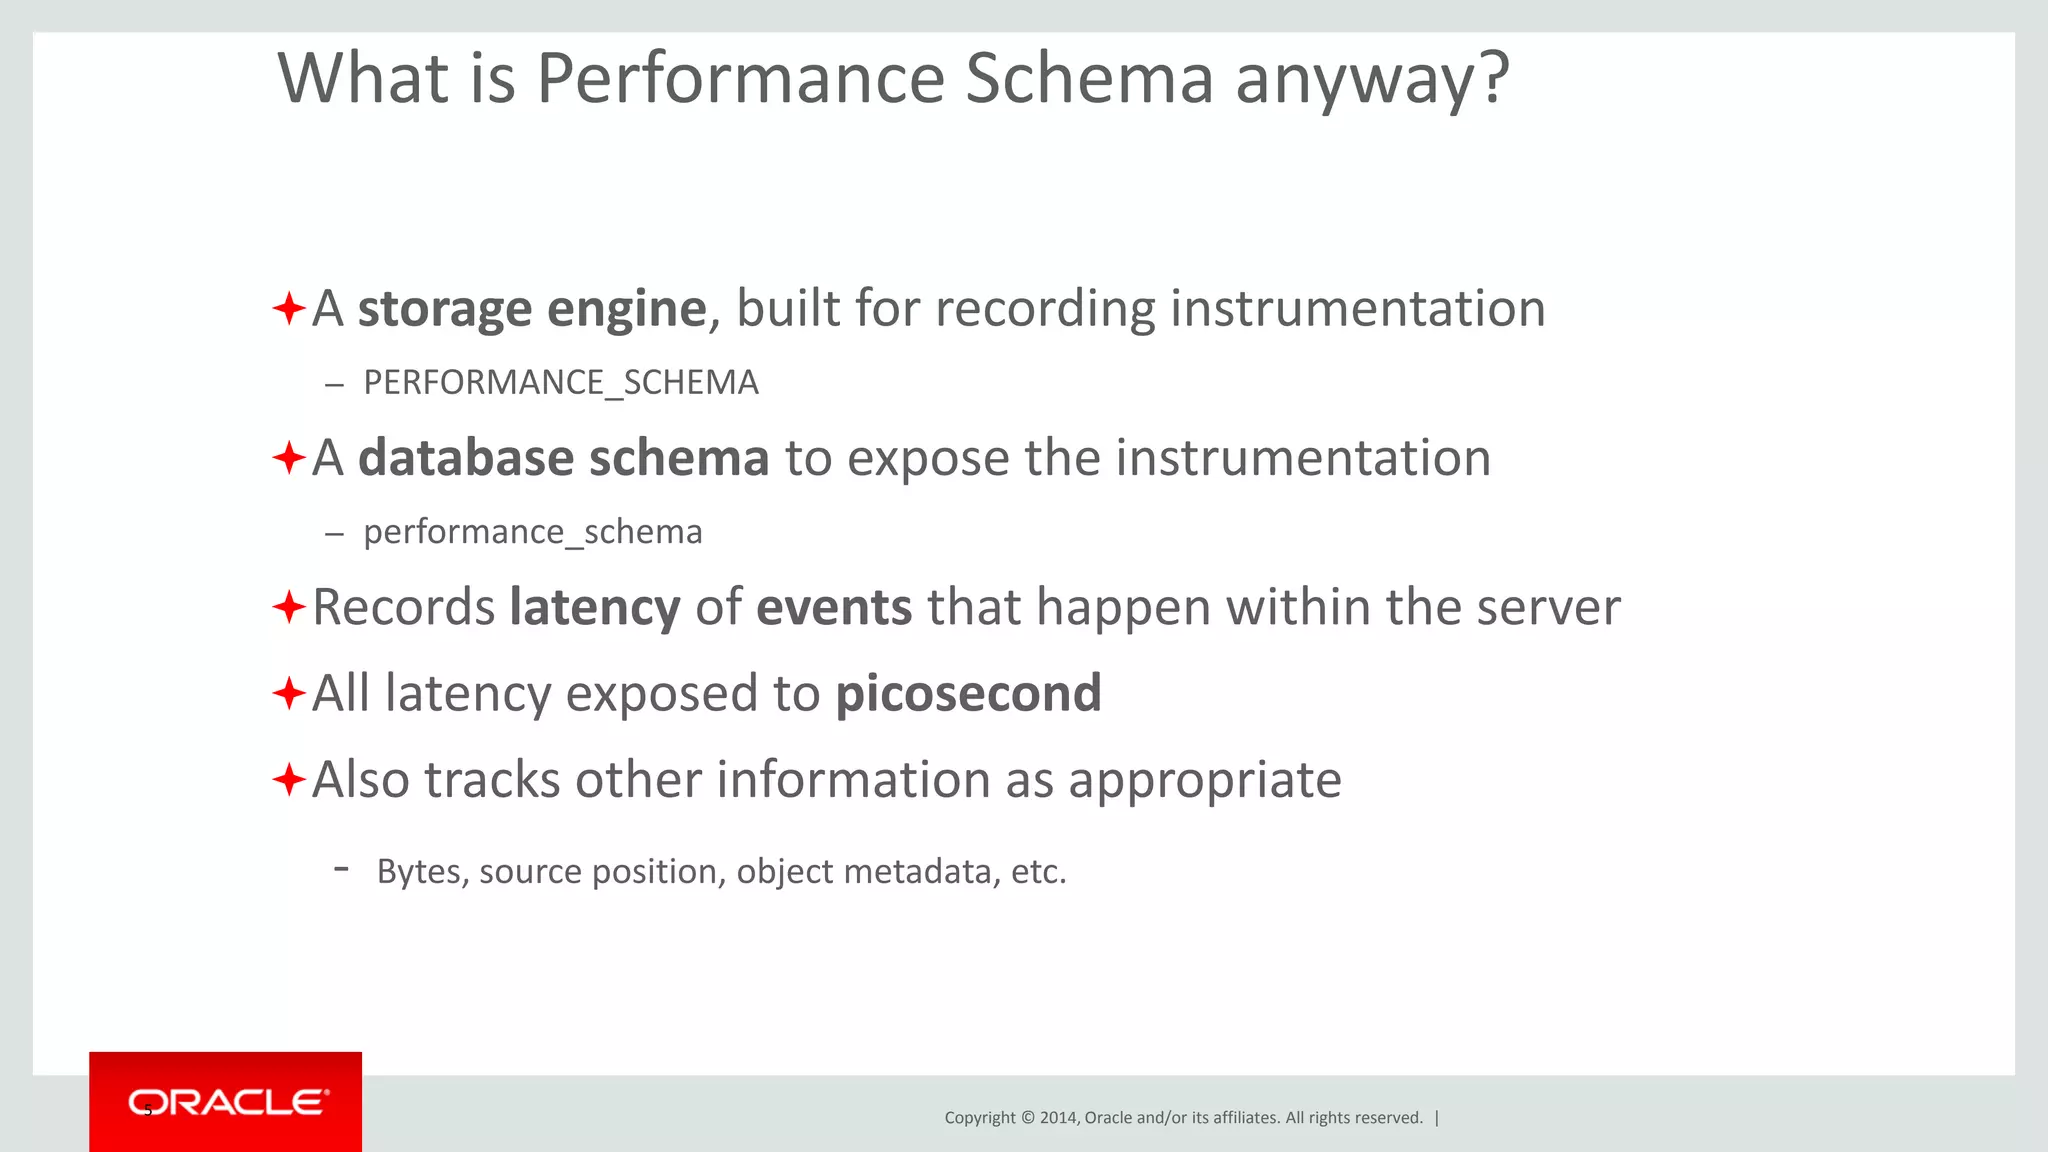
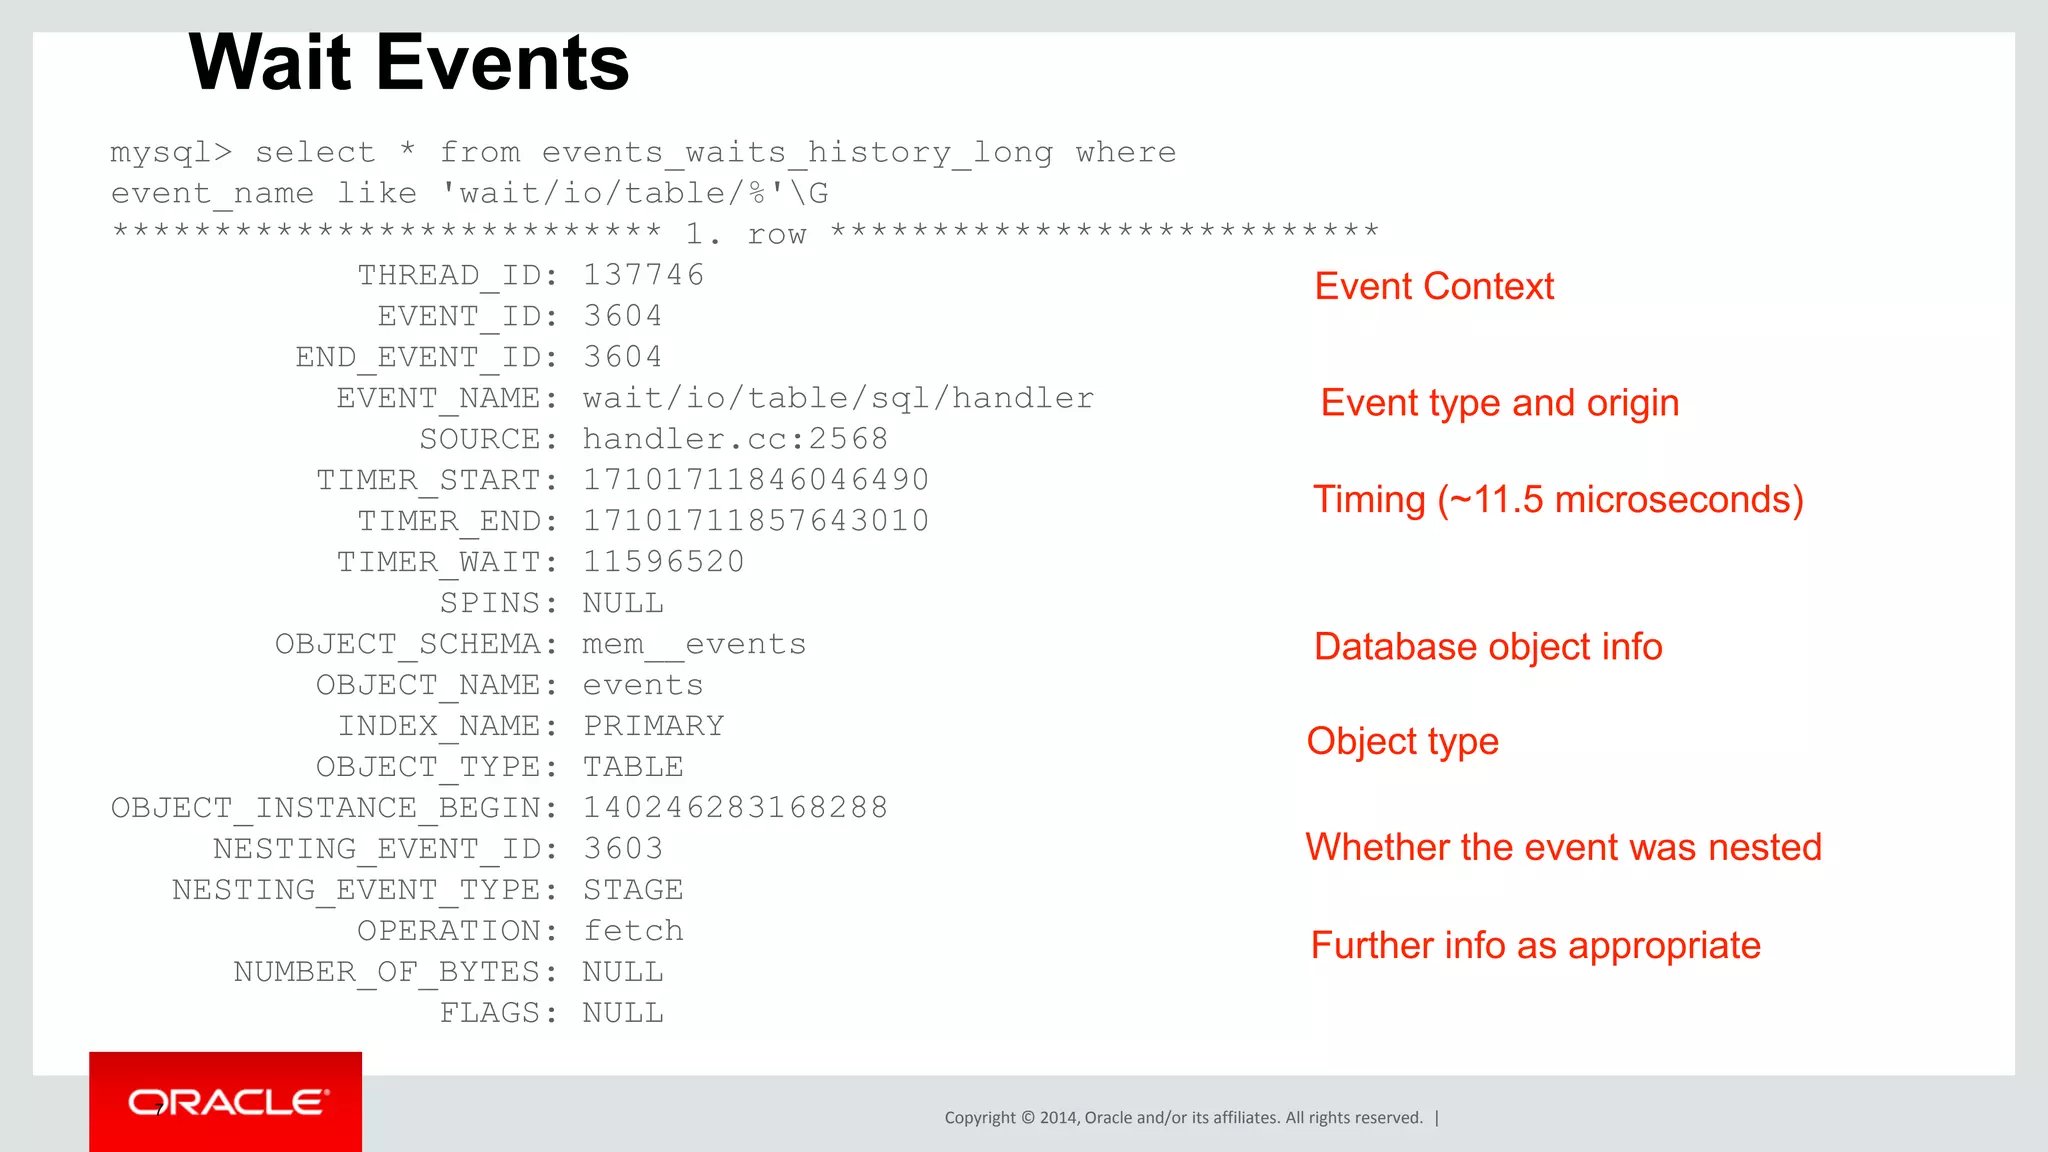
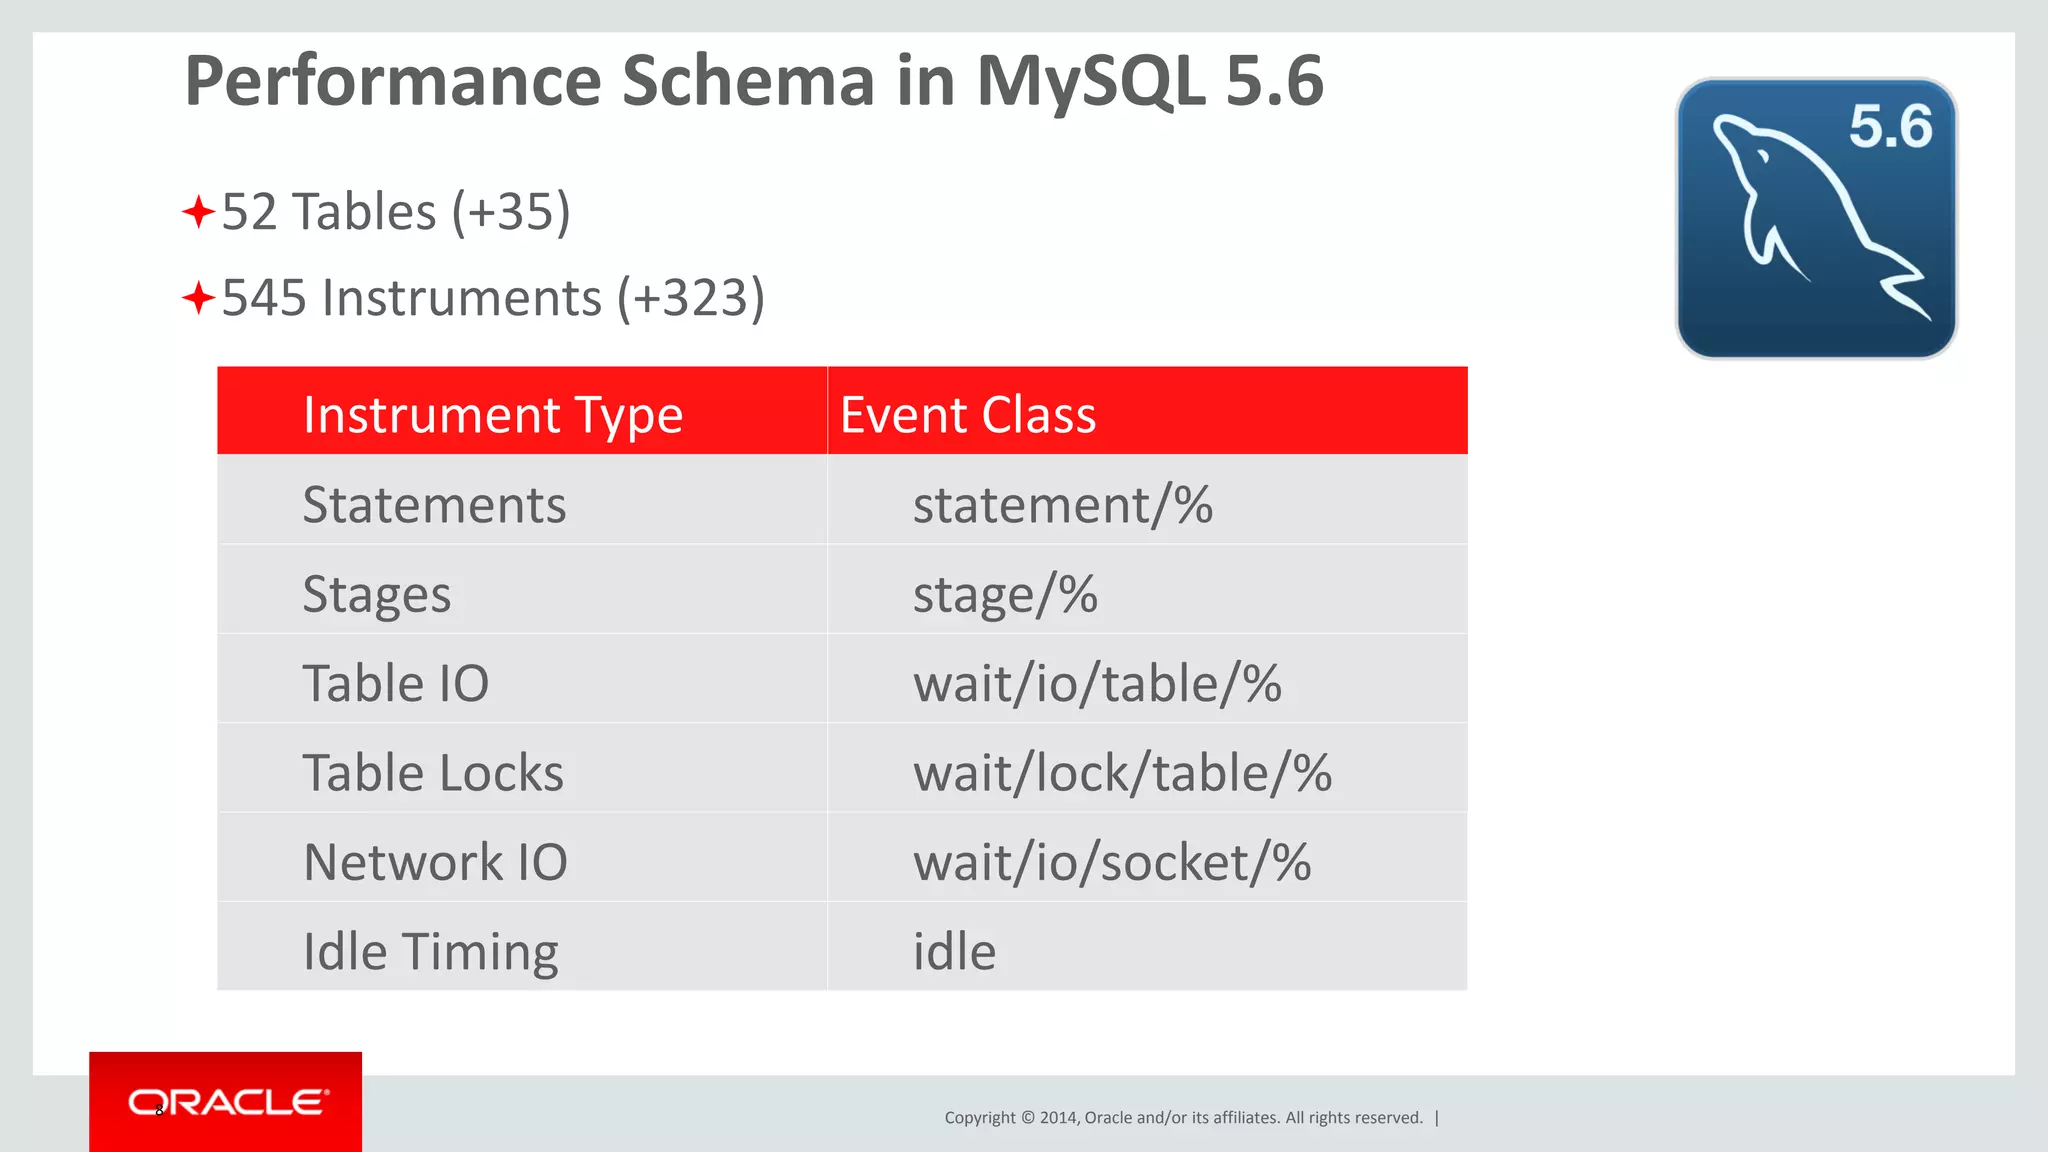
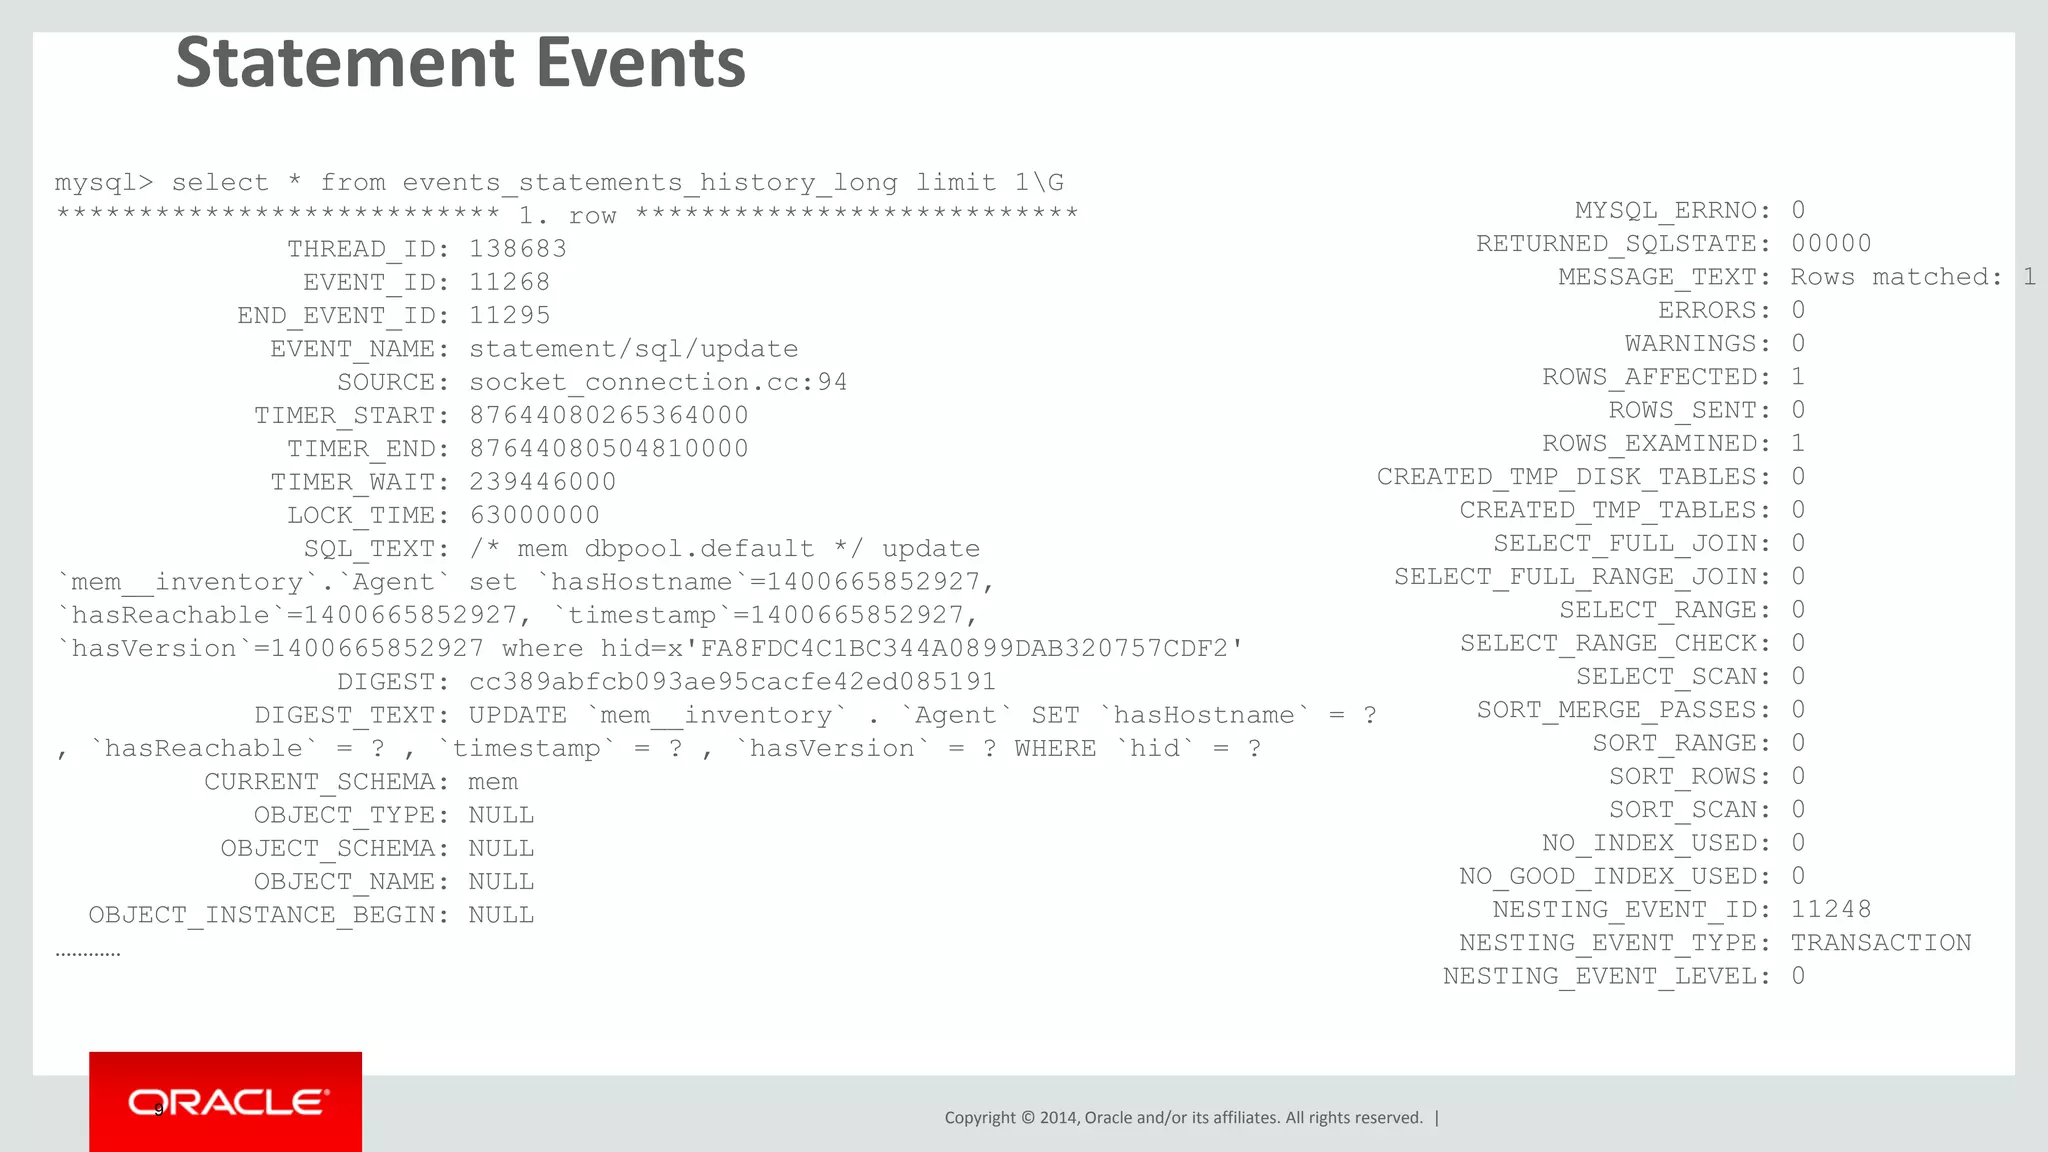
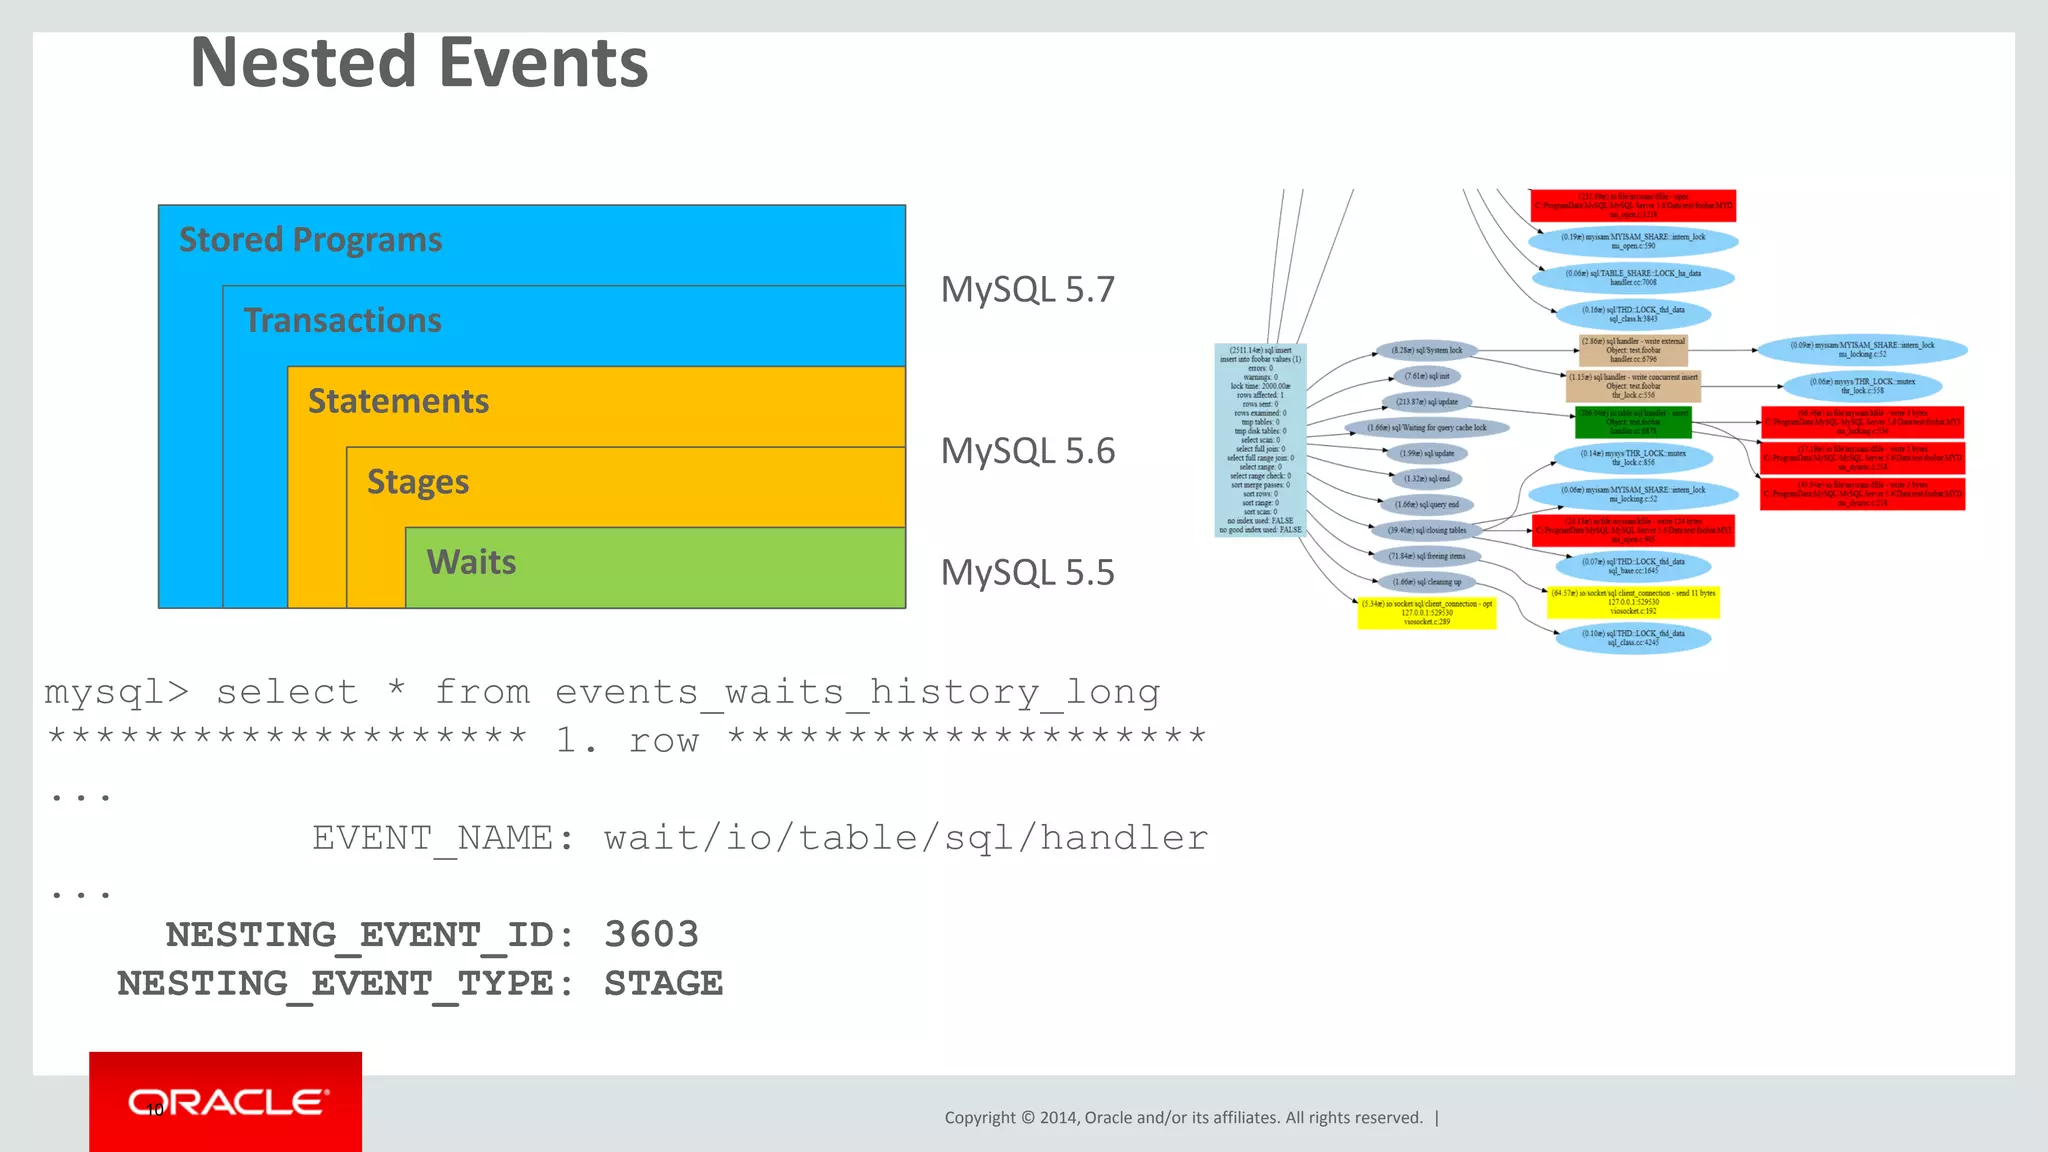
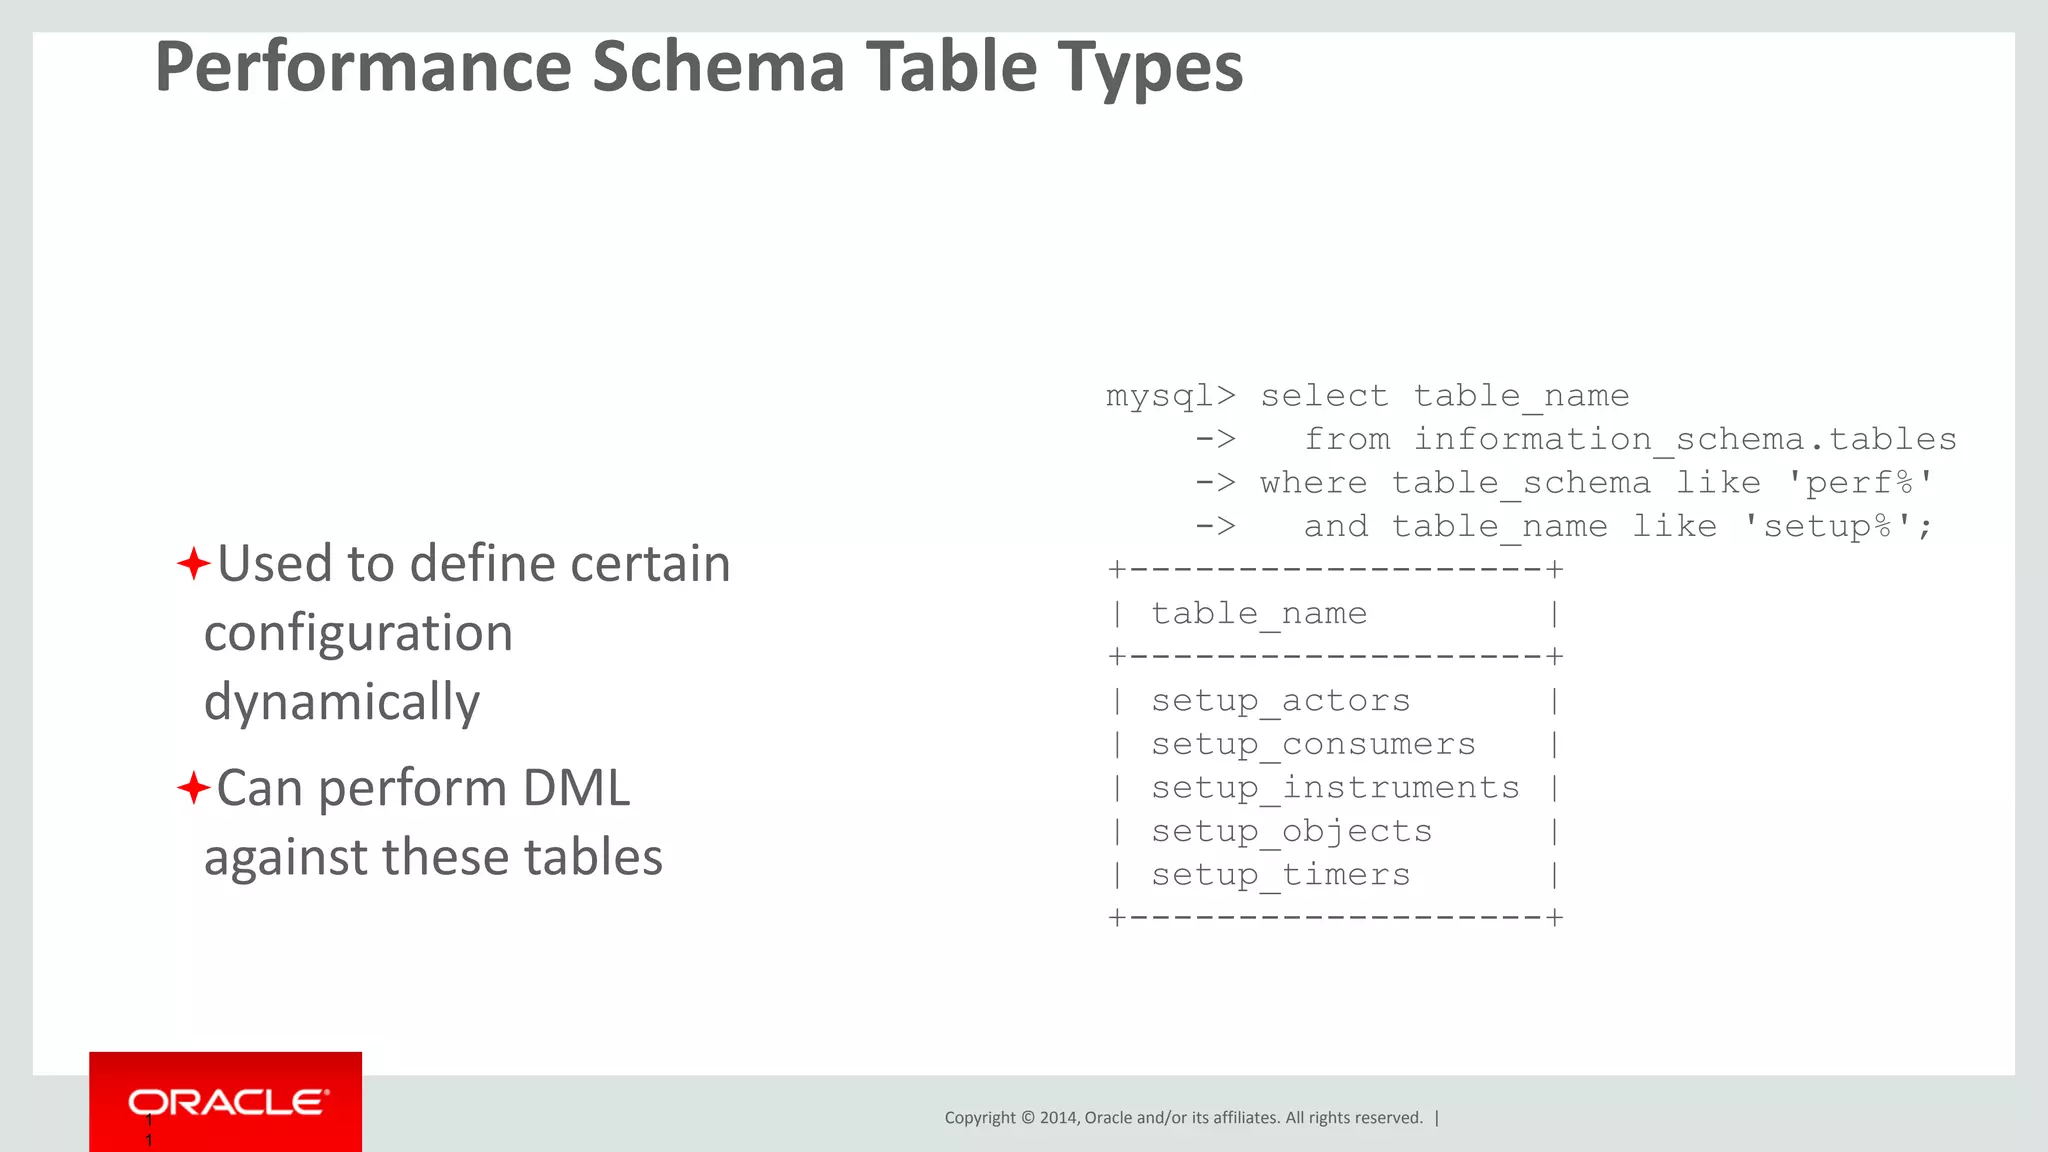
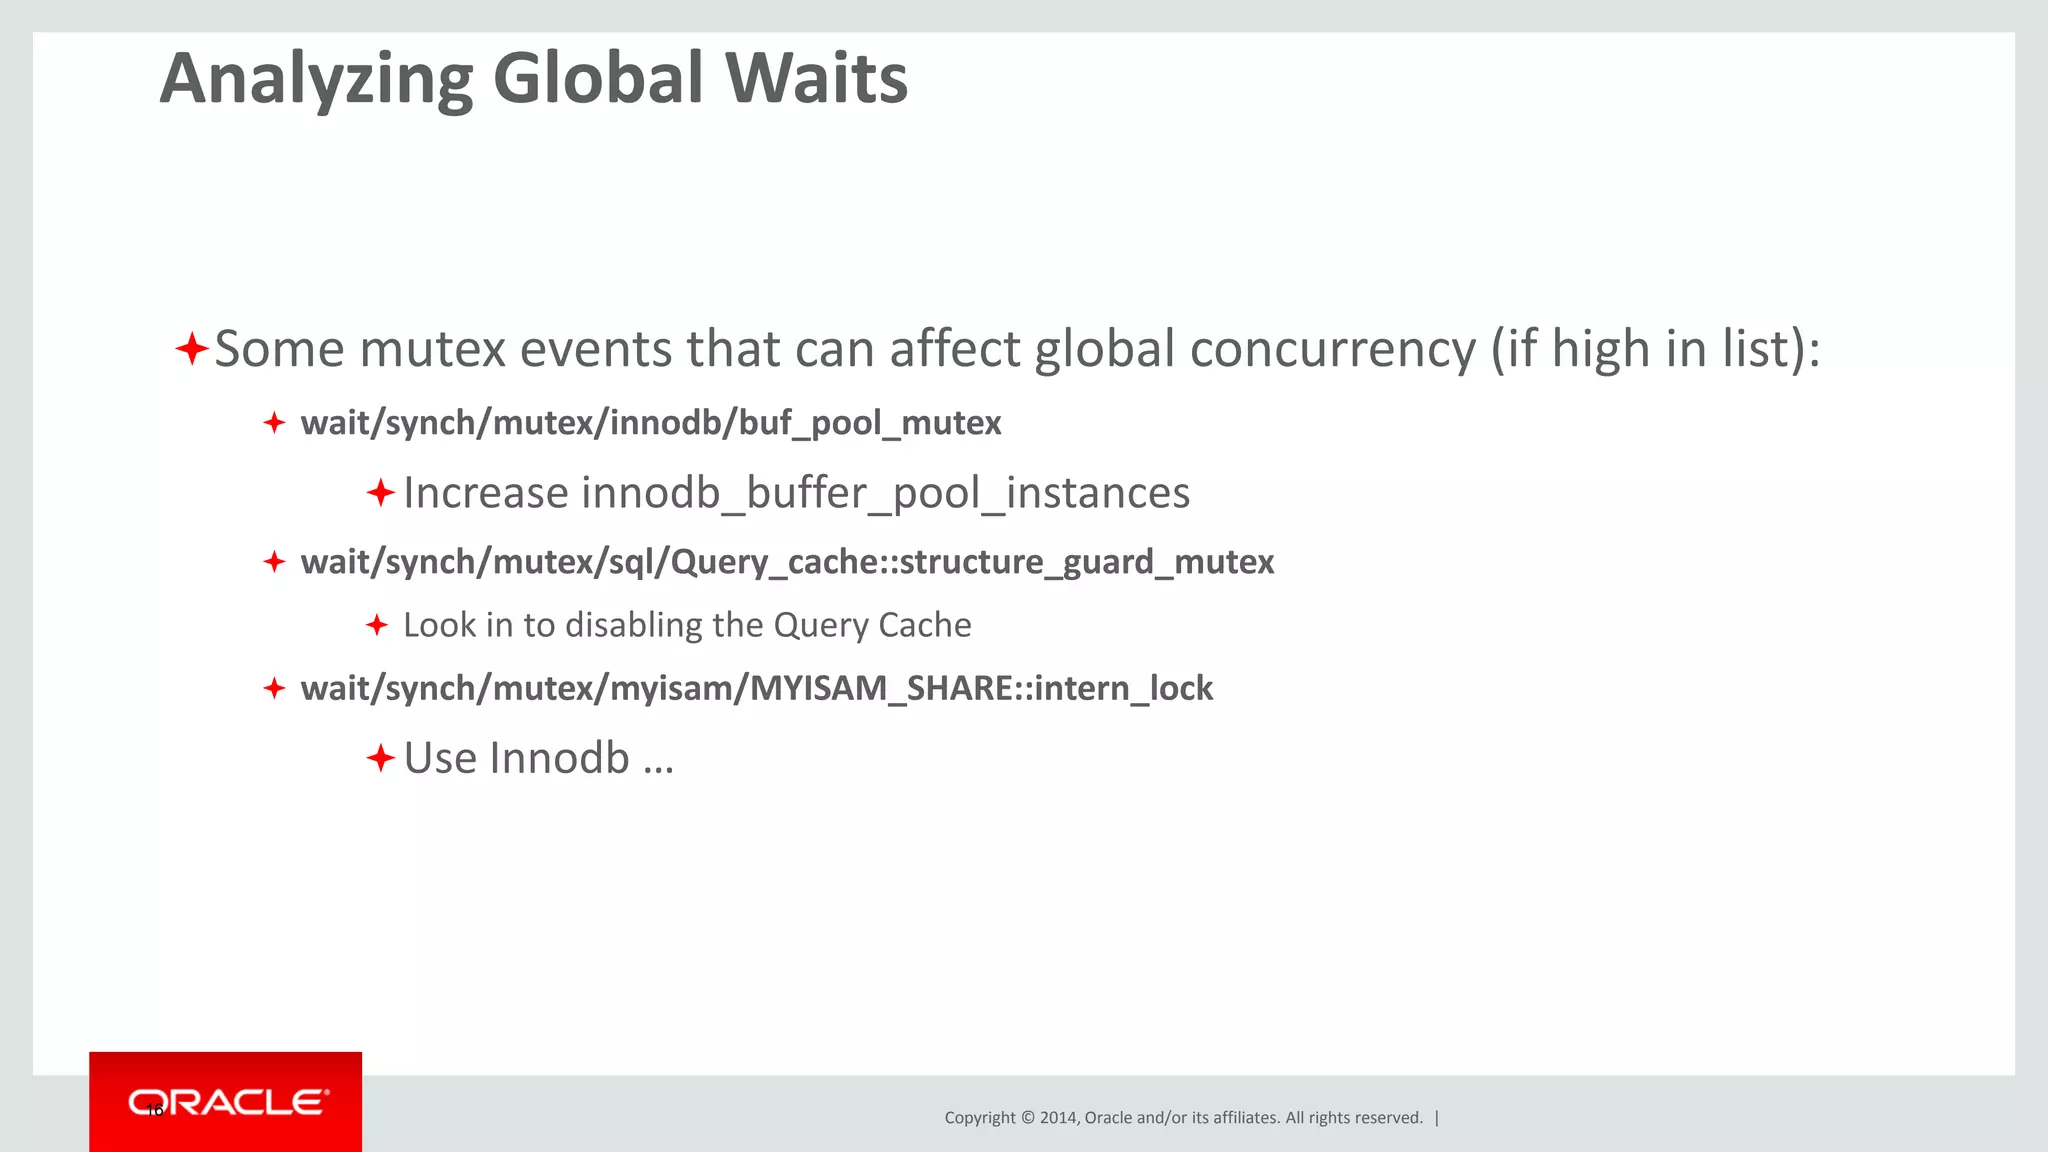
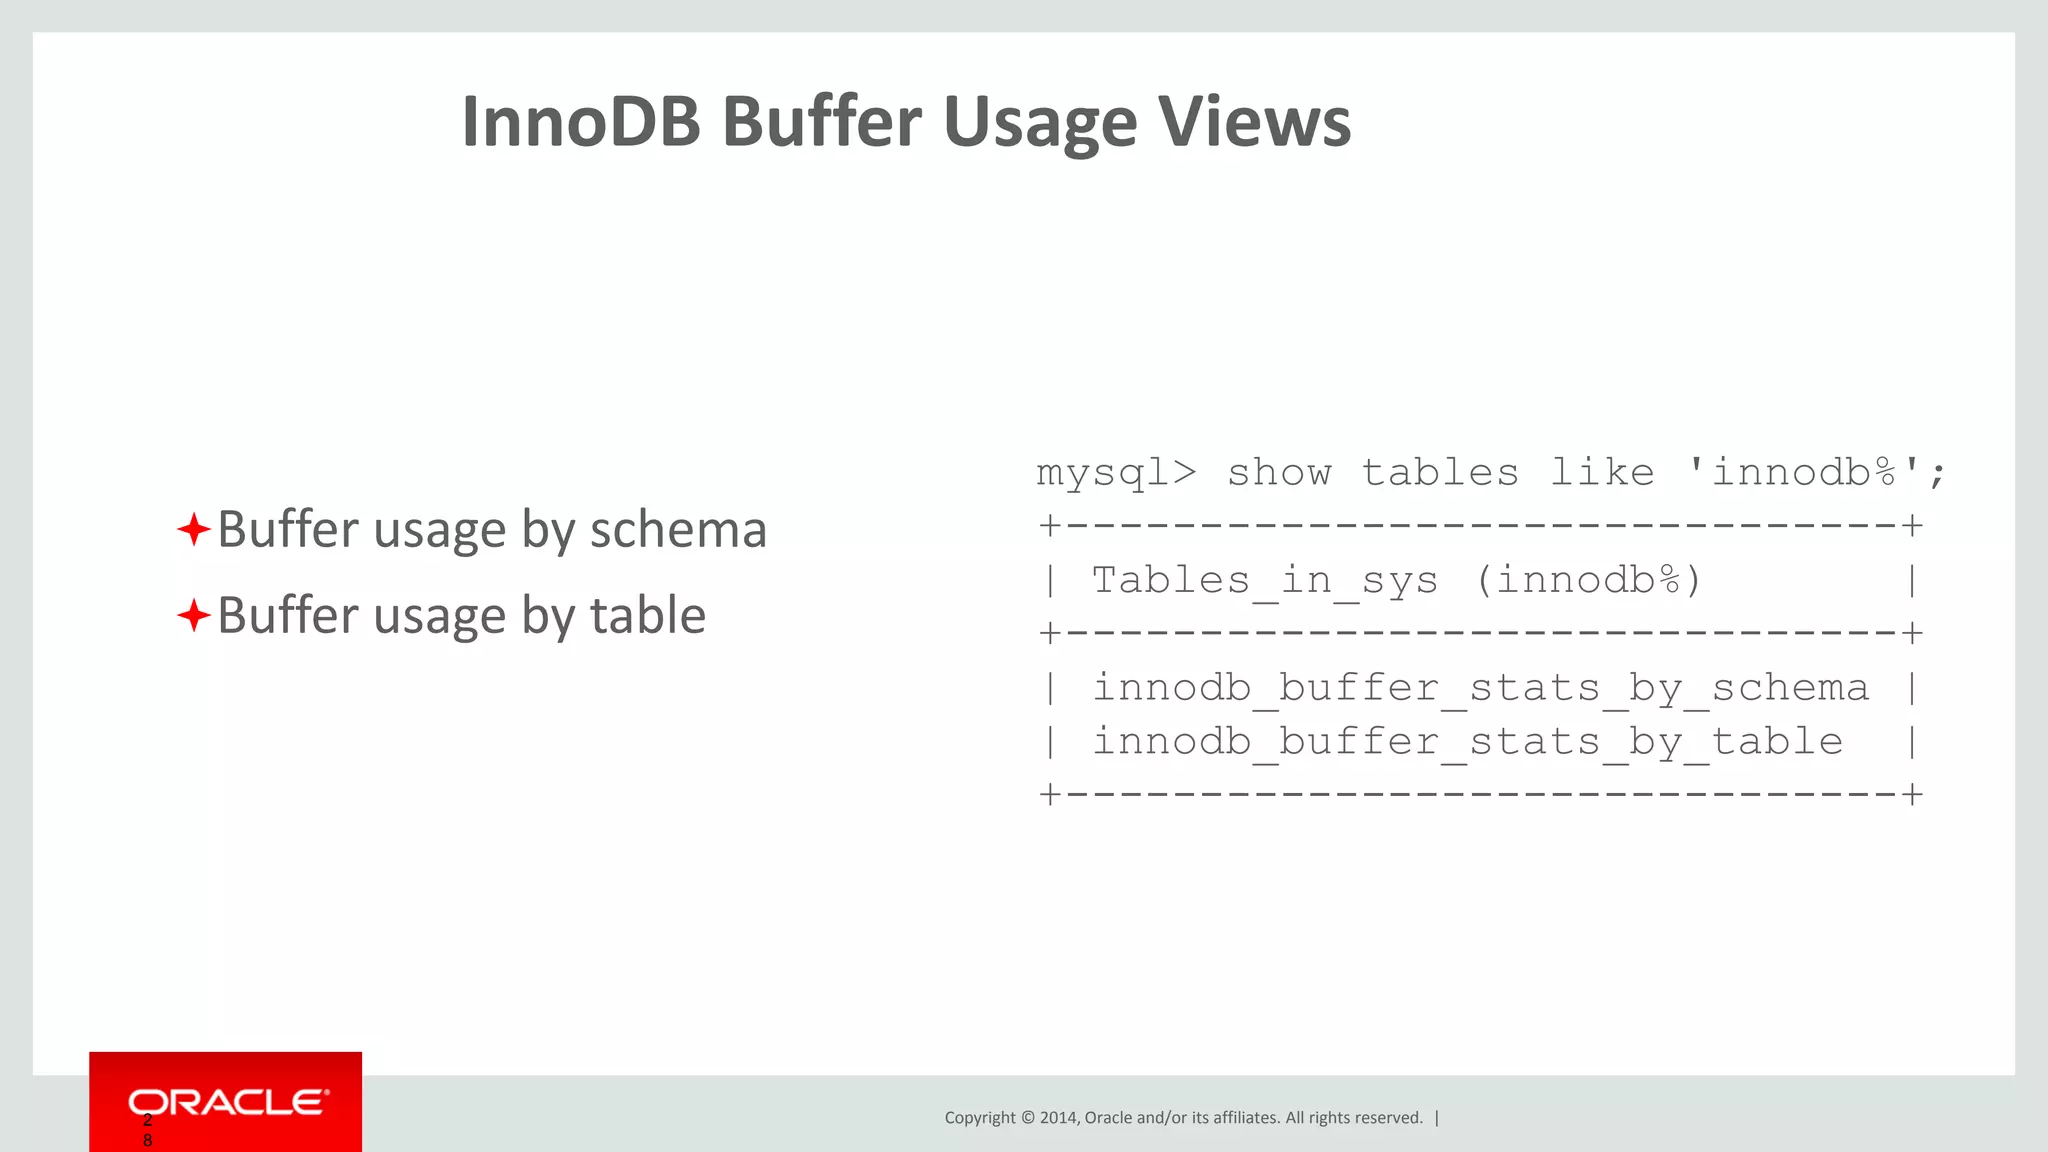
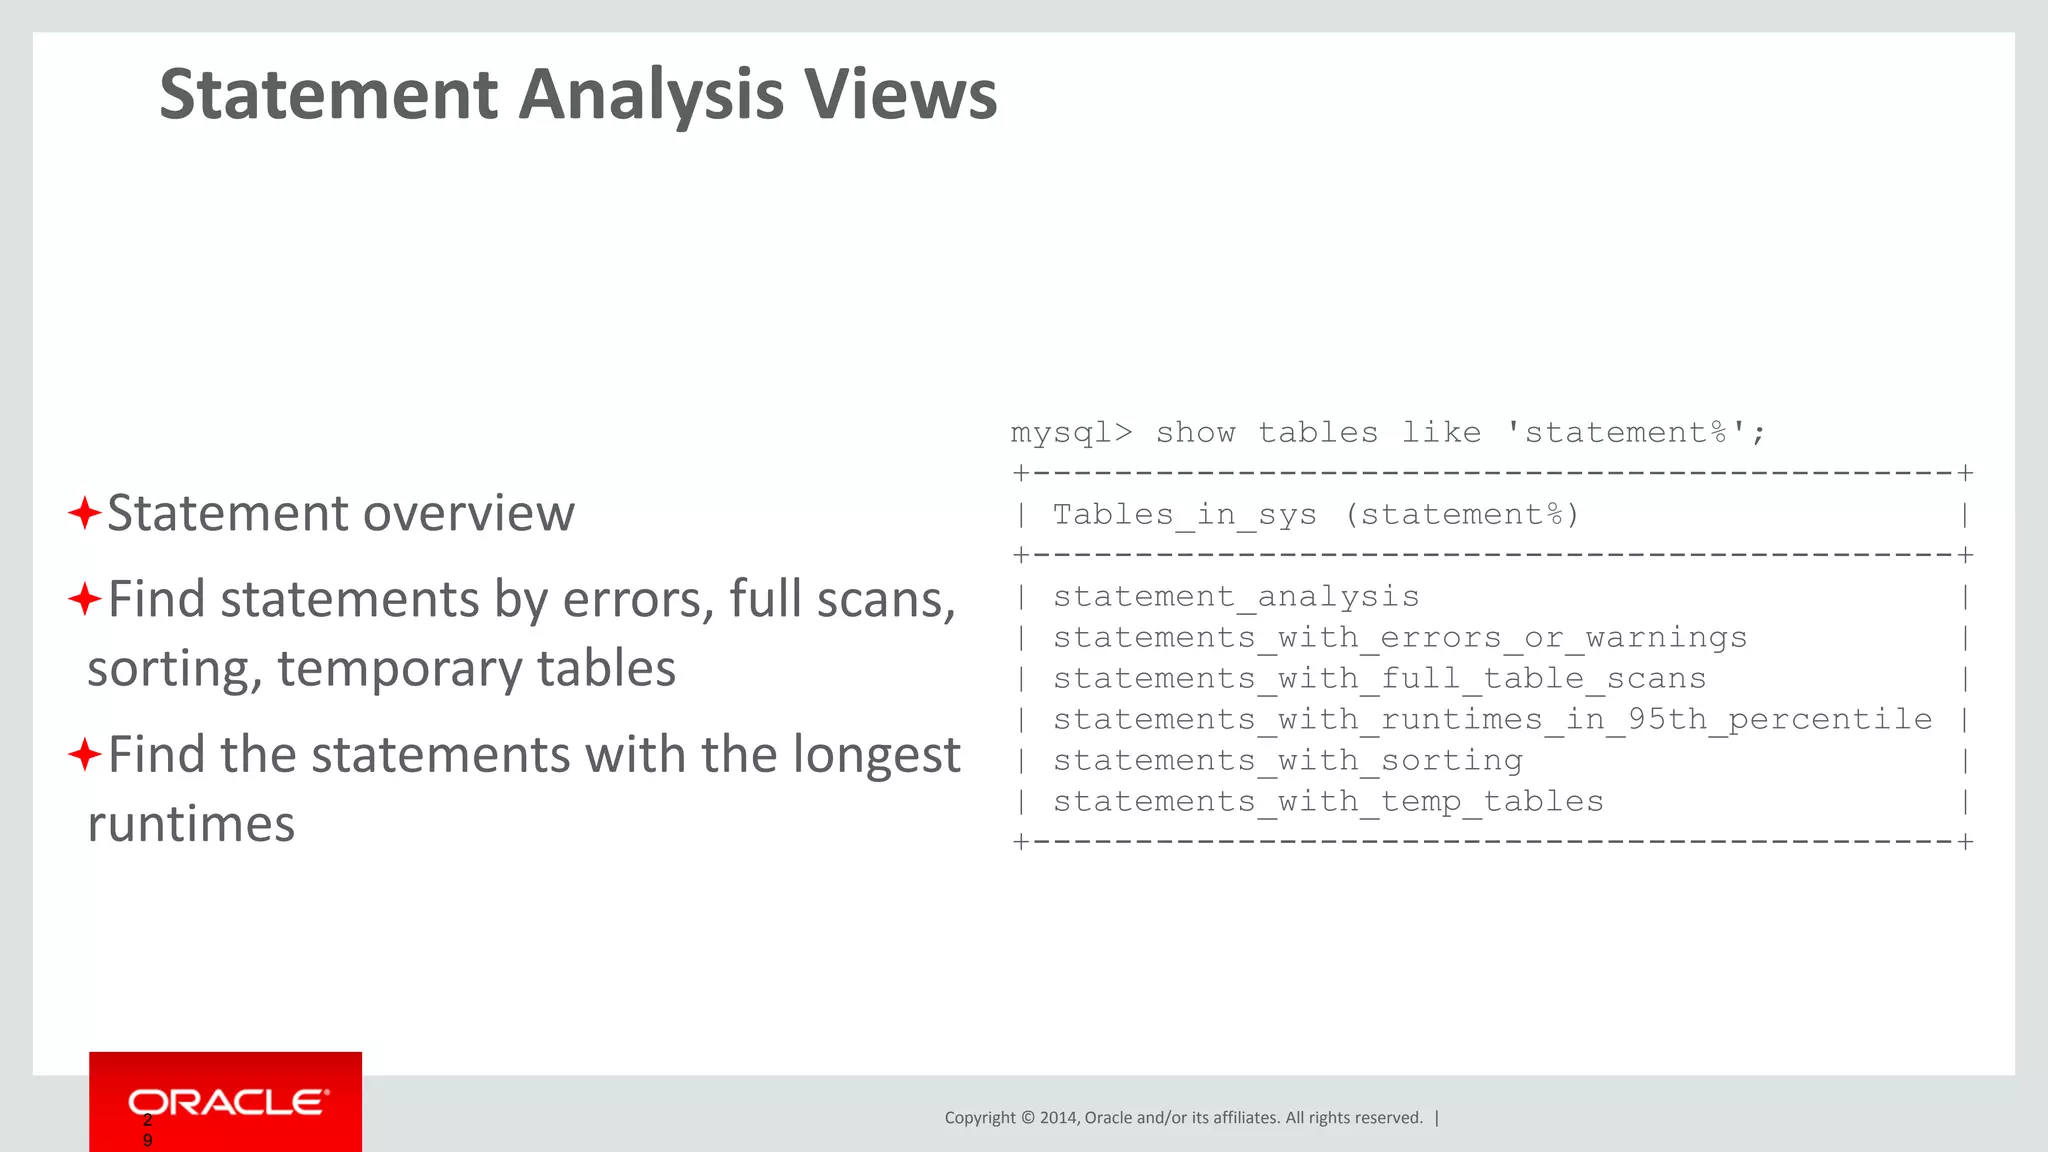
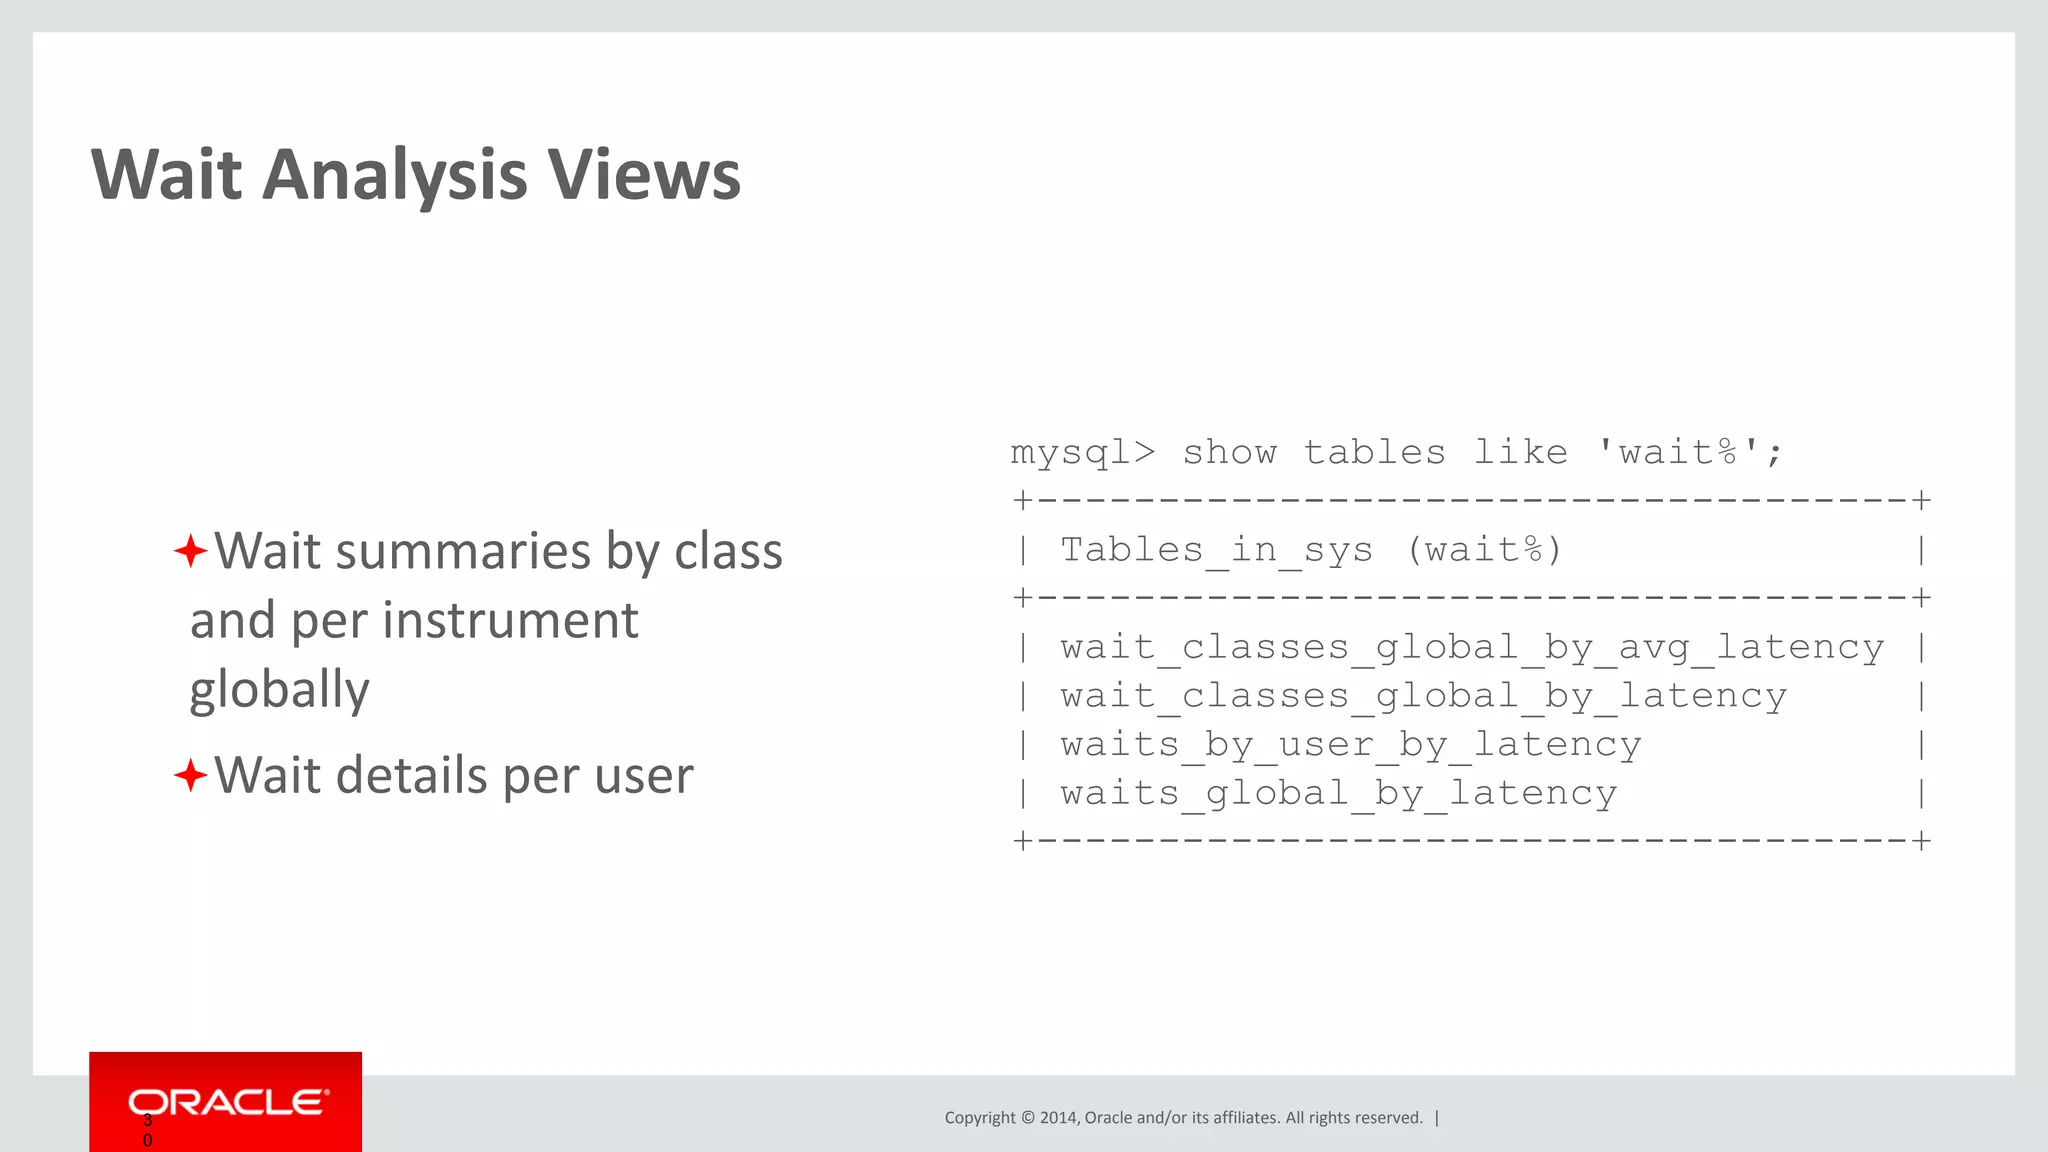
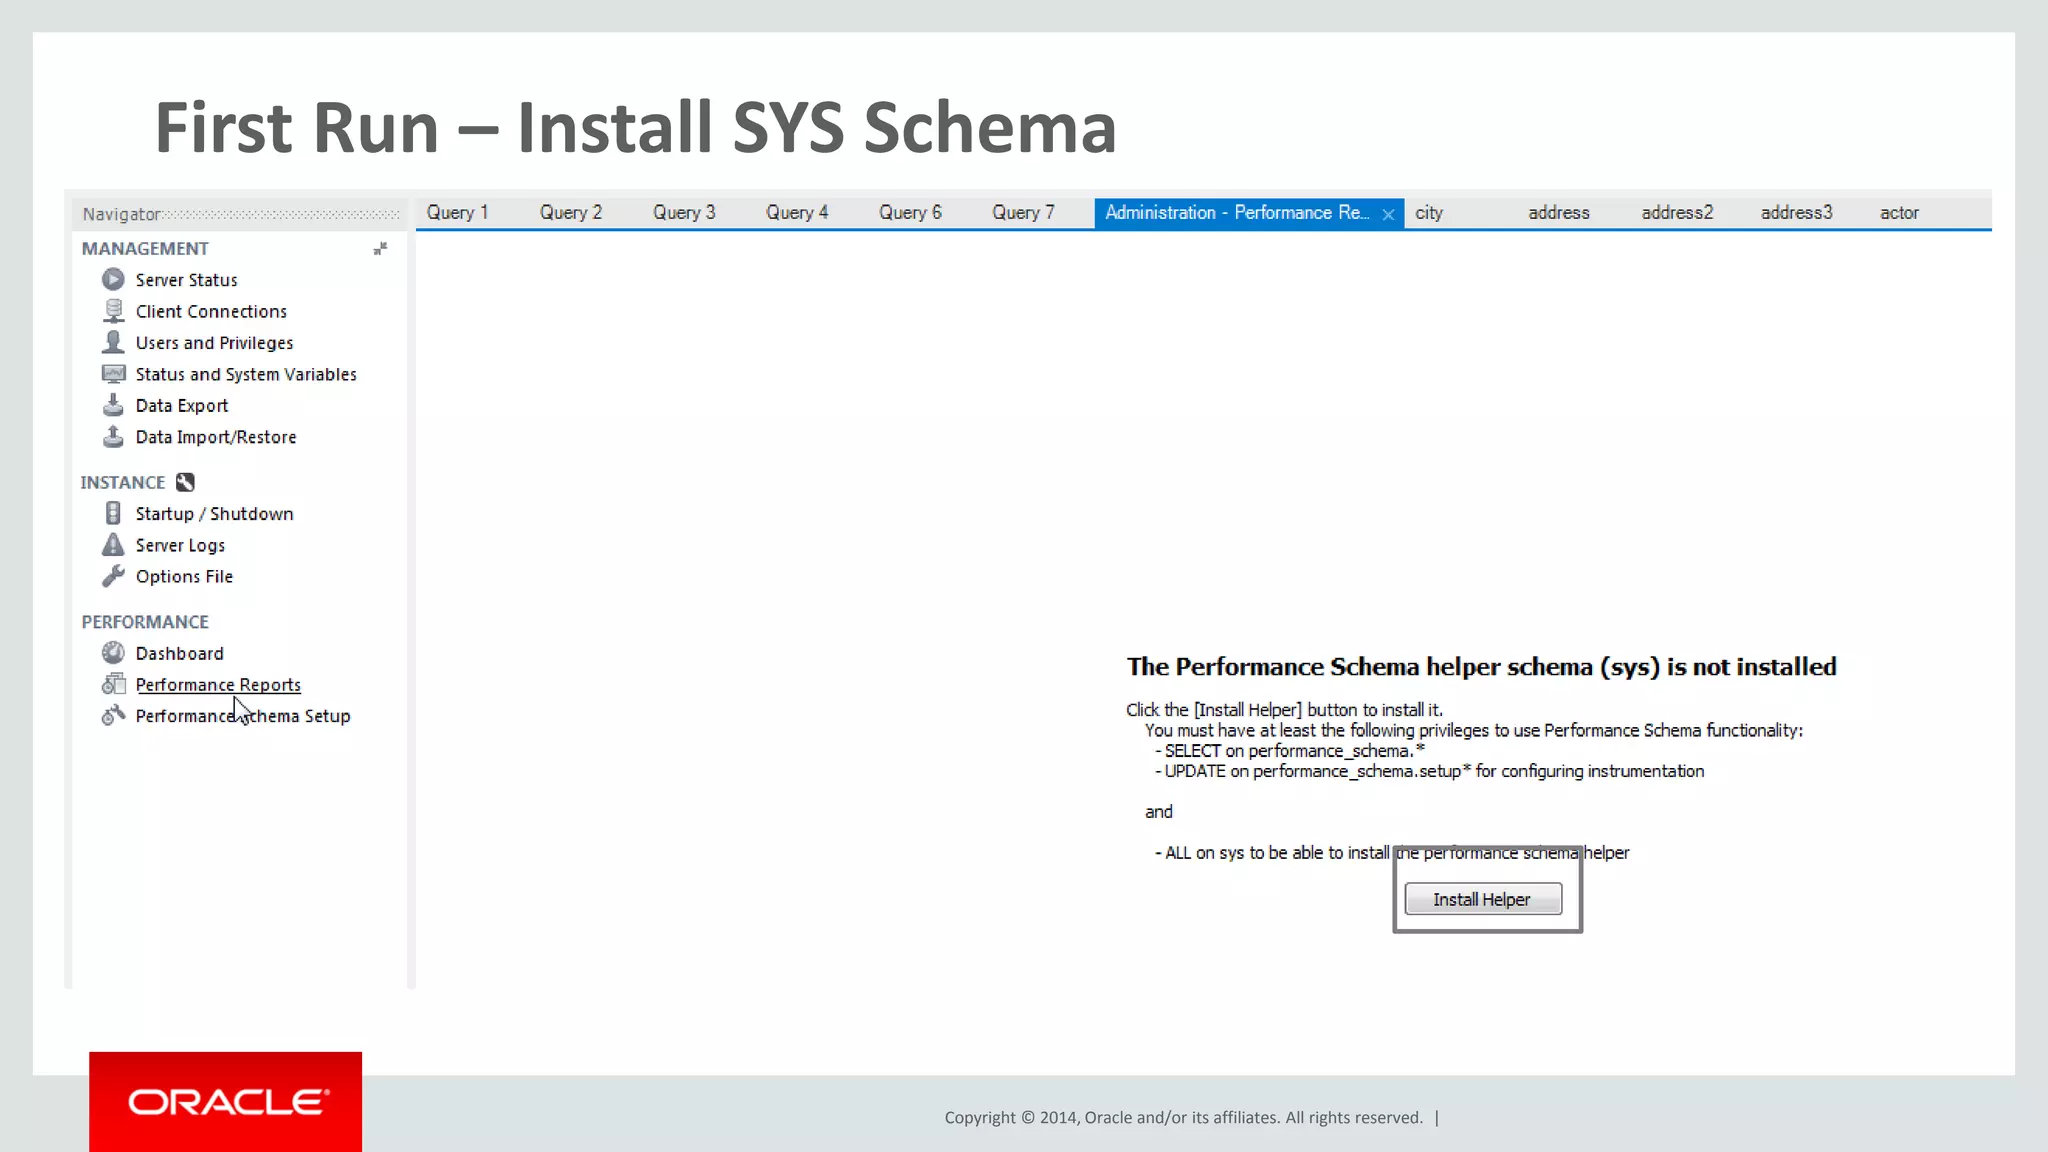
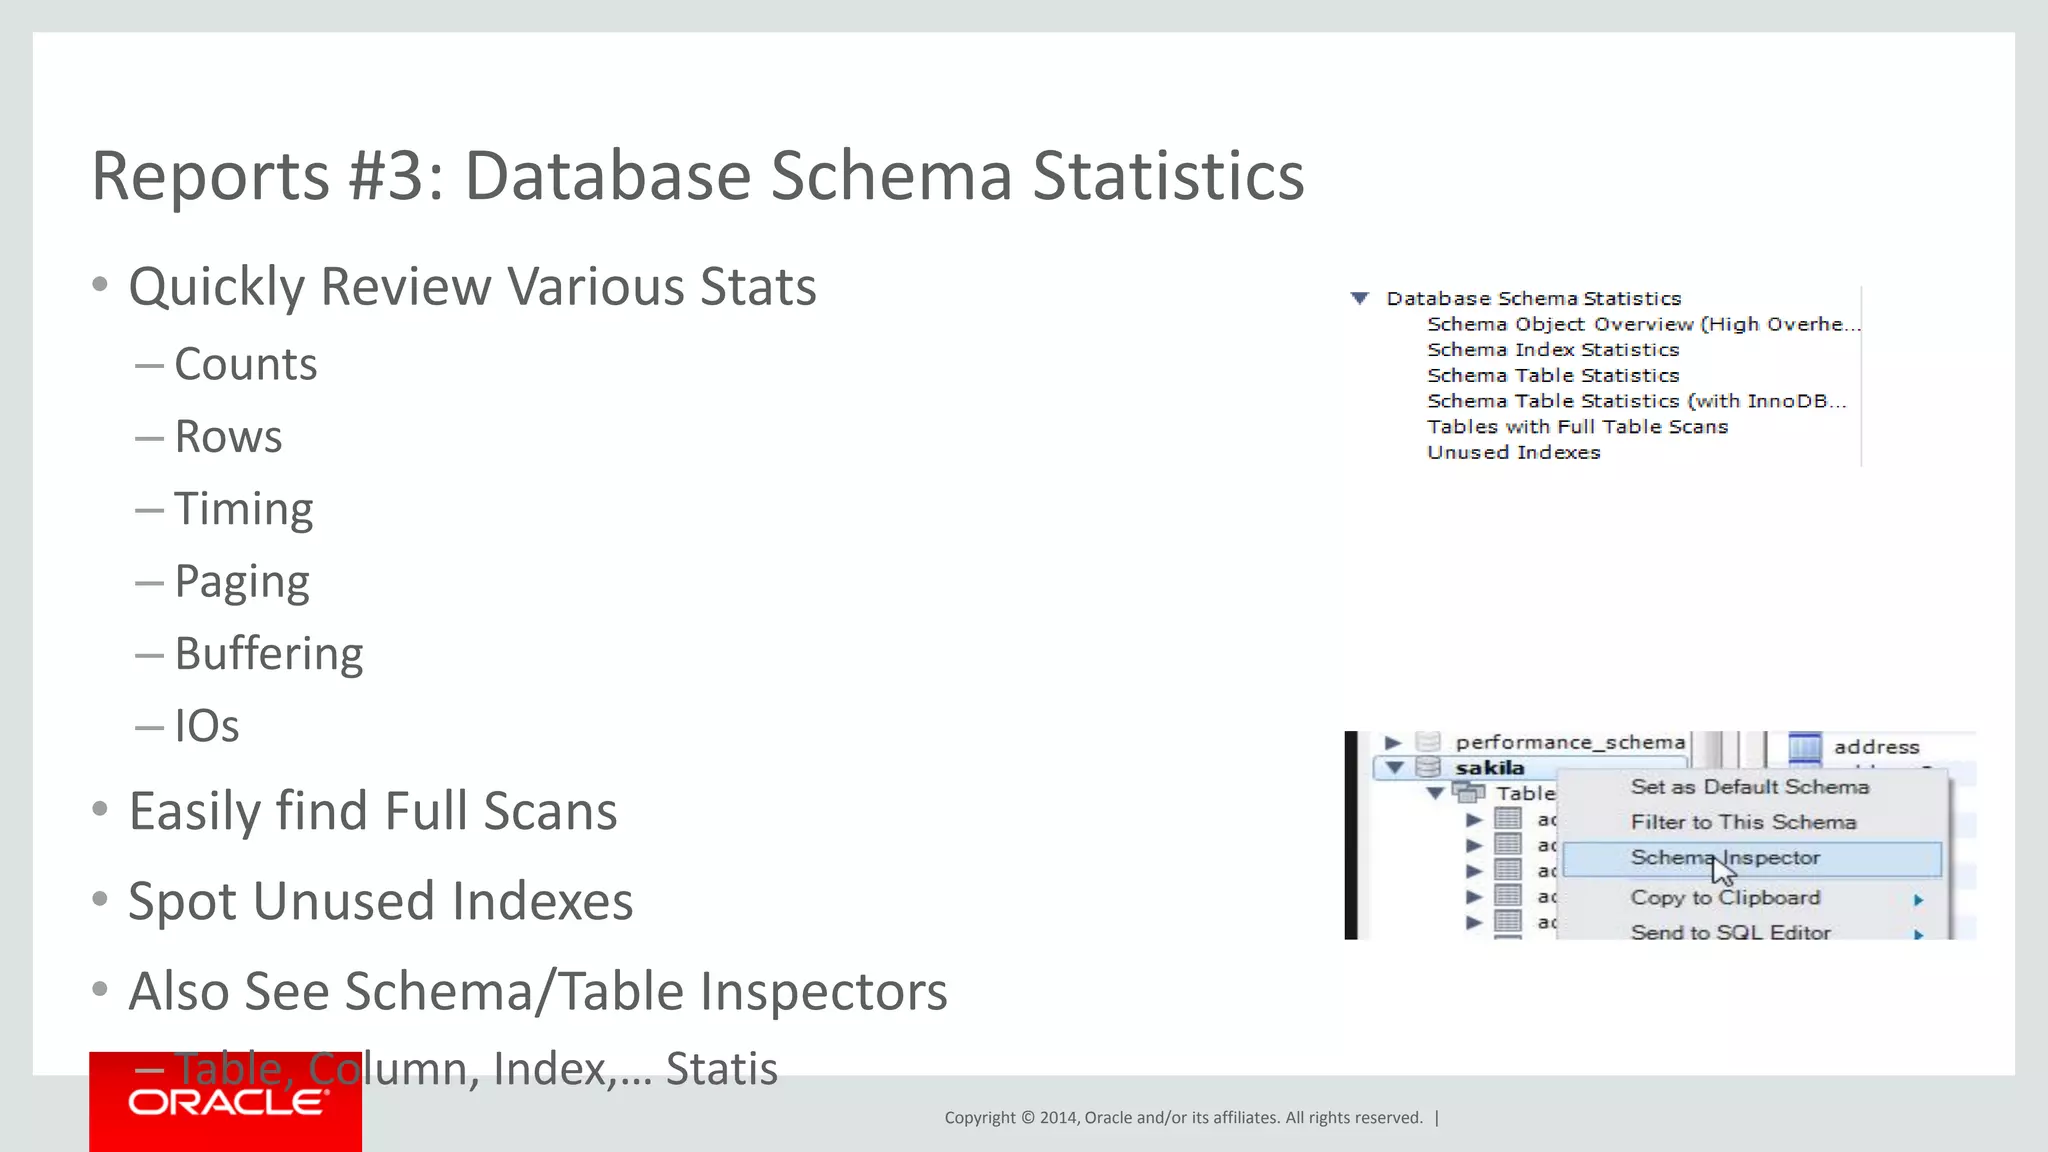
Copyright © 2014, Oracle and/or its affiliates. All rights reserved. |1
Mario Beck
MySQL Sales Consulting Manager EMEA
mario.beck@oracle.com
Performance Schema & SYS schema
Copyright © 2014, Oracle and/or its affiliates. All rights reserved. |2
Program Agenda
What is Performance Schema?
Profiling Examples
Improvements made to date in MySQL 5.7
The MySQL SYS Schema
Easy to Use with MySQL Workbench
Copyright © 2014, Oracle and/or its affiliates. All rights reserved. |3
What is Performance Schema?
Copyright © 2014, Oracle and/or its affiliates. All rights reserved. |4
What is Performance Schema anyway?
A storage engine, built for recording instrumentation
– PERFORMANCE_SCHEMA
A database schema to expose the instrumentation
– performance_schema
Records latency of events that happen within the server
All latency exposed to picosecond
Also tracks other information as appropriate
- Bytes, source position, object metadata, etc.
Copyright © 2014, Oracle and/or its affiliates. All rights reserved. |5
Performance Schema in MySQL 5.5
17 Tables
222 Instruments
Instrument Event Class
File IO wait/io/file/%
Mutexes wait/synch/mutex/%
Read/Write Locks wait/synch/rwlock/%
Conditions wait/synch/cond/%
Copyright © 2014, Oracle and/or its affiliates. All rights reserved. |6
Wait Events
mysql> select * from events_waits_history_long where
event_name like 'wait/io/table/%'G
*************************** 1. row ***************************
THREAD_ID: 137746
EVENT_ID: 3604
END_EVENT_ID: 3604
EVENT_NAME: wait/io/table/sql/handler
SOURCE: handler.cc:2568
TIMER_START: 17101711846046490
TIMER_END: 17101711857643010
TIMER_WAIT: 11596520
SPINS: NULL
OBJECT_SCHEMA: mem__events
OBJECT_NAME: events
INDEX_NAME: PRIMARY
OBJECT_TYPE: TABLE
OBJECT_INSTANCE_BEGIN: 140246283168288
NESTING_EVENT_ID: 3603
NESTING_EVENT_TYPE: STAGE
OPERATION: fetch
NUMBER_OF_BYTES: NULL
FLAGS: NULL
Event Context
Event type and origin
Timing (~11.5 microseconds)
Database object info
Object type
Whether the event was nested
Further info as appropriate
Copyright © 2014, Oracle and/or its affiliates. All rights reserved. |7
Performance Schema in MySQL 5.6
52 Tables (+35)
545 Instruments (+323)
Instrument Type Event Class
Statements statement/%
Stages stage/%
Table IO wait/io/table/%
Table Locks wait/lock/table/%
Network IO wait/io/socket/%
Idle Timing idle
Copyright © 2014, Oracle and/or its affiliates. All rights reserved. |8
Statement Events
mysql> select * from events_statements_history_long limit 1G
*************************** 1. row ***************************
THREAD_ID: 138683
EVENT_ID: 11268
END_EVENT_ID: 11295
EVENT_NAME: statement/sql/update
SOURCE: socket_connection.cc:94
TIMER_START: 87644080265364000
TIMER_END: 87644080504810000
TIMER_WAIT: 239446000
LOCK_TIME: 63000000
SQL_TEXT: /* mem dbpool.default */ update
`mem__inventory`.`Agent` set `hasHostname`=1400665852927,
`hasReachable`=1400665852927, `timestamp`=1400665852927,
`hasVersion`=1400665852927 where hid=x'FA8FDC4C1BC344A0899DAB320757CDF2'
DIGEST: cc389abfcb093ae95cacfe42ed085191
DIGEST_TEXT: UPDATE `mem__inventory` . `Agent` SET `hasHostname` = ?
, `hasReachable` = ? , `timestamp` = ? , `hasVersion` = ? WHERE `hid` = ?
CURRENT_SCHEMA: mem
OBJECT_TYPE: NULL
OBJECT_SCHEMA: NULL
OBJECT_NAME: NULL
OBJECT_INSTANCE_BEGIN: NULL
…………
MYSQL_ERRNO: 0
RETURNED_SQLSTATE: 00000
MESSAGE_TEXT: Rows matched: 1
ERRORS: 0
WARNINGS: 0
ROWS_AFFECTED: 1
ROWS_SENT: 0
ROWS_EXAMINED: 1
CREATED_TMP_DISK_TABLES: 0
CREATED_TMP_TABLES: 0
SELECT_FULL_JOIN: 0
SELECT_FULL_RANGE_JOIN: 0
SELECT_RANGE: 0
SELECT_RANGE_CHECK: 0
SELECT_SCAN: 0
SORT_MERGE_PASSES: 0
SORT_RANGE: 0
SORT_ROWS: 0
SORT_SCAN: 0
NO_INDEX_USED: 0
NO_GOOD_INDEX_USED: 0
NESTING_EVENT_ID: 11248
NESTING_EVENT_TYPE: TRANSACTION
NESTING_EVENT_LEVEL: 0
Copyright © 2014, Oracle and/or its affiliates. All rights reserved. |
Stored Programs
Transactions
9
Nested Events
Statements
Stages
Waits MySQL 5.5
MySQL 5.6
MySQL 5.7
mysql> select * from events_waits_history_long
******************** 1. row ********************
...
EVENT_NAME: wait/io/table/sql/handler
...
NESTING_EVENT_ID: 3603
NESTING_EVENT_TYPE: STAGE
Copyright © 2014, Oracle and/or its affiliates. All rights reserved. |1
0
Performance Schema Table Types
Setup Tables
Used to define certain
configuration
dynamically
Can perform DML
against these tables
mysql> select table_name
-> from information_schema.tables
-> where table_schema like 'perf%'
-> and table_name like 'setup%';
+-------------------+
| table_name |
+-------------------+
| setup_actors |
| setup_consumers |
| setup_instruments |
| setup_objects |
| setup_timers |
+-------------------+
Copyright © 2014, Oracle and/or its affiliates. All rights reserved. |1
1
Performance Schema Table Types
Raw Data Tables
Expose events, objects, or
instances of instruments in a
raw manner
Allow seeing a (brief) history
of raw event metrics as well
+-------------------------------------------+
| table_name |
+-------------------------------------------+
| accounts |
| cond_instances |
| events_stages_current |
| events_stages_history |
| events_stages_history_long |
| events_statements_current |
| events_statements_history |
| events_statements_history_long |
| events_waits_current |
| events_waits_history |
| events_waits_history_long |
| file_instances |
| host_cache |
| hosts |
| mutex_instances |
| performance_timers |
| rwlock_instances |
| session_account_connect_attrs |
| session_connect_attrs |
| socket_instances |
| threads |
| users |
+-------------------------------------------+
Copyright © 2014, Oracle and/or its affiliates. All rights reserved. |1
2
Performance Schema Table Types
Summary Tables
Summarise event
information over
multiple dimensions
Useful for longer term
monitoring of activity
+------------------------------------------------------+
| table_name |
+------------------------------------------------------+
| events_stages_summary_by_account_by_event_name |
| events_stages_summary_by_host_by_event_name |
| events_stages_summary_by_thread_by_event_name |
| events_stages_summary_by_user_by_event_name |
| events_stages_summary_global_by_event_name |
| events_statements_summary_by_account_by_event_name |
| events_statements_summary_by_digest |
| events_statements_summary_by_host_by_event_name |
| events_statements_summary_by_program |
| events_statements_summary_by_thread_by_event_name |
| events_statements_summary_by_user_by_event_name |
| events_statements_summary_global_by_event_name |
| events_waits_summary_by_account_by_event_name |
| events_waits_summary_by_host_by_event_name |
| events_waits_summary_by_instance |
| events_waits_summary_by_thread_by_event_name |
| events_waits_summary_by_user_by_event_name |
| events_waits_summary_global_by_event_name |
| file_summary_by_event_name |
| file_summary_by_instance |
| objects_summary_global_by_type |
| socket_summary_by_event_name |
| socket_summary_by_instance |
| table_io_waits_summary_by_index_usage |
| table_io_waits_summary_by_table |
| table_lock_waits_summary_by_table |
+------------------------------------------------------+
Copyright © 2014, Oracle and/or its affiliates. All rights reserved. |13
Performance Schema Configuration
Configure Description
Variables like “perf%” Fixed RAM allocation, fixed size
Status like “perf%lost” Lost events due to too low buffers
Table “setup_instruments” Turn on/off individual instruments
Table “setup_consumers” Configure history / summary tables
Table “setup_objects” Filter events by table/schema
Table “setup_actors” Filter events by user/host
Copyright © 2014, Oracle and/or its affiliates. All rights reserved. |1
4
Profiling Examples
Copyright © 2014, Oracle and/or its affiliates. All rights reserved. |15
Analyzing Global Waits
Some mutex events that can affect global concurrency (if high in list):
 wait/synch/mutex/innodb/buf_pool_mutex
Increase innodb_buffer_pool_instances
 wait/synch/mutex/sql/Query_cache::structure_guard_mutex
 Look in to disabling the Query Cache
 wait/synch/mutex/myisam/MYISAM_SHARE::intern_lock
Use Innodb …
Copyright © 2014, Oracle and/or its affiliates. All rights reserved. |16
Analyzing Global Waits
Some File IO events to watch for (if high in list):
 wait/io/file/sql/FRM
Tune table_open_cache / table_definition_cache
 wait/io/file/sql/file_parser (view definition parsing)
 If high on 5.5, upgrade to 5.6, (which can cache these like tables)
 wait/io/file/sql/query_log and wait/io/file/sql/slow_log
Disable the general
Disable or tune what is logged to the slow log (decent long_query_time)
Copyright © 2014, Oracle and/or its affiliates. All rights reserved. |17
Slave SQL Load Average
Watch wait/synch/cond/sql/MYSQL_RELAY_LOG::update_cond
http://www.markleith.co.uk/2012/07/24/a-mysql-replication-load-average-with-performance-schema/
Copyright © 2014, Oracle and/or its affiliates. All rights reserved. |18
Currently Executing Statements
SELECT_FULL_JOIN: 0
SELECT_FULL_RANGE_JOIN: 0
SELECT_RANGE: 1
SELECT_RANGE_CHECK: 0
SELECT_SCAN: 0
SORT_MERGE_PASSES: 0
SORT_RANGE: 0
SORT_ROWS: 0
SORT_SCAN: 0
NO_INDEX_USED: 0
NO_GOOD_INDEX_USED: 0
NESTING_EVENT_ID: NULL
NESTING_EVENT_TYPE: NULL
NESTING_EVENT_LEVEL: 0
mysql> select * from events_statements_current where timer_end is nullG
*************************** 8. row ***************************
THREAD_ID: 156945
EVENT_ID: 15312
END_EVENT_ID: NULL
EVENT_NAME: statement/sql/select
SOURCE: socket_connection.cc:94
TIMER_START: 99343994725205000
TIMER_END: NULL
TIMER_WAIT: NULL
LOCK_TIME: 145000000
SQL_TEXT: /* mem dbpool.ui */ select normalized0_.round_robin_bin as round1_1256_, /* ..snip .. */
DIGEST: NULL
DIGEST_TEXT: NULL
CURRENT_SCHEMA: mem
OBJECT_TYPE: NULL
OBJECT_SCHEMA: NULL
OBJECT_NAME: NULL
OBJECT_INSTANCE_BEGIN: NULL
MYSQL_ERRNO: 0
RETURNED_SQLSTATE: NULL
MESSAGE_TEXT: NULL
ERRORS: 0
WARNINGS: 0
ROWS_AFFECTED: 0
ROWS_SENT: 27
ROWS_EXAMINED: 0
CREATED_TMP_DISK_TABLES: 0
CREATED_TMP_TABLES: 0
All counters are live, and
increment whilst the statements
execute
Copyright © 2014, Oracle and/or its affiliates. All rights reserved. |1
9
Improvements made to date in
MySQL 5.7
Copyright © 2014, Oracle and/or its affiliates. All rights reserved. |
Insert Picture Here
20
Memory Usage
Metadata Locking
Replication Configuration & Status
Prepared Statements
Transactions
Stored Programs
Copyright © 2014, Oracle and/or its affiliates. All rights reserved. |2
1
Instrument memory usage - thread details
mysql> SELECT event_name,
-> sys.format_bytes(current_number_of_bytes_used) AS current_used
-> FROM performance_schema.memory_summary_by_thread_by_event_name
-> WHERE thread_id = 24
-> ORDER BY current_number_of_bytes_used DESC;
+-----------------------------------------------------+--------------+
| event_name | current_used |
+-----------------------------------------------------+--------------+
| memory/sql/Filesort_buffer::sort_keys | 255.94 KiB |
| memory/sql/sp_head::main_mem_root | 103.64 KiB |
| memory/mysys/IO_CACHE | 64.05 KiB |
| memory/mysys/lf_dynarray | 46.17 KiB |
| memory/mysys/array_buffer | 24.20 KiB |
| memory/sql/thd::main_mem_root | 23.95 KiB |
| memory/sql/String::value | 16.13 KiB |
| memory/sql/TABLE | 9.44 KiB |
| memory/sql/TABLE_SHARE::mem_root | 8.70 KiB |
| memory/myisam/MI_INFO | 7.07 KiB |
| memory/sql/THD::transactions::mem_root | 4.02 KiB |
Copyright © 2014, Oracle and/or its affiliates. All rights reserved. |2
2
The MySQL SYS Schema
Copyright © 2014, Oracle and/or its affiliates. All rights reserved. |23
MySQL SYS Schema Overview
Originally called “ps_helper”
Started as a collection of views, procedures and functions, designed to
make reading raw Performance Schema data easier
Implements many of the common DBA and Developer use cases,
including many of those shown already
Now bundled within MySQL Workbench 6.1
Available on GitHub
https://github.com/MarkLeith/mysql-sys
Copyright © 2014, Oracle and/or its affiliates. All rights reserved. |2
4
User Summary Views
High level user overview
Breakdowns of IO usage
Drill in to stages per user
Drill in to statement details per user
mysql> show tables like 'user%';
+-----------------------------------+
| Tables_in_sys (user%) |
+-----------------------------------+
| user_summary |
| user_summary_by_file_io |
| user_summary_by_file_io_type |
| user_summary_by_stages |
| user_summary_by_statement_latency |
| user_summary_by_statement_type |
+-----------------------------------+
Copyright © 2014, Oracle and/or its affiliates. All rights reserved. |2
5
IO Summary Views
IO breakdown by thread
Global summaries
by file and wait class,
by both bytes and latency
Stream of last raw file IO stats
mysql> show tables like 'io_%';
+------------------------------+
| Tables_in_sys (io_%) |
+------------------------------+
| io_by_thread_by_latency |
| io_global_by_file_by_bytes |
| io_global_by_file_by_latency |
| io_global_by_wait_by_bytes |
| io_global_by_wait_by_latency |
| latest_file_io |
+------------------------------+
Copyright © 2014, Oracle and/or its affiliates. All rights reserved. |2
6
Schema Analysis Views
Object overview
Table usage stats
Index usage stats
mysql> show tables like 'schema%';
+-------------------------------------+
| Tables_in_sys (schema%) |
+-------------------------------------+
| schema_index_statistics |
| schema_object_overview |
| schema_table_statistics |
| schema_table_statistics_with_buffer |
| schema_tables_with_full_table_scans |
| schema_unused_indexes |
+-------------------------------------+
Copyright © 2014, Oracle and/or its affiliates. All rights reserved. |2
7
InnoDB Buffer Usage Views
Buffer usage by schema
Buffer usage by table
mysql> show tables like 'innodb%';
+-------------------------------+
| Tables_in_sys (innodb%) |
+-------------------------------+
| innodb_buffer_stats_by_schema |
| innodb_buffer_stats_by_table |
+-------------------------------+
Copyright © 2014, Oracle and/or its affiliates. All rights reserved. |2
8
Statement Analysis Views
Statement overview
Find statements by errors, full scans,
sorting, temporary tables
Find the statements with the longest
runtimes
mysql> show tables like 'statement%';
+---------------------------------------------+
| Tables_in_sys (statement%) |
+---------------------------------------------+
| statement_analysis |
| statements_with_errors_or_warnings |
| statements_with_full_table_scans |
| statements_with_runtimes_in_95th_percentile |
| statements_with_sorting |
| statements_with_temp_tables |
+---------------------------------------------+
Copyright © 2014, Oracle and/or its affiliates. All rights reserved. |2
9
Wait summaries by class
and per instrument
globally
Wait details per user
mysql> show tables like 'wait%';
+------------------------------------+
| Tables_in_sys (wait%) |
+------------------------------------+
| wait_classes_global_by_avg_latency |
| wait_classes_global_by_latency |
| waits_by_user_by_latency |
| waits_global_by_latency |
+------------------------------------+
Wait Analysis Views
Copyright © 2014, Oracle and/or its affiliates. All rights reserved. |3
0
Easy to use with MySQL Workbench
Copyright © 2014, Oracle and/or its affiliates. All rights reserved. |
MySQL Workbench Overview
Design, Develop, Administer, Migrate
And now adding – Performance
• MySQL Database IDE
• Millions of Users
• Millions of Downloads
• Windows, OS X, Linux
Copyright © 2014, Oracle and/or its affiliates. All rights reserved. |
Performance Schema Reports
• Connect
• (DB Click or Open and Connect)
• Go to Management Tab
• If needed (Bottom Left)
• Go to Performance Reports
• New Performance Section
Copyright © 2014, Oracle and/or its affiliates. All rights reserved. |
New Screen – Performance Schema Setup
YES – its on
NO – its off
Advanced –
for power users
Copyright © 2014, Oracle and/or its affiliates. All rights reserved. |
Open Settings
Before Running Performance Reports
Copyright © 2014, Oracle and/or its affiliates. All rights reserved. |
First Run – Install SYS Schema
Copyright © 2014, Oracle and/or its affiliates. All rights reserved. |
SYS now Added
• No Tables
• Only
• Views
• SPs
• Functions
• Operates on
• Performance Schema
• Information Schema
Copyright © 2014, Oracle and/or its affiliates. All rights reserved. |
sys.<table> versus sys.x$<table>
• Providing 2 options
• One is easy
• To read in a query
• Other (x$) is easier
• To compare
• To Export to spreadsheet
• To Graph
• To consume in code
Copyright © 2014, Oracle and/or its affiliates. All rights reserved. |
SYS - SPs and Functions
SPs Used to
simplify management
FUNCTIONS
Used for Formatting
and Simple Checks
Copyright © 2014, Oracle and/or its affiliates. All rights reserved. |
Many WB Performance Reports
• WB wrappers many SYS views
• If we’ve missed a needed report or view
• Let us know
• Happy to add more
• Even if not performance related
• Could go in an Inspector
Copyright © 2014, Oracle and/or its affiliates. All rights reserved. |
General Lay Out - Header
Title and Brief Description
Sortable Columns
Column Labels indicate Units
Copyright © 2014, Oracle and/or its affiliates. All rights reserved. |
General Lay Out – Footer
Copyright © 2014, Oracle and/or its affiliates. All rights reserved. |
Reports #1: IO Reports
• For
– Files, Event Categories, User/Thread
• Quickly
– View, Sort
– By #, Time, Reads, Writes, Percentages
• Look for Hot Spots
– Use to determine system requirements, tuning, etc.
Copyright © 2014, Oracle and/or its affiliates. All rights reserved. |
Reports #2: High Cost SQL Statements
• Look at query statements and statistics
• Look for Full Table Scans
• Frequency of execution
• Errors, Warnings
• Long Runtimes – Total, Max, Ave
• Large numbers of Rows – Total, Max, Ave
• Usage of Temp Tables
Copyright © 2014, Oracle and/or its affiliates. All rights reserved. |
Reports #3: Database Schema Statistics
• Quickly Review Various Stats
– Counts
– Rows
– Timing
– Paging
– Buffering
– IOs
• Easily find Full Scans
• Spot Unused Indexes
• Also See Schema/Table Inspectors
– Table, Column, Index,… Statis
Copyright © 2014, Oracle and/or its affiliates. All rights reserved. |
Reports #5: Wait Event Times (For Experts)
• Wait Event Analysis is Complex
• However for power expert users
– These reports show collected data
– Show the queries used to collect
– Provides Statistics
– Breaks out events by Users and Classes
Copyright © 2014, Oracle and/or its affiliates. All rights reserved. |
Reports #6: InnoDB Statistics
• Quick views
– Aggregated
• By Schema
• By Table
– Easy to sort by
• Allocation, Data,
• Pages, Pages hashed, Old Pages
• Rows cached
Copyright © 2014, Oracle and/or its affiliates. All rights reserved. |
Quick Links
• Download:
–http://dev.mysql.com/downloads/tools/workbench/
• Bugs:
–http://bugs.mysql.com
• Forums:
–http://forums.mysql.com/index.php?151
Copyright © 2014, Oracle and/or its affiliates. All rights reserved. |
Supporting Resources
• Oracle and MySQL
• MySQL
• MySQL Workbench
• Team Blog
–https://blogs.oracle.com/mysqlworkbench/
• MySQL Community Edition
• MySQL Enterprise Edition
• MySQL Blog, Twitter, Facebook
• Optimizer Blog
–http://oysteing.blogspot.co.uk/
MySQL's Performance Schema, SYS Schema and Workbench Integration

MySQL's Performance Schema, SYS Schema and Workbench Integration

  • 1.
    Copyright © 2014,Oracle and/or its affiliates. All rights reserved. |1 Mario Beck MySQL Sales Consulting Manager EMEA mario.beck@oracle.com Performance Schema & SYS schema
  • 2.
    Copyright © 2014,Oracle and/or its affiliates. All rights reserved. |2 Program Agenda What is Performance Schema? Profiling Examples Improvements made to date in MySQL 5.7 The MySQL SYS Schema Easy to Use with MySQL Workbench
  • 3.
    Copyright © 2014,Oracle and/or its affiliates. All rights reserved. |3 What is Performance Schema?
  • 4.
    Copyright © 2014,Oracle and/or its affiliates. All rights reserved. |4 What is Performance Schema anyway? A storage engine, built for recording instrumentation – PERFORMANCE_SCHEMA A database schema to expose the instrumentation – performance_schema Records latency of events that happen within the server All latency exposed to picosecond Also tracks other information as appropriate - Bytes, source position, object metadata, etc.
  • 5.
    Copyright © 2014,Oracle and/or its affiliates. All rights reserved. |5 Performance Schema in MySQL 5.5 17 Tables 222 Instruments Instrument Event Class File IO wait/io/file/% Mutexes wait/synch/mutex/% Read/Write Locks wait/synch/rwlock/% Conditions wait/synch/cond/%
  • 6.
    Copyright © 2014,Oracle and/or its affiliates. All rights reserved. |6 Wait Events mysql> select * from events_waits_history_long where event_name like 'wait/io/table/%'G *************************** 1. row *************************** THREAD_ID: 137746 EVENT_ID: 3604 END_EVENT_ID: 3604 EVENT_NAME: wait/io/table/sql/handler SOURCE: handler.cc:2568 TIMER_START: 17101711846046490 TIMER_END: 17101711857643010 TIMER_WAIT: 11596520 SPINS: NULL OBJECT_SCHEMA: mem__events OBJECT_NAME: events INDEX_NAME: PRIMARY OBJECT_TYPE: TABLE OBJECT_INSTANCE_BEGIN: 140246283168288 NESTING_EVENT_ID: 3603 NESTING_EVENT_TYPE: STAGE OPERATION: fetch NUMBER_OF_BYTES: NULL FLAGS: NULL Event Context Event type and origin Timing (~11.5 microseconds) Database object info Object type Whether the event was nested Further info as appropriate
  • 7.
    Copyright © 2014,Oracle and/or its affiliates. All rights reserved. |7 Performance Schema in MySQL 5.6 52 Tables (+35) 545 Instruments (+323) Instrument Type Event Class Statements statement/% Stages stage/% Table IO wait/io/table/% Table Locks wait/lock/table/% Network IO wait/io/socket/% Idle Timing idle
  • 8.
    Copyright © 2014,Oracle and/or its affiliates. All rights reserved. |8 Statement Events mysql> select * from events_statements_history_long limit 1G *************************** 1. row *************************** THREAD_ID: 138683 EVENT_ID: 11268 END_EVENT_ID: 11295 EVENT_NAME: statement/sql/update SOURCE: socket_connection.cc:94 TIMER_START: 87644080265364000 TIMER_END: 87644080504810000 TIMER_WAIT: 239446000 LOCK_TIME: 63000000 SQL_TEXT: /* mem dbpool.default */ update `mem__inventory`.`Agent` set `hasHostname`=1400665852927, `hasReachable`=1400665852927, `timestamp`=1400665852927, `hasVersion`=1400665852927 where hid=x'FA8FDC4C1BC344A0899DAB320757CDF2' DIGEST: cc389abfcb093ae95cacfe42ed085191 DIGEST_TEXT: UPDATE `mem__inventory` . `Agent` SET `hasHostname` = ? , `hasReachable` = ? , `timestamp` = ? , `hasVersion` = ? WHERE `hid` = ? CURRENT_SCHEMA: mem OBJECT_TYPE: NULL OBJECT_SCHEMA: NULL OBJECT_NAME: NULL OBJECT_INSTANCE_BEGIN: NULL ………… MYSQL_ERRNO: 0 RETURNED_SQLSTATE: 00000 MESSAGE_TEXT: Rows matched: 1 ERRORS: 0 WARNINGS: 0 ROWS_AFFECTED: 1 ROWS_SENT: 0 ROWS_EXAMINED: 1 CREATED_TMP_DISK_TABLES: 0 CREATED_TMP_TABLES: 0 SELECT_FULL_JOIN: 0 SELECT_FULL_RANGE_JOIN: 0 SELECT_RANGE: 0 SELECT_RANGE_CHECK: 0 SELECT_SCAN: 0 SORT_MERGE_PASSES: 0 SORT_RANGE: 0 SORT_ROWS: 0 SORT_SCAN: 0 NO_INDEX_USED: 0 NO_GOOD_INDEX_USED: 0 NESTING_EVENT_ID: 11248 NESTING_EVENT_TYPE: TRANSACTION NESTING_EVENT_LEVEL: 0
  • 9.
    Copyright © 2014,Oracle and/or its affiliates. All rights reserved. | Stored Programs Transactions 9 Nested Events Statements Stages Waits MySQL 5.5 MySQL 5.6 MySQL 5.7 mysql> select * from events_waits_history_long ******************** 1. row ******************** ... EVENT_NAME: wait/io/table/sql/handler ... NESTING_EVENT_ID: 3603 NESTING_EVENT_TYPE: STAGE
  • 10.
    Copyright © 2014,Oracle and/or its affiliates. All rights reserved. |1 0 Performance Schema Table Types Setup Tables Used to define certain configuration dynamically Can perform DML against these tables mysql> select table_name -> from information_schema.tables -> where table_schema like 'perf%' -> and table_name like 'setup%'; +-------------------+ | table_name | +-------------------+ | setup_actors | | setup_consumers | | setup_instruments | | setup_objects | | setup_timers | +-------------------+
  • 11.
    Copyright © 2014,Oracle and/or its affiliates. All rights reserved. |1 1 Performance Schema Table Types Raw Data Tables Expose events, objects, or instances of instruments in a raw manner Allow seeing a (brief) history of raw event metrics as well +-------------------------------------------+ | table_name | +-------------------------------------------+ | accounts | | cond_instances | | events_stages_current | | events_stages_history | | events_stages_history_long | | events_statements_current | | events_statements_history | | events_statements_history_long | | events_waits_current | | events_waits_history | | events_waits_history_long | | file_instances | | host_cache | | hosts | | mutex_instances | | performance_timers | | rwlock_instances | | session_account_connect_attrs | | session_connect_attrs | | socket_instances | | threads | | users | +-------------------------------------------+
  • 12.
    Copyright © 2014,Oracle and/or its affiliates. All rights reserved. |1 2 Performance Schema Table Types Summary Tables Summarise event information over multiple dimensions Useful for longer term monitoring of activity +------------------------------------------------------+ | table_name | +------------------------------------------------------+ | events_stages_summary_by_account_by_event_name | | events_stages_summary_by_host_by_event_name | | events_stages_summary_by_thread_by_event_name | | events_stages_summary_by_user_by_event_name | | events_stages_summary_global_by_event_name | | events_statements_summary_by_account_by_event_name | | events_statements_summary_by_digest | | events_statements_summary_by_host_by_event_name | | events_statements_summary_by_program | | events_statements_summary_by_thread_by_event_name | | events_statements_summary_by_user_by_event_name | | events_statements_summary_global_by_event_name | | events_waits_summary_by_account_by_event_name | | events_waits_summary_by_host_by_event_name | | events_waits_summary_by_instance | | events_waits_summary_by_thread_by_event_name | | events_waits_summary_by_user_by_event_name | | events_waits_summary_global_by_event_name | | file_summary_by_event_name | | file_summary_by_instance | | objects_summary_global_by_type | | socket_summary_by_event_name | | socket_summary_by_instance | | table_io_waits_summary_by_index_usage | | table_io_waits_summary_by_table | | table_lock_waits_summary_by_table | +------------------------------------------------------+
  • 13.
    Copyright © 2014,Oracle and/or its affiliates. All rights reserved. |13 Performance Schema Configuration Configure Description Variables like “perf%” Fixed RAM allocation, fixed size Status like “perf%lost” Lost events due to too low buffers Table “setup_instruments” Turn on/off individual instruments Table “setup_consumers” Configure history / summary tables Table “setup_objects” Filter events by table/schema Table “setup_actors” Filter events by user/host
  • 14.
    Copyright © 2014,Oracle and/or its affiliates. All rights reserved. |1 4 Profiling Examples
  • 15.
    Copyright © 2014,Oracle and/or its affiliates. All rights reserved. |15 Analyzing Global Waits Some mutex events that can affect global concurrency (if high in list):  wait/synch/mutex/innodb/buf_pool_mutex Increase innodb_buffer_pool_instances  wait/synch/mutex/sql/Query_cache::structure_guard_mutex  Look in to disabling the Query Cache  wait/synch/mutex/myisam/MYISAM_SHARE::intern_lock Use Innodb …
  • 16.
    Copyright © 2014,Oracle and/or its affiliates. All rights reserved. |16 Analyzing Global Waits Some File IO events to watch for (if high in list):  wait/io/file/sql/FRM Tune table_open_cache / table_definition_cache  wait/io/file/sql/file_parser (view definition parsing)  If high on 5.5, upgrade to 5.6, (which can cache these like tables)  wait/io/file/sql/query_log and wait/io/file/sql/slow_log Disable the general Disable or tune what is logged to the slow log (decent long_query_time)
  • 17.
    Copyright © 2014,Oracle and/or its affiliates. All rights reserved. |17 Slave SQL Load Average Watch wait/synch/cond/sql/MYSQL_RELAY_LOG::update_cond http://www.markleith.co.uk/2012/07/24/a-mysql-replication-load-average-with-performance-schema/
  • 18.
    Copyright © 2014,Oracle and/or its affiliates. All rights reserved. |18 Currently Executing Statements SELECT_FULL_JOIN: 0 SELECT_FULL_RANGE_JOIN: 0 SELECT_RANGE: 1 SELECT_RANGE_CHECK: 0 SELECT_SCAN: 0 SORT_MERGE_PASSES: 0 SORT_RANGE: 0 SORT_ROWS: 0 SORT_SCAN: 0 NO_INDEX_USED: 0 NO_GOOD_INDEX_USED: 0 NESTING_EVENT_ID: NULL NESTING_EVENT_TYPE: NULL NESTING_EVENT_LEVEL: 0 mysql> select * from events_statements_current where timer_end is nullG *************************** 8. row *************************** THREAD_ID: 156945 EVENT_ID: 15312 END_EVENT_ID: NULL EVENT_NAME: statement/sql/select SOURCE: socket_connection.cc:94 TIMER_START: 99343994725205000 TIMER_END: NULL TIMER_WAIT: NULL LOCK_TIME: 145000000 SQL_TEXT: /* mem dbpool.ui */ select normalized0_.round_robin_bin as round1_1256_, /* ..snip .. */ DIGEST: NULL DIGEST_TEXT: NULL CURRENT_SCHEMA: mem OBJECT_TYPE: NULL OBJECT_SCHEMA: NULL OBJECT_NAME: NULL OBJECT_INSTANCE_BEGIN: NULL MYSQL_ERRNO: 0 RETURNED_SQLSTATE: NULL MESSAGE_TEXT: NULL ERRORS: 0 WARNINGS: 0 ROWS_AFFECTED: 0 ROWS_SENT: 27 ROWS_EXAMINED: 0 CREATED_TMP_DISK_TABLES: 0 CREATED_TMP_TABLES: 0 All counters are live, and increment whilst the statements execute
  • 19.
    Copyright © 2014,Oracle and/or its affiliates. All rights reserved. |1 9 Improvements made to date in MySQL 5.7
  • 20.
    Copyright © 2014,Oracle and/or its affiliates. All rights reserved. | Insert Picture Here 20 Memory Usage Metadata Locking Replication Configuration & Status Prepared Statements Transactions Stored Programs
  • 21.
    Copyright © 2014,Oracle and/or its affiliates. All rights reserved. |2 1 Instrument memory usage - thread details mysql> SELECT event_name, -> sys.format_bytes(current_number_of_bytes_used) AS current_used -> FROM performance_schema.memory_summary_by_thread_by_event_name -> WHERE thread_id = 24 -> ORDER BY current_number_of_bytes_used DESC; +-----------------------------------------------------+--------------+ | event_name | current_used | +-----------------------------------------------------+--------------+ | memory/sql/Filesort_buffer::sort_keys | 255.94 KiB | | memory/sql/sp_head::main_mem_root | 103.64 KiB | | memory/mysys/IO_CACHE | 64.05 KiB | | memory/mysys/lf_dynarray | 46.17 KiB | | memory/mysys/array_buffer | 24.20 KiB | | memory/sql/thd::main_mem_root | 23.95 KiB | | memory/sql/String::value | 16.13 KiB | | memory/sql/TABLE | 9.44 KiB | | memory/sql/TABLE_SHARE::mem_root | 8.70 KiB | | memory/myisam/MI_INFO | 7.07 KiB | | memory/sql/THD::transactions::mem_root | 4.02 KiB |
  • 22.
    Copyright © 2014,Oracle and/or its affiliates. All rights reserved. |2 2 The MySQL SYS Schema
  • 23.
    Copyright © 2014,Oracle and/or its affiliates. All rights reserved. |23 MySQL SYS Schema Overview Originally called “ps_helper” Started as a collection of views, procedures and functions, designed to make reading raw Performance Schema data easier Implements many of the common DBA and Developer use cases, including many of those shown already Now bundled within MySQL Workbench 6.1 Available on GitHub https://github.com/MarkLeith/mysql-sys
  • 24.
    Copyright © 2014,Oracle and/or its affiliates. All rights reserved. |2 4 User Summary Views High level user overview Breakdowns of IO usage Drill in to stages per user Drill in to statement details per user mysql> show tables like 'user%'; +-----------------------------------+ | Tables_in_sys (user%) | +-----------------------------------+ | user_summary | | user_summary_by_file_io | | user_summary_by_file_io_type | | user_summary_by_stages | | user_summary_by_statement_latency | | user_summary_by_statement_type | +-----------------------------------+
  • 25.
    Copyright © 2014,Oracle and/or its affiliates. All rights reserved. |2 5 IO Summary Views IO breakdown by thread Global summaries by file and wait class, by both bytes and latency Stream of last raw file IO stats mysql> show tables like 'io_%'; +------------------------------+ | Tables_in_sys (io_%) | +------------------------------+ | io_by_thread_by_latency | | io_global_by_file_by_bytes | | io_global_by_file_by_latency | | io_global_by_wait_by_bytes | | io_global_by_wait_by_latency | | latest_file_io | +------------------------------+
  • 26.
    Copyright © 2014,Oracle and/or its affiliates. All rights reserved. |2 6 Schema Analysis Views Object overview Table usage stats Index usage stats mysql> show tables like 'schema%'; +-------------------------------------+ | Tables_in_sys (schema%) | +-------------------------------------+ | schema_index_statistics | | schema_object_overview | | schema_table_statistics | | schema_table_statistics_with_buffer | | schema_tables_with_full_table_scans | | schema_unused_indexes | +-------------------------------------+
  • 27.
    Copyright © 2014,Oracle and/or its affiliates. All rights reserved. |2 7 InnoDB Buffer Usage Views Buffer usage by schema Buffer usage by table mysql> show tables like 'innodb%'; +-------------------------------+ | Tables_in_sys (innodb%) | +-------------------------------+ | innodb_buffer_stats_by_schema | | innodb_buffer_stats_by_table | +-------------------------------+
  • 28.
    Copyright © 2014,Oracle and/or its affiliates. All rights reserved. |2 8 Statement Analysis Views Statement overview Find statements by errors, full scans, sorting, temporary tables Find the statements with the longest runtimes mysql> show tables like 'statement%'; +---------------------------------------------+ | Tables_in_sys (statement%) | +---------------------------------------------+ | statement_analysis | | statements_with_errors_or_warnings | | statements_with_full_table_scans | | statements_with_runtimes_in_95th_percentile | | statements_with_sorting | | statements_with_temp_tables | +---------------------------------------------+
  • 29.
    Copyright © 2014,Oracle and/or its affiliates. All rights reserved. |2 9 Wait summaries by class and per instrument globally Wait details per user mysql> show tables like 'wait%'; +------------------------------------+ | Tables_in_sys (wait%) | +------------------------------------+ | wait_classes_global_by_avg_latency | | wait_classes_global_by_latency | | waits_by_user_by_latency | | waits_global_by_latency | +------------------------------------+ Wait Analysis Views
  • 30.
    Copyright © 2014,Oracle and/or its affiliates. All rights reserved. |3 0 Easy to use with MySQL Workbench
  • 31.
    Copyright © 2014,Oracle and/or its affiliates. All rights reserved. | MySQL Workbench Overview Design, Develop, Administer, Migrate And now adding – Performance • MySQL Database IDE • Millions of Users • Millions of Downloads • Windows, OS X, Linux
  • 32.
    Copyright © 2014,Oracle and/or its affiliates. All rights reserved. | Performance Schema Reports • Connect • (DB Click or Open and Connect) • Go to Management Tab • If needed (Bottom Left) • Go to Performance Reports • New Performance Section
  • 33.
    Copyright © 2014,Oracle and/or its affiliates. All rights reserved. | New Screen – Performance Schema Setup YES – its on NO – its off Advanced – for power users
  • 34.
    Copyright © 2014,Oracle and/or its affiliates. All rights reserved. | Open Settings Before Running Performance Reports
  • 35.
    Copyright © 2014,Oracle and/or its affiliates. All rights reserved. | First Run – Install SYS Schema
  • 36.
    Copyright © 2014,Oracle and/or its affiliates. All rights reserved. | SYS now Added • No Tables • Only • Views • SPs • Functions • Operates on • Performance Schema • Information Schema
  • 37.
    Copyright © 2014,Oracle and/or its affiliates. All rights reserved. | sys.<table> versus sys.x$<table> • Providing 2 options • One is easy • To read in a query • Other (x$) is easier • To compare • To Export to spreadsheet • To Graph • To consume in code
  • 38.
    Copyright © 2014,Oracle and/or its affiliates. All rights reserved. | SYS - SPs and Functions SPs Used to simplify management FUNCTIONS Used for Formatting and Simple Checks
  • 39.
    Copyright © 2014,Oracle and/or its affiliates. All rights reserved. | Many WB Performance Reports • WB wrappers many SYS views • If we’ve missed a needed report or view • Let us know • Happy to add more • Even if not performance related • Could go in an Inspector
  • 40.
    Copyright © 2014,Oracle and/or its affiliates. All rights reserved. | General Lay Out - Header Title and Brief Description Sortable Columns Column Labels indicate Units
  • 41.
    Copyright © 2014,Oracle and/or its affiliates. All rights reserved. | General Lay Out – Footer
  • 42.
    Copyright © 2014,Oracle and/or its affiliates. All rights reserved. | Reports #1: IO Reports • For – Files, Event Categories, User/Thread • Quickly – View, Sort – By #, Time, Reads, Writes, Percentages • Look for Hot Spots – Use to determine system requirements, tuning, etc.
  • 43.
    Copyright © 2014,Oracle and/or its affiliates. All rights reserved. | Reports #2: High Cost SQL Statements • Look at query statements and statistics • Look for Full Table Scans • Frequency of execution • Errors, Warnings • Long Runtimes – Total, Max, Ave • Large numbers of Rows – Total, Max, Ave • Usage of Temp Tables
  • 44.
    Copyright © 2014,Oracle and/or its affiliates. All rights reserved. | Reports #3: Database Schema Statistics • Quickly Review Various Stats – Counts – Rows – Timing – Paging – Buffering – IOs • Easily find Full Scans • Spot Unused Indexes • Also See Schema/Table Inspectors – Table, Column, Index,… Statis
  • 45.
    Copyright © 2014,Oracle and/or its affiliates. All rights reserved. | Reports #5: Wait Event Times (For Experts) • Wait Event Analysis is Complex • However for power expert users – These reports show collected data – Show the queries used to collect – Provides Statistics – Breaks out events by Users and Classes
  • 46.
    Copyright © 2014,Oracle and/or its affiliates. All rights reserved. | Reports #6: InnoDB Statistics • Quick views – Aggregated • By Schema • By Table – Easy to sort by • Allocation, Data, • Pages, Pages hashed, Old Pages • Rows cached
  • 47.
    Copyright © 2014,Oracle and/or its affiliates. All rights reserved. | Quick Links • Download: –http://dev.mysql.com/downloads/tools/workbench/ • Bugs: –http://bugs.mysql.com • Forums: –http://forums.mysql.com/index.php?151
  • 48.
    Copyright © 2014,Oracle and/or its affiliates. All rights reserved. | Supporting Resources • Oracle and MySQL • MySQL • MySQL Workbench • Team Blog –https://blogs.oracle.com/mysqlworkbench/ • MySQL Community Edition • MySQL Enterprise Edition • MySQL Blog, Twitter, Facebook • Optimizer Blog –http://oysteing.blogspot.co.uk/