Downloaded 36 times


![Copyright © 2019, Oracle and/or its affiliates. All rights reserved. |
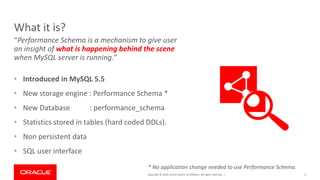
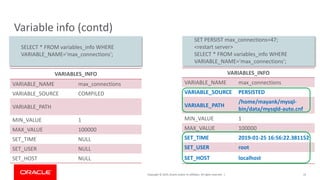
Variable info
• Gives information about the server variables.
• Source [COMMAND_LINE, COMPILED, EXPLICIT, PERSISTED etc.]
• Min/max value
• Who/When
32](https://image.slidesharecdn.com/mydbops2-190129153412/85/MySQL-Performance-Schema-in-MySQL-8-0-32-320.jpg)


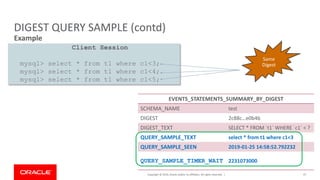
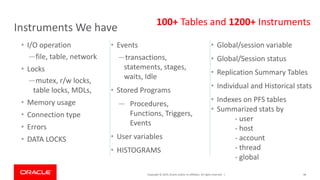
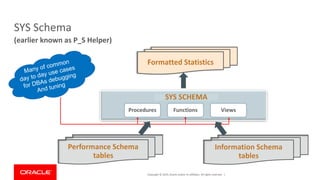


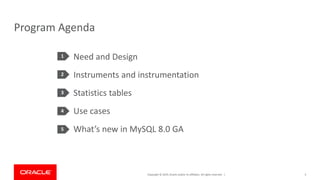
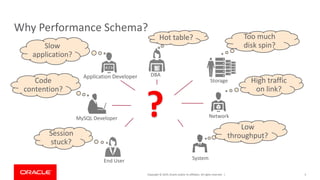
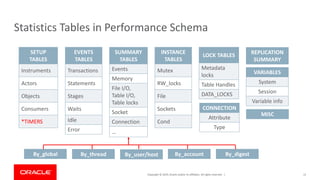
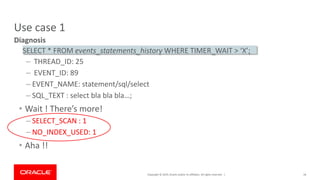
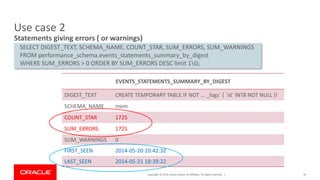
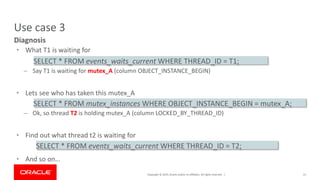
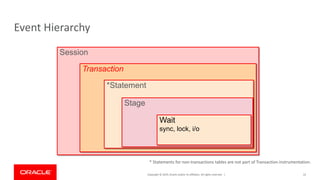
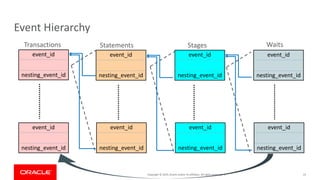
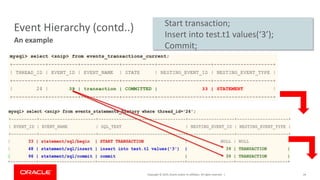
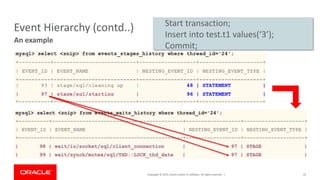
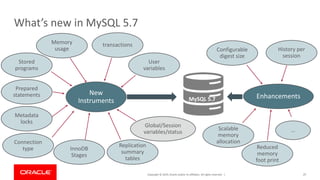
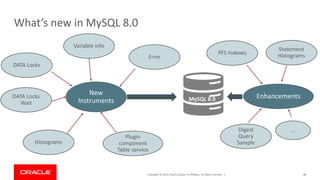
The document discusses the MySQL Performance Schema, which provides users insight into MySQL server execution and performance. It covers various aspects such as instruments, statistics tables, and use cases for identifying performance issues and errors. Additionally, it highlights enhancements in MySQL 5.7 and 8.0, including new instruments and improved error handling.