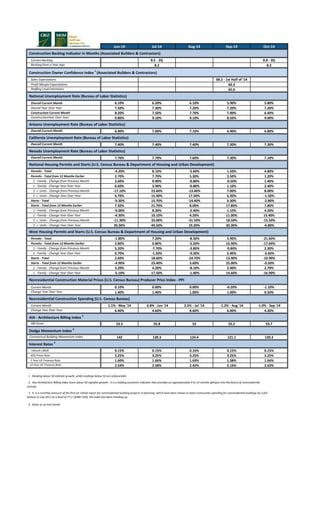
1. Jun-14 Jul-14 Aug-14 Sep-14 Oct-14
Current Backlog 8.5 - 2Q 8.8 - 3Q
Backlog from a Year Ago 8.2 8.2
Sales Expectations 68.2 - 1st Half of '14
Profit Margin Expectations 60.3
Staffing Level Intentions 65.0
Overall Current Month 6.10% 6.20% 6.10% 5.90% 5.80%
Overall Year Over Year 7.50% 7.30% 7.20% 7.20% 7.20%
Construction Current Month 8.20% 7.50% 7.70% 7.00% 6.40%
ConstructionYear Over Year 9.80% 9.10% 9.10% 8.50% 9.00%
Overall Current Month 6.90% 7.00% 7.10% 6.90% 6.80%
Overall Current Month 7.40% 7.40% 7.40% 7.30% 7.30%
Overall Current Month 7.70% 7.70% 7.60% 7.30% 7.10%
Permits - Total -4.20% 8.10% -5.60% 1.50% 4.80%
Permits - Total from 12 Months Earlier 2.70% 7.70% 5.30% 2.50% 1.20%
1 - Family - Change from Previous Month 2.60% 0.90% -0.80% -0.50% 1.40%
1 - Family - Change Year Over Year 0.60% 3.90% -0.80% 1.10% 2.40%
5 + Units - Change from Previous Month -17.10% 23.60% -13.40% 7.00% 8.00%
5 + Units - Change Year Over Year 6.70% 15.40% 17.50% 6.30% -1.50%
Starts - Total -9.30% 15.70% -14.40% 6.30% -2.80%
Starts - Total from 12 Months Earlier 7.50% 21.70% 8.00% 17.80% 7.80%
1 - Family - Change from Previous Month -9.00% 8.30% -2.40% 1.10% 4.20%
1 - Family - Change Year Over Year -4.30% 10.10% 4.20% 11.00% 15.40%
5 + Units - Change from Previous Month -11.30% 33.00% -31.50% 18.50% -15.50%
5 + Units - Change Year Over Year 39.30% 49.50% 19.20% 30.30% -6.80%
Permits - Total -1.80% 7.20% -8.30% 5.90% -21.60%
Permits - Total from 12 Months Earlier 2.80% 0.80% -5.20% 16.90% -17.60%
1 - Family - Change from Previous Month 5.20% -7.70% -3.80% -0.80% 2.30%
1 - Family - Change Year Over Year 0.70% -1.50% -9.20% 2.40% -3.60%
Starts - Total 2.60% 18.60% -24.70% 13.90% -10.90%
Starts - Total from 12 Months Earlier -4.90% 23.40% 3.60% 25.00% -0.50%
1 - Family - Change from Previous Month 3.20% 4.20% -8.10% 2.90% 2.70%
1 - Family - Change Year Over Year -5.10% 17.50% -1.40% 14.60% -16.90%
Current Month 0.10% 0.00% 0.00% -0.20% -1.10%
Change Year Over Year 1.40% 1.40% 1.00% 1.00% 0.50%
Current Month 1.1% - May '14 -2.8% - Jun '14 2.5% - Jul '14 -1.2% - Aug '14 -1.0% - Sep '14
Change Year Over Year 6.40% 4.60% 8.60% 6.00% 4.20%
ABI Score 53.5 55.8 53 55.2 53.7
Commerical Building Momentum Index 142 128.3 124.4 121.1 130.2
I-Month LIBOR 0.15% 0.15% 0.16% 0.15% 0.15%
WSJ Prime Rate 3.25% 3.25% 3.25% 3.25% 3.25%
5 Year US Treasury Rate 1.60% 1.66% 1.69% 1.38% 1.66%
10 Year US Treasury Rate 2.54% 2.58% 2.42% 2.16% 2.63%
Nonresidential Construction Spending (U.S. Census Bureau)
Interest Rates 4
AIA - Architecture Billing Index 2
Dodge Momentum Index 3
West Housing Permits and Starts (U.S. Census Bureau & Department of Housing and Urban Development)
Nonresidential Construction Material Prices (U.S. Census Bureau) Producer Price Index - PPI
Arizona Unemployment Rate (Bureau of Labor Statistics)
National Unemployment Rate (Bureau of Labor Statistics)
Construction Owner Confidence Index 1
(Associated Builders & Contractors)
Construction Backlog Indicator in Months (Associated Builders & Contractors)
California Unemployment Rate (Bureau of Labor Statistics)
Nevada Unemployment Rate (Bureau of Labor Statistics)
National Housing Permits and Starts (U.S. Census Bureau & Department of Housing and Urban Development)
4 Rates as of mid month.
3 It is a monthly measure of the first (or initial) report for nonresidential building projects in planning, which have been shown to lead construction spending for nonresidential buildings by a full
bottom in July 2011 at a level of 77.1 (2000=100), the index has been trending up.
1 Reading above 50 indicate growth, while readings below 50 are unfavorable
2 Any Architecture Billing Index Score above 50 signifies growth - it is a leading economic indicator that provides an approximately 9 to 12 months glimpse into the future of nonresidential
activity.