Phoenix Construction Vital Stats - January
•
0 likes•150 views

Phoenix Construction Vital Stats - January

Recommended
Recommended
More Related Content
What's hot
What's hot (20)
Similar to Phoenix Construction Vital Stats - January
Similar to Phoenix Construction Vital Stats - January (12)
More from CBIZ & MHM Phoenix
More from CBIZ & MHM Phoenix (11)
Recently uploaded
Recently uploaded (20)
Phoenix Construction Vital Stats - January
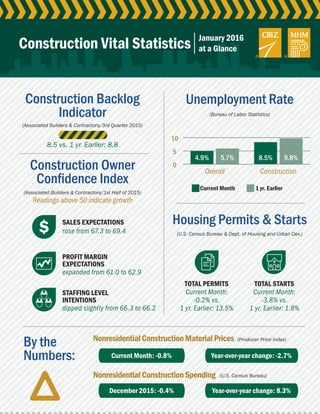
- 1. 0 5 10 Construction Backlog Indicator By the Numbers: Construction Owner Confidence Index Unemployment Rate Housing Permits & Starts (Bureau of Labor Statistics) (U.S. Census Bureau & Dept. of Housing and Urban Dev.) (Producer Price Index) (U.S. Census Bureau) (Associated Builders & Contractors/3rd Quarter 2015) (Associated Builders & Contractors/1st Half of 2015) Readings above 50 indicate growth NonresidentialConstructionMaterialPrices NonresidentialConstructionSpending Overall Current Month SALES EXPECTATIONS TOTAL PERMITS TOTAL STARTS PROFIT MARGIN EXPECTATIONS STAFFING LEVEL INTENTIONS 1 yr. Earlier Construction Construction Vital Statistics rose from 67.3 to 69.4 expanded from 61.0 to 62.9 dipped slightly from 66.3 to 66.2 Current Month: -0.2% vs. 1 yr. Earlier: 13.5% Current Month: -3.8% vs. 1 yr. Earlier: 1.8% 8.5 vs. 1 yr. Earlier: 8.8 January 2016 at a Glance Current Month: -0.8% Year-over-year change: -2.7% December 2015: -0.4% Year-over-year change: 8.3% 4.9% 5.7% 8.5% 9.8%
- 2. Reading above 50 indicate growth, while readings below 50 are unfavorable. Any Architecture Billing Index Score above 50 signifies growth - it is a leading economic indicator that provides an approximately nine to 12 month glimpse into the future of nonresidential construction spending activity. It is a monthly measure of the first (or initial) report for nonresidential building projects in planning, which have been shown to lead construction spending for nonresidential buildings by a full year. Since reaching bottom in July 2011 at a level of 77.1 (2000=100), the index has been trending up. Rates as of mid month. 1 2 3 www.cbiz.com/construction1-800-ASK-CBIZ | 4 January 2016 at a Glance Construction Backlog Indicator (Months) Current Backlog Backlog from a year ago (Associated Builders & Contractors) Construction Owner Confidence Index Sales Expectations Profit Margin Expectations Staffing Level Intentions (Associated Builders & Contractors) National Unemployment Rate Overall current month Overall year over year Construction current month Construction year over year (Bureau of Labor Statistics - BLS) National Housing Permits and Starts Permits - Total Permits - Total from twelve months earlier 1 - Family - change from previous month 1 - Family - change year over year 5 + Units - change from previous month 5 + Units - change year over year Starts - Total Starts - Total from twelve months earlier 1 - Family - change from previous month 1 - Family - change year over year 5 + Units - change from previous month 5 + Units - change year over year (U.S. Census Bureau & Dept. of Housing and Urban Dev.) Nonresidential Construction Material Prices Current Month Change year over year (Producer Price Index - PPI) Nonresidential Construction Spending Previous Month Change year over year (U.S. Census Bureau) AIA - Architecture Billing Index Dodge Momentum Index - Commercial Building Interest Rates I-Month LIBOR WSJ Prime Rate 5 Year US Treasury Rate 10 Year US Treasury Rate 8.5 8.5 Aug. ‘15 1 2 4 2nd Qtr. ‘15 3 Arizona Unemployment Rate California Unemployment Rate Nevada Unemployment Rate West Housing Permits and Starts Overall current month Overall current month Overall current month Permits - Total Permits - Total from twelve months earlier 1 - Family - change from previous month 1 - Family - change year over year Starts - Total Starts - Total from twelve months earlier 1 - Family - change from previous month 1 - Family - change year over year -9.9% 10.9% -1.3% 14.8% -3.1% 4.1% 16.6% 24.5% 5.1% 6.1% 6.1% 7.7% 6.0% 6.0% 6.6% 3.5% 12.5% 2.8% 8.7% 4.3% 21.5% -3.0% 16.6% -3.0% 14.9% -2.3% 24.5% 9.6% 36.4% 5.8% 28.1% -1.1% 28.2% -18.3% 7.3% -0.8% -4.7% 0.5% 12.7% 49.1 142.0 0.1968% 3.25% 1.61% 2.28% Sep. ‘15 69.4 62.9 66.2 1st 1/2 ‘15 5.1% 5.9% 5.5% 7.0% 5.9% 6.0% 6.6% -5.0% 4.7% -0.3% 6.7% -14.6% -1.3% 6.5% 17.5% 0.3% 12.0% 17.0% 28.6% -6.2% 15.7% -4.9% 19.1% 25.4% 27.5% 18.2% 19.0% -1.6% -6.0% 0.3% 12.3% 53.7 140.0 0.2011% 3.25% 1.34% 2.04% Oct. ‘15 5.0% 5.7% 6.2% 6.4% 5.9% 5.9% 6.5% -2.6% -7.0% 3.2% 19.3% -16.2% 14.5% 1.8% 8.2% 4.1% 2.7% 2.4% 9.0% 8.3% -7.1% -11.0% -1.8% -2.4% 2.4% -25.5% -8.4% -0.3% -5.1% -0.1% 12.4% 53.1 124.5 0.1945% 3.25% 1.66% 2.27% Nov. ‘15 8.5 8.8 3rd Qtr. ‘15 5.0% 5.8% 6.2% 7.5% 5.9% 5.9% 6.4% 11.0% 19.5% 1.1% 9.0% 30.8% 38.9% 10.5% 16.5% 7.6% 14.6% 18.1% 21.3% -0.5% -4.6% 1.0% 11.0% 49.3 118.8 0.2084% 3.25% 1.71% 2.28% -17.9% 9.2% -1.2% 11.8% -7.6% -14.7% -6.2% 10.4% Dec. ‘15 5.0% 5.6% 7.5% 8.3% -3.9% 14.4% 1.8% 8.0% -13.5% 23.6% -2.5% 6.4% -3.3% 6.1% -3.4% 8.6% -1.1% -4.0% -0.8% 10.2% 50.9 123.3 0.3584% 3.50% 1.46% 2.03% 5.9% 5.9% 6.3% Jan. ‘16 4.9% 5.7% 8.5% 9.8% -0.2% 13.5% -1.6% 9.6% 1.1% 17.9% -3.8% 1.8% -3.9% 3.5% -2.5% -3.8% -0.8% -2.7% -0.4% 8.3% 49.6 126.4 0.4255% 3.50% 1.23% 1.78% 24.5% 22.2% 1.8% 19.4% -0.4% -15.7% -10.0% -7.3% 5.6% 5.7% 6.2%