Construction industry vital stats report
•
0 likes•222 views

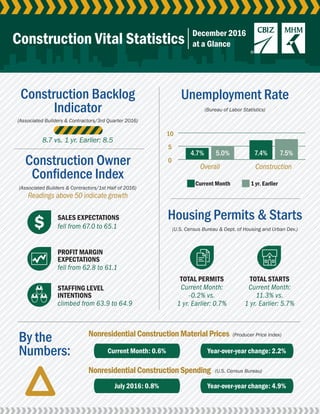
The backlog indicator is slightly higher, and the sales and profit margins expectations are slightly lowered compared to the same period in the previous year, but unemployment levels and total starts show signs of improvement.

Recommended
Recommended
More Related Content
What's hot
What's hot (20)
Viewers also liked
Viewers also liked (20)
Similar to Construction industry vital stats report
Similar to Construction industry vital stats report (14)
More from CBIZ, Inc.
More from CBIZ, Inc. (20)
Recently uploaded
Recently uploaded (20)
Construction industry vital stats report
- 1. 0 5 10 Construction Backlog Indicator By the Numbers: Construction Owner Confidence Index Unemployment Rate Housing Permits & Starts (Bureau of Labor Statistics) (U.S. Census Bureau & Dept. of Housing and Urban Dev.) (Producer Price Index) (U.S. Census Bureau) (Associated Builders & Contractors/3rd Quarter 2016) (Associated Builders & Contractors/1st Half of 2016) Readings above 50 indicate growth NonresidentialConstructionMaterialPrices NonresidentialConstructionSpending Overall Current Month SALES EXPECTATIONS TOTAL PERMITS TOTAL STARTS PROFIT MARGIN EXPECTATIONS STAFFING LEVEL INTENTIONS 1 yr. Earlier Construction Construction Vital Statistics fell from 67.0 to 65.1 fell from 62.8 to 61.1 climbed from 63.9 to 64.9 Current Month: -0.2% vs. 1 yr. Earlier: 0.7% Current Month: 11.3% vs. 1 yr. Earlier: 5.7% 8.7 vs. 1 yr. Earlier: 8.5 December 2016 at a Glance Current Month: 0.6% Year-over-year change: 2.2% July 2016: 0.8% Year-over-year change: 4.9% 4.7% 5.0% 7.4% 7.5%
- 2. www.cbiz.com/construction1-800-ASK-CBIZ | 1. Reading above 50 indicate growth, while readings below 50 are unfavorable. 2. Any Architecture Billing Index Score above 50 signifies growth - it is a leading economic indicator that provides an approximately nine to 12 month glimpse into the future of nonresidential construction spending activity. 3. It is a monthly measure of the first (or initial) report for nonresidential building projects in planning, which have been shown to lead construction spending for nonresidential buildings by a full year. Since reaching bottom in July 2011 at a level of 77.1 (2000=100), the index has been trending up. 4. Rates as of mid month. MHM (Mayer Hoffman McCann P.C.) is an independent CPA firm that provides audit, review and attest services, and works closely with CBIZ, a business consulting, tax and financial services provider. CBIZ and MHM are members of Kreston International Limited, a global network of independent accounting firms. Construction Backlog Indicator (Months) Current Backlog 8.5 8.7 Backlog from a year ago 8.5 8.5 (Associated Builders & Contractors) Construction Owner Confidence Index1 Sales Expectations 65.1 Profit Margin Expectations 61.1 Staffing Level Intentions 64.9 (Associated Builders & Contractors) National Unemployment Rate Overall current month 4.9% 4.9% 5.0% 4.9% 4.6% 4.7% Overall from twelve months earlier 5.3% 5.1% 5.1% 5.0% 5.0% 5.0% Construction current month 4.5% 5.1% 5.2% 5.7% 5.7% 7.4% Construction from twelve months earlier 5.5% 6.1% 5.5% 6.2% 6.2% 7.5% (Bureau of Labor Statistics - BLS) Housing Permits and Starts National Permits - Total -0.1% -0.4% 6.3% 0.3% -4.7% -0.2% Permits - Total from twelve months earlier 0.9% -2.3% 8.5% 4.6% -6.6% 0.7% 1 - Family - change from previous month -3.7% 3.7% 0.4% 2.7% 0.5% 4.7% 1 - Family - change year over year 2.4% 3.8% 4.4% 5.1% 5.9% 10.7% 5 + Units - change from previous month 6.5% -8.4% 17.2% -1.8% -15.8% -10.1% 5 + Units - change year over year -1.7% -13.1% 17.2% 5.8% -26.4% -17.1% Starts - Total 2.1% -5.8% -9.0% 25.5% -18.7% 11.3% Starts - Total from twelve months earlier 5.6% 0.9% -11.9% 23.3% -6.9% 5.7% 1 - Family - change from previous month 0.5% -6.0% 8.1% 10.7% -4.1% -4.0% 1 - Family - change year over year 1.3% -1.2% 5.4% 21.7% 5.3% 3.9% 5 + Units - change from previous month 8.3% -6.9% -38.9% 74.5% -43.9% 53.9% 5 + Units - change year over year 15.2% 2.3% -42.5% 28.2% -36.0% 10.3% (U.S. Census Bureau & Dept. of Housing and Urban Dev.) Nonresidential Construction Material Prices Current Month 1.2% -0.2% 0.3% 0.1% -0.7% 0.6% Change year over year -2.3% -1.7% 0.2% 0.6% 0.4% 2.2% (Producer Price Index - PPI) Nonresidential Construction Spending Previous Month -1.0% -0.3% -1.1% -0.9% -0.3% 0.8% Change year over year -1.1% 1.4% -1.3% -0.7% 2.6% 4.9% (U.S. Census Bureau) AIA - Architecture Billing Index2 51.5 49.7 48.4 50.8 50.6 55.9 Dodge Momentum Index - Commercial Building3 143.5 140.6 134.6 143.1 149.0 157.5 Interest Rates4 I-Month LIBOR 0.4829% 0.5128% 0.5270% 0.5308% 0.5308% 0.7164% WSJ Prime Rate 3.50% 3.50% 3.50% 3.50% 3.50% 3.75% 5 Year US Treasury Rate 1.14% 1.20% 1.26% 1.68% 2.10% 1.90% 10 Year US Treasury Rate 1.55% 1.71% 1.77% 2.23% 2.42% 2.40% Jul. ‘16 Aug. ‘16 Sept. ‘16 Oct. ‘16 Nov’16 Dec. 16 3rd Qtr. ‘16 December 2016 at a Glance 2nd Qtr. ‘16 1st 1/2 ‘16