Construction Vital Statistics - November 2015
•
0 likes•592 views

The latest construction industry vital statistics for November 2015. Learn about all of the Construction trends from Unemployment to Starts and Permits.

Recommended
Recommended
More Related Content
What's hot
What's hot (20)
Viewers also liked
Viewers also liked (18)
Similar to Construction Vital Statistics - November 2015
Similar to Construction Vital Statistics - November 2015 (17)
More from CBIZ, Inc.
More from CBIZ, Inc. (20)
Recently uploaded
Recently uploaded (20)
Construction Vital Statistics - November 2015
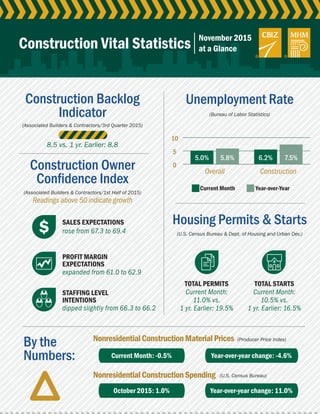
- 1. 0 5 10 Construction Backlog Indicator By the Numbers: Construction Owner Confidence Index Unemployment Rate Housing Permits & Starts (Bureau of Labor Statistics) (U.S. Census Bureau & Dept. of Housing and Urban Dev.) (Producer Price Index) (U.S. Census Bureau) (Associated Builders & Contractors/3rd Quarter 2015) (Associated Builders & Contractors/1st Half of 2015) Readings above 50 indicate growth NonresidentialConstructionMaterialPrices NonresidentialConstructionSpending Overall Current Month SALES EXPECTATIONS TOTAL PERMITS TOTAL STARTS PROFIT MARGIN EXPECTATIONS STAFFING LEVEL INTENTIONS Year-over-Year Construction Construction Vital Statistics rose from 67.3 to 69.4 expanded from 61.0 to 62.9 dipped slightly from 66.3 to 66.2 Current Month: 11.0% vs. 1 yr. Earlier: 19.5% Current Month: 10.5% vs. 1 yr. Earlier: 16.5% 8.5 vs. 1 yr. Earlier: 8.8 November 2015 at a Glance Current Month: -0.5% Year-over-year change: -4.6% October 2015: 1.0% Year-over-year change: 11.0% 5.0% 5.8% 6.2% 7.5%
- 2. www.cbiz.com/construction1-800-ASK-CBIZ | 1. Reading above 50 indicate growth, while readings below 50 are unfavorable. 2. Any Architecture Billing Index Score above 50 signifies growth - it is a leading economic indicator that provides an approximately nine to 12 month glimpse into the future of nonresidential construction spending activity. 3. It is a monthly measure of the first (or initial) report for nonresidential building projects in planning, which have been shown to lead construction spending for nonresidential buildings by a full year. Since reaching bottom in July 2011 at a level of 77.1 (2000=100), the index has been trending up. 4. Rates as of mid month. Construction Backlog Indicator (Months) Current Backlog 8.4 8.5 8.5 Backlog from a year ago 8.1 8.5 8.8 (Associated Builders & Contractors) Construction Owner Confidence Index1 Sales Expectations 67.3 69.4 Profit Margin Expectations 61.0 62.9 Staffing Level Intentions 66.3 66.2 (Associated Builders & Contractors) National Unemployment Rate Overall current month 5.3% 5.3% 5.1% 5.1% 5.0% 5.0% Overall year over year 6.1% 6.2% 6.1% 5.9% 5.7% 5.8% Construction current month 6.3% 5.5% 6.1% 5.5% 6.2% 6.2% Construction year over year 8.2% 7.5% 7.0% 7.0% 6.4% 7.5% (Bureau of Labor Statistics - BLS) Housing Permits and Starts National Permits - Total 7.4% -16.3% 3.5% -5.0% 4.1% 11.0% Permits - Total from twelve months earlier 30.0% 7.5% 12.5% 4.7% 2.7% 19.5% 1 - Family - change from previous month 0.9% -1.9% 2.8% -0.3% 2.4% 1.1% 1 - Family - change year over year 6.0% 6.1% 8.7% 6.7% 9.0% 9.0% 5 + Units - change from previous month 16.1% -32.6% 4.3% -14.6% 8.3% 30.8% 5 + Units - change year over year 79.0% 11.1% 21.5% -1.3% -7.1% 38.9% Starts - Total 9.8% 0.2% -3.0% 6.5% -11.0% 10.5% Starts - Total from twelve months earlier 26.6% 10.1% 16.6% 17.5% -1.8% 16.5% 1 - Family - change from previous month -0.9% 12.8% -3.0% 0.3% -2.4% 7.6% 1 - Family - change year over year 14.7% 19.0% 14.9% 12.0% 2.4% 14.6% 5 + Units - change from previous month 28.6% -17.1% -2.3% 17.0% -25.5% 18.1% 5 + Units - change year over year 55.0% -2.1% 24.5% 28.6% -8.4% 21.3% (U.S. Census Bureau & Dept. of Housing and Urban Dev.) Nonresidential Construction Material Prices Current Month 0.3% -0.3% -0.8% -1.6% -0.3% -0.5% Change year over year -3.6% -3.9% -4.7% -6.0% -5.1% -4.6% (Producer Price Index - PPI) Nonresidential Construction Spending Previous Month 1.1% 0.0% 0.5% 0.3% -0.1% 1.0% Change year over year 8.1% 11.5% 12.7% 12.3% 12.4% 11.0% (U.S. Census Bureau) AIA - Architecture Billing Index2 55.7 54.7 49.1 53.7 53.1 49.3 Dodge Momentum Index - Commercial Building3 126.1 132.1 142.0 140.0 124.5 119.9 Interest Rates4 I-Month LIBOR 0.1859% 0.1882% 0.1968% 0.2011% 0.1945% 0.2084% WSJ Prime Rate 3.25% 3.25% 3.25% 3.25% 3.25% 3.25% 5 Year US Treasury Rate 1.63% 1.58% 1.61% 1.34% 1.66% 1.71% 10 Year US Treasury Rate 2.36% 2.16% 2.28% 2.04% 2.27% 2.28% Jun. ‘15 Jul. ‘15 Aug. ‘15 Sep. ‘15 Oct. ‘15 Nov. ‘15 1st Qtr. ‘15 2nd Qtr. ‘15 2nd 1/2 ‘14 1st 1/2 ‘15 November 2015 at a Glance 3rd Qtr. ‘15