Download to read offline

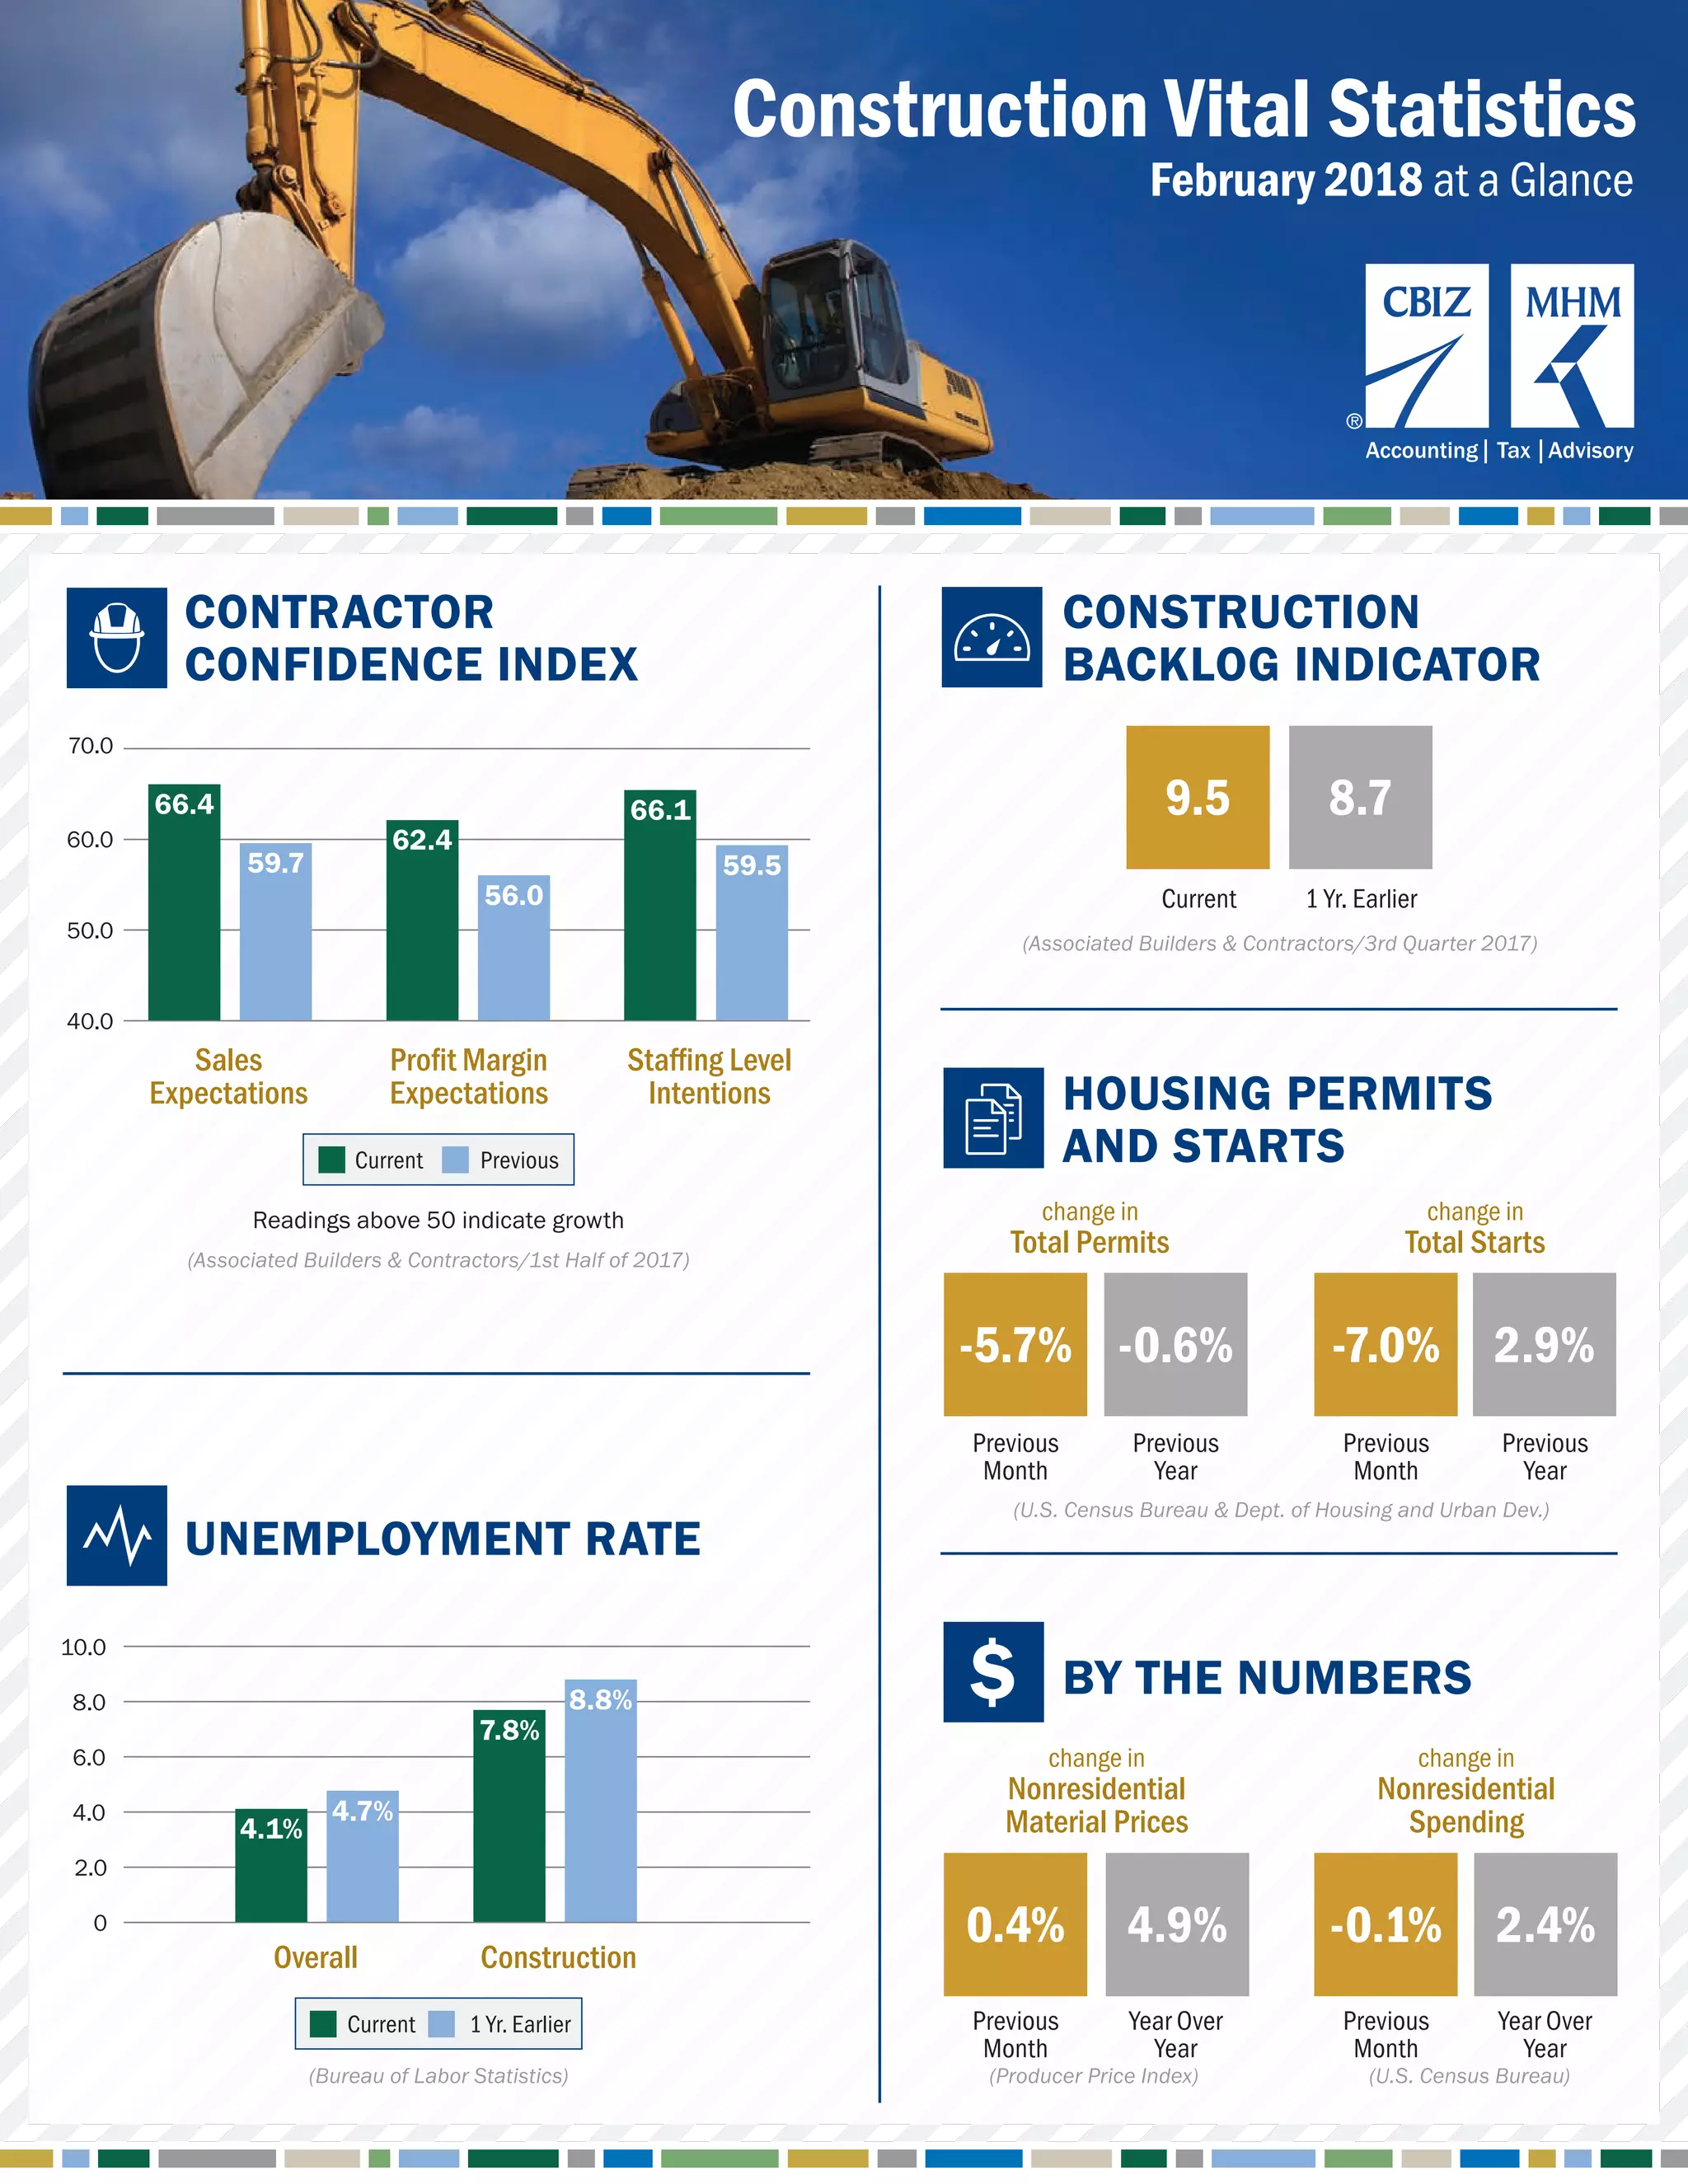
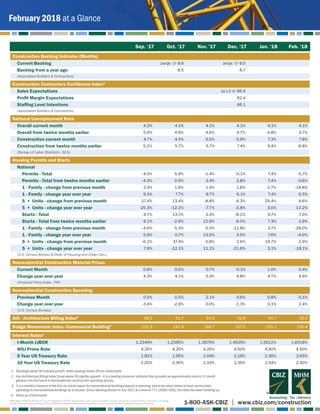

The document provides an overview of the construction industry, highlighting key indicators like contractor confidence, construction backlog, and material price changes. It details statistics for housing permits, starts, and nonresidential construction spending, indicating growth prospects and trends in 2017 and early 2018. The architecture billing index and employment statistics further reflect the overall health of the construction sector.


