Download as PDF, PPTX

![> me
$name
[1] "Takashi Kitano"
$twitter
[1] "@kashitan"
$work_in
[1] " " %>% " "](https://image.slidesharecdn.com/20190928tokyor81-190928092104/85/shiny-leaflet-Tips-2-320.jpg)


![glimpse(choices)
List of 4
$ : Named chr [1:58] "11101" "11102" "11103" "11104" ...
..- attr(*, "names")= chr [1:58] " " " " "
" " " ...
$ : Named chr [1:36] "12101" "12102" "12103" "12104" ...
..- attr(*, "names")= chr [1:36] " " " " "
" " " ...
$ : Named chr [1:51] "13101" "13102" "13103" "13104" ...
..- attr(*, "names")= chr [1:51] " " " " " " "
" ...](https://image.slidesharecdn.com/20190928tokyor81-190928092104/85/shiny-leaflet-Tips-9-320.jpg)
![names(choices)
[1] " " " " " " " "
choices[[" "]]
"13101" "13102" "13103" "13104" "13105" "13106"
"13107" "13108" "13109"
"13110" "13111" "13112" "13113" "13114" "13115"
"13116" "13117" "13118"](https://image.slidesharecdn.com/20190928tokyor81-190928092104/85/shiny-leaflet-Tips-10-320.jpg)
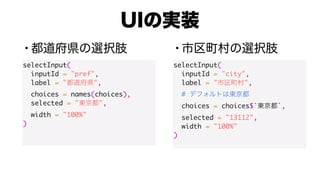
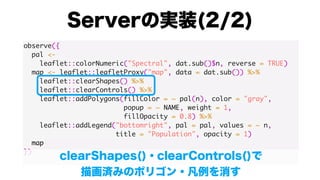
![server <- function(input, output, session) {
observe({
city_choices <- choices[[input$pref]]
city <- input$city
#
#
if (!(city %in% city_choices)) {
city <- city_choices[1]
}
updateSelectInput(
session, inputId = “city",
choices = city_choices, selected = city
)
})
}](https://image.slidesharecdn.com/20190928tokyor81-190928092104/85/shiny-leaflet-Tips-12-320.jpg)


![is.fitBounds <- FALSE
observeEvent(input$city, {
is.fitBounds <<- TRUE
})
observe({
if (is.fitBounds) {
#
bbox <- dat.sub() %>%
sf::st_bbox()
names(bbox) <- NULL
map <- map %>%
leaflet::fitBounds(bbox[1], bbox[2], bbox[3], bbox[4])
is.fitBounds <<- FALSE
}
map](https://image.slidesharecdn.com/20190928tokyor81-190928092104/85/shiny-leaflet-Tips-23-320.jpg)
![is.fitBounds <- FALSE
observeEvent(input$city, {
is.fitBounds <<- TRUE
})
observe({
if (is.fitBounds) {
#
bbox <- dat.sub() %>%
sf::st_bbox()
names(bbox) <- NULL
map <- map %>%
leaflet::fitBounds(bbox[1], bbox[2], bbox[3], bbox[4])
is.fitBounds <<- FALSE
}
map](https://image.slidesharecdn.com/20190928tokyor81-190928092104/85/shiny-leaflet-Tips-24-320.jpg)

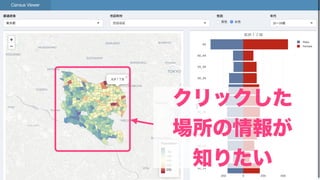

![observeEvent(input$map_shape_click, {
p <- input$map_shape_click
#
shp.sub <- shp[[input$pref]] %>%
dplyr::filter(stringr::str_sub(KEY_CODE, 1, 5) %in%
choices[[input$pref]])
#
ind <- sf::st_point(c(p$lng, p$lat), dim = "XY") %>%
sf::st_within(shp.sub) %>% unlist()
})](https://image.slidesharecdn.com/20190928tokyor81-190928092104/85/shiny-leaflet-Tips-28-320.jpg)
![observeEvent(input$map_shape_click, {
p <- input$map_shape_click
#
shp.sub <- shp[[input$pref]] %>%
dplyr::filter(stringr::str_sub(KEY_CODE, 1, 5) %in%
choices[[input$pref]])
#
ind <- sf::st_point(c(p$lng, p$lat), dim = "XY") %>%
sf::st_within(shp.sub) %>% unlist()
})](https://image.slidesharecdn.com/20190928tokyor81-190928092104/85/shiny-leaflet-Tips-29-320.jpg)


This document contains code for building interactive Shiny apps with Leaflet maps. It defines user input controls to select a geographic region and location. Map layers are added and updated based on the user selections. Code is also included to zoom the map to the selected location bounds and identify the clicked feature.


![[DSC Europe 25] Nikola Vasiljevic - Player segmentation by combat playstyles ...](https://cdn.slidesharecdn.com/ss_thumbnails/mnvbf0yvrwaqsipzrrv3-2-nikola-vasiljevic-player-segmentation-by-playstyles-in-action-shooter-games-260114111931-b4d766cd-thumbnail.jpg?width=640&height=640&fit=bounds)
![[DSC Europe 25] Dragan Jerosimovic - The Anatomy of a Narrative Simulation.pdf](https://cdn.slidesharecdn.com/ss_thumbnails/vzputuprdqr6zwbrwdcw-1-dragan-jerosimovic-the-anatomy-of-a-narrative-simulation-260114111931-9d04fba2-thumbnail.jpg?width=640&height=640&fit=bounds)


![[DSC Europe 25] Ivica Milaric - The Future of Gaming and AI Tools.pptx](https://cdn.slidesharecdn.com/ss_thumbnails/tijgzsmgse2kj2y5pzzp-5-ivica-milaric-the-future-of-gaming-x-ai-tools-260114111931-87c2b3ac-thumbnail.jpg?width=640&height=640&fit=bounds)


![[DSC Europe 25] Danilo Djukanovic - From Vibes to KPIs: Turning Culture Into ...](https://cdn.slidesharecdn.com/ss_thumbnails/inqestws5wf0cik2glgv-3-danilo-djukanovic-from-vibes-to-kpis-presentation-260114111931-dacff81f-thumbnail.jpg?width=640&height=640&fit=bounds)
![[DSC Europe 25] Ivan Lukovic & Marija Djukic - From Data to Value: Why Maturi...](https://cdn.slidesharecdn.com/ss_thumbnails/ahrfps8xr6knowwhacxh-1-ivan-marija-dsc-2025-ld-v1-presentation-260115093812-be21adfc-thumbnail.jpg?width=640&height=640&fit=bounds)
![[DSC Europe 25] Mijat Kustudic - Building Financial Intelligence with AI Agen...](https://cdn.slidesharecdn.com/ss_thumbnails/38y2lb5lse6wstegtvas-3-mijat-kustudic-building-financial-intelligence-with-ai-agents-260114111931-1a4783ce-thumbnail.jpg?width=640&height=640&fit=bounds)


