Downloaded 210 times

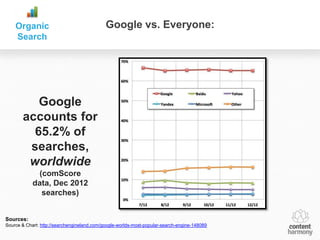


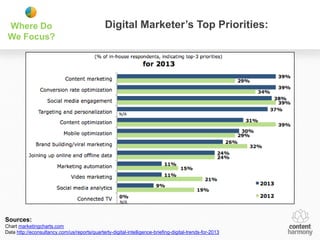
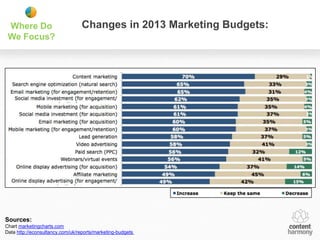
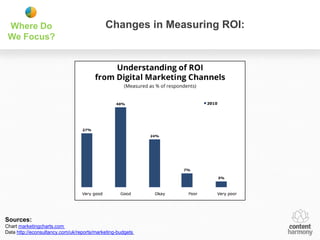


The document discusses 2013 internet marketing trends, highlighting the dominance of Google in search traffic, the evolving role of social media, and the importance of mobile marketing. Key trends include the increasing reliance on content marketing, the necessity for better data utilization, and the growing focus on conversion rate optimization. It underscores the need for organizations to adapt their marketing strategies to these trends for improved ROI.


![[Webinar July 2012] eCommerce SEO in a Post Panda World](https://cdn.slidesharecdn.com/ss_thumbnails/seowebinarjuly2012final-120911195445-phpapp02-thumbnail.jpg?width=640&height=640&fit=bounds)


