SlideShare a Scribd company logo
1 of 6
Download to read offline
Form, function, and evolution of living organisms
Jayanth R. Banavara,1
, Todd J. Cookeb,1
, Andrea Rinaldoc,d,1,2
, and Amos Maritane,1
a
Department of Physics and b
Department of Cell Biology and Molecular Genetics, University of Maryland, College Park, MD 20742; c
Laboratory of
Ecohydrology, École Polytechnique Fédérale de Lausanne, CH-1015 Lausanne, Switzerland; d
Dipartimento di Ingegneria Civile, Edile e Ambientale, Universitá
di Padova, I-35131 Padova, Italy; and e
Dipartimento di Fisica e Astronomia, Consorzio Nazionale Interuniversitario per le Scienze fisiche della Materia and
Istituto Nazionale di Fisica Nucleare, Universitá di Padova, I-35131 Padova, Italy
Contributed by Andrea Rinaldo, January 22, 2014 (sent for review November 13, 2013)
Despite the vast diversity of sizes and shapes of living organisms,
life’s organization across scales exhibits remarkable commonali-
ties, most notably through the approximate validity of Kleiber’s
law, the power law scaling of metabolic rates with the mass of an
organism. Here, we present a derivation of Kleiber’s law that is
independent of the specificity of the myriads of organism species.
Specifically, we account for the distinct geometries of trees and
mammals as well as deviations from the pure power law behavior
of Kleiber’s law, and predict the possibility of life forms with ge-
ometries intermediate between trees and mammals. We also make
several predictions in excellent accord with empirical data. Our
theory relates the separate evolutionary histories of plants and
animals through the fundamental physics underlying their distinct
overall forms and physiologies.
allometric scaling | biological scaling | tree geometry | fractal
Understanding the origin and evolution of the geometries of
living forms is a formidable challenge (1, 2). The geometry
of an object can be characterized by its surface−volume re-
lationship—the surface area S of an object of volume V can scale at
most as S ∼ V and at least as S ∼ V2=3
(3). These geometries have
been used by nature in space-filling trees and animals, respectively.
Here, our principal goal is to explore how it is that both geometries
of life coexist on Earth, whether intermediate geometries are
possible, and what all this implies for evolution of life on Earth.
Living organisms span an impressive range of body mass,
shapes, and scales. They are inherently complex, they have been
shaped by history through evolution and natural section, and
they continually extract, transform, and use energy from their
environment. The most prevalent large multicellular organisms
on Earth, namely plants and animals, exhibit distinct shapes, as
determined by the distribution of mass over the volume. Animals
are able to move and are approximately homogeneous in their
mass distribution—yet they have beautiful fractal transportation
networks. Plants are rooted organisms with a heterogeneous self-
similar (fractal) geometry—the mass of the tree is more con-
centrated in the stem and branches than in the leaves.
The approximate power law dependence of the metabolic rate,
the rate at which an organism burns energy, on organism mass
has been carefully studied for nearly two centuries and is known
as allometric scaling (4–32). From the power law behavior, with
an exponent around 3/4, one can deduce the scaling of charac-
teristic quantities with mass and, through dimensional analysis,
obtain wide-ranging predictions often in accord with empirical
data. However, what underlies this ubiquitous quarter-power
scaling, and with a dominant exponent of 3/4?
In an influential series of papers, West and coworkers (11, 12,
14–16) suggested that fractality was at the heart of allometric
scaling. Inspired by these papers, a contrasting view was pre-
sented (13), which argued that, although fractal circulatory net-
works may have advantages, quarter-power scaling came built in
with the directed transport of nutrients. However, this latter
paper was necessarily incomplete because it did not address the
distinct geometries of animals and trees. More recently, mem-
bers of both groups joined together to construct explicit models
for animals, which showed (24) that “quarter-power scaling can
arise even when there is no underlying fractality.” Here, we
take a fresh look at the problem and derive quarter-power
scaling quite generally for all living organisms. We then turn
to a consideration of the sharp differences in the geometries
of animals and trees and argue that the evolution of organ-
ismal forms follows from a rich interplay of geometry, evolu-
tionary history, developmental symmetry, and efficient nutrient
acquisition.
Despite their independent evolution and different metabo-
lisms, vascular plants and bilaterian animals share major design
features, namely, an internal mass comprising organized cells
capable of metabolic and bioenergetic activities, a transport
mechanism for distributing molecules and energy within itself,
and a surface capable of exchanging matter and energy with the
environment. Regardless of the shape differences observed be-
tween these two groups, the physics associated with the trans-
formation, transport, and exchange of matter and energy must
unavoidably impose physical constraints on their designs. An
organism is akin to an engine—part of the energy obtained
from nourishment is used for organism function, growth, re-
production, while the rest is dissipated through its surface. We
consider the hypothesis of the survival of the fittest in terms of
energy metabolism and postulate that an organism with a higher
energy intake would have a competitive advantage over another
organism of similar mass performing energetically suboptimally,
and explore its consequences.
Consider an isotropic 3D organism of spatial extent h whose
volume V scales as V ∝ h3
. Generalization to organisms with
distinct scaling along the three different directions is straight-
forward. We make the simplifying assumption that the con-
sumption and metabolic activity is distributed uniformly in space
and in time or suitable averaging is used. We denote the basal
metabolic rate of the organism by B and its mass by M. B is
Significance
Understanding the origin and evolution of the shapes ob-
served in nature remains an exciting challenge. Even from
a cursory inspection, it is clear that the shapes of animals and
plants, as determined by the distribution of mass over vol-
ume, are distinct. Animals are able to move and are ap-
proximately homogeneous in their mass distribution. Plants
are rooted organisms endowed with heterogeneous self-
similar geometry where the mass is concentrated in the stem
and branches rather than in the leaves. By addressing the
fundamental physics underlying the relation between form
and physiology and the origins of Kleiber’s law, we discuss
how the two divergent life forms of plants and animals may
have independently evolved to achieve equivalent energetic
efficiencies.
Author contributions: J.R.B., T.J.C., A.R., and A.M. designed research, performed research,
contributed new reagents/analytic tools, analyzed data, and wrote the paper.
The authors declare no conflict of interest.
Freely available online through the PNAS open access option.
1
J.R.B., T.J.C., A.R., and A.M. contributed equally to this work.
2
To whom correspondence should be addressed. E-mail: andrea.rinaldo@epfl.ch.
3332–3337 | PNAS | March 4, 2014 | vol. 111 | no. 9 www.pnas.org/cgi/doi/10.1073/pnas.1401336111
a measure of the energy being delivered to the organism per unit
time and ought to be proportional to the energy dissipated
through its surface. There is no evidence of size selection in
empirical data, and this lends support to the assumption that the
efficiency of the engine is independent of the organism’s size. We
will derive Kleiber’s law based on energy intake considerations
and study the role of geometry, as captured in the surface−
volume relationship, on considering the expelled energy.
Our goal is to understand the ideal dependence of B on M in
the scaling regime. The characteristic time scale associated with
the organism is known to scale as M=B—it is a measure of how
long it would take for energy proportional to M to be dissipated
at a rate of B. Henceforth, proportionality constants, which serve
to fix the correct units of various quantities related through
scaling relations, will be omitted for the sake of simplicity.
The number of metabolites, N, consumed in the organism per
unit time is proportional to B. Let us define N = L3
, so that a
single metabolite is consumed per unit time in the local region
surrounding each site of an L × L × L grid. Each of these sites
can be thought of as being within a service volume, in which one
metabolite is consumed per unit time, of linear spatial extent
h=L ∼ ðV=BÞ1=3
. At the local level, the metabolites need to be
transported this distance over unit time, and one immediately
finds (24) that the transport velocity v ∼ h=L ∼ ðV=BÞ1=3
. Another
measure of the transport velocity is obtained by noting that it is
a characteristic length scale of the organism divided by the cor-
responding characteristic time scale and therefore scales as
h=ðM=BÞ. Setting the two measures to be proportional to each
other, one obtains Kleiber’s law B ∼ M3=4
.
An alternative way of deriving the same result in a more rig-
orous manner is through the consideration of the properties of
efficient transportation networks. The goal is to determine the
minimum number of metabolites in transit, a measure of the
organism mass, to ensure that L3
metabolites are delivered in
unit time within the organism volume. One can prove that the
mass scales at least as L4
with the optimality arising for efficient
directed networks with no large-scale backtracking (13). This
again leads to Kleiber’s law.
Remarkably, the idealized metabolic rate−mass relationship
is predicted to be algebraic with a 3=4 exponent independent
of the geometry of the organism. Such competitive equivalence
explains the coexistence of animals with a homogeneous tissue
density and fractal plants on Earth. The mass-specific metabolic
rate, B=M, scales as M−1=4
, whereas the transit time scales as
∼ M1=4
. Indeed, characteristic biological rates (such as the heart
beat and mutation rates) and characteristic biological times
(such as circulation times or lifetimes) scale as M−1=4
and M1=4
,
respectively (6, 7, 9–12, 14–16).
Results and Discussion
We now turn our attention to geometry and the constraints it
imposes on the physiology of an organism. The link arises from
the well-known observation that the metabolic rate is pro-
portional to the surface area. The crucial point, which seems to
have been overlooked in the literature, is that the proportionality
constant includes the velocity of nutrient delivery and/or energy
transport at the surface. Thus, the two quantities that determine
the metabolic rate, B, are the surface area, S, and the velocity of
transport at the surface, v: B ∼ Sv. A pure power law in the B – M
relationship would be expected only when the product of the
surface area and the transport velocity at the surface scales
precisely as a power law of the organism mass. One would expect
that the transportation ability at the surface could vary from
species to species depending on the conditions of the surface as
well as on ambient conditions. Thus, pure power law behavior
would only hold in an idealized situation.
The surface area of the organism, S, is given by B=v, and
therefore S ∼ L3
=ðh=LÞ ∼ L4
=h. The surface area of an object of
volume V can scale at most as S ∼ V or at least as S ∼ V2=3
. More
generally, S ∼ Vx
∼ h3x
with 2=3 < x < 1, and thus L4
∼ h3x+1
.
Noting that v ∼ h=ðM=BÞ, one finds that M ∼ hB=v ∼ Vð1+3xÞ=3
,
v ∼ h=L ∼ Vð1−xÞ=4
, and B ∼ Vð1+3xÞ=4
. The V − B relationship is
different for different geometries, leading to profound con-
sequences for life (Table 1). The two limiting cases of geometry
have been exploited by nature: x = 1 in trees, and x = 2=3 in animals.
For a tree, the volume is all surface ðS ∼ VÞ with the leaves
acting as terminal units from which water transported from
the ground evaporates. The transport velocity is independent of
the organism mass. This is convenient because water has to
be transported upwards against gravity. The organism mass
M ∼ h4
∼ V4=3
and implies a density which increases with organ-
ism mass (see Methods). This geometry is tantamount to an or-
ganism in three dimensions having an effective dimensionality (12)
of 4. Interestingly, a value lower than 3=4 of the metabolic rate−
mass exponent is predicted if the tree is not isotropic, i.e., its
crown diameter scales sublinearly with tree height (22). The mass
of the tree is not uniformly distributed but rather is concentrated
in the trunk and the branches in a self-similar manner (19, 20).
Table 1. Summary of predictions of the theoretical analysis
Tree, x = 1 Animal, x = 2=3 Intermediate geometry
Metabolic rate 3=4 3=4 3=4
Characteristic length 1=4 1=3 1=ð3x + 1Þ
Characteristic time 1=4 1=4 1=4
Characteristic rate −1=4 −1=4 −1=4
Organism volume 3=4 1 3=ð3x + 1Þ
Transport velocity 0 1=12 3ð1 − xÞ=½4ð3x + 1ÞŠ
Need for pump No Yes Yes
Density 1=4 0 ð3x − 2Þ=ð3x + 1Þ
Surface area 3=4 2=3 3x=ð3x + 1Þ
Recirculation network No Yes Yes
Fractality of organism Yes No Yes
Service volume density 0 −1=4 9ðx − 1Þ=½4ð3x + 1ÞŠ
Trunk radius 3=8 1=3 3x=½2ð3x + 1ÞŠ
The geometry of the organism enters through the scaling of its surface area S with volume V, S ∼ Vx
. The
exponents characterize the scaling of the quantity in the first column with organism mass M. The idealized
scaling of the basal metabolic rate, the characteristic time (as reflected in circulation times and life times), and
the characteristic rate (such as mutation rates or pump rates) do not depend on the geometry and are universal.
Many of the predictions for trees and animals have been observed empirically (10–12, 14–16, 19, 20). The results
for organisms with intermediate geometry interpolate between the results for animals and trees.
Banavar et al. PNAS | March 4, 2014 | vol. 111 | no. 9 | 3333
ENVIRONMENTAL
SCIENCES
In contrast, an animal has a uniform density—mass and vol-
ume are proportional. The positive scaling (24) of the blood
velocity with animal mass as M1=12
requires the presence of
a pump, the heart (33, 34). A fractal tree is a rooted organism
because of its branching, whereas the nonfractal animal has the
advantage of being able to move. The density of service volumes
is independent of tree volume, whereas it decreases with increase
in animal size, as does the mitochondrial density.
An organism with an intermediate geometry, although matching
a tree and a mammal in metabolic efficiency, would require
a complex circulation network because not all volume ele-
ments lie at the surface. Such organisms would not be as easily
mobile because of their fractal geometry, and require a pump
because the transport velocity increases with organism mass as
v ∼ Mð3−3xÞ=ð12x+4Þ
. Table 1 shows the key predictions of our anal-
ysis and highlights the commonalities and differences between
the geometries and physical attributes of plants and animals.
Given the richness of nature’s adaptive strategies and differ-
ences in life history, climate, metabolic strategies, and habitat of
multicellular organisms, a remarkable result is that, despite devi-
ations and variations, robust trends are observed in the relation-
ship between metabolic rates and body mass. Fig. 1 shows
interspecies log-log plots of the metabolic rate−mass relationships
for trees [data from Mori et al. (21)] and mammals [from McNab
(18) and presented in ref. 23]. Even though the curvatures of the
two plots are distinct, in the large mass limit, both trees and
mammals approximately follow Kleiber’s law B ∼ M3=4
, where B is
the basal metabolic rate of an organism of mass M. The obser-
vations of such scaling behavior have been accompanied by vig-
orous debate on the specific form of the relationship as well as on
the reasons underlying such behavior. Much of the debate has
stemmed from the exponent value of 3=4. As noted above, the 3=4
exponent arises for a tree essentially from an effective di-
mensionality of the tree being 4 instead of 3. How can the effective
dimensionality of an object be greater than the dimensionality of
space it resides in? The constraint of packing a mass (scaling as the
tree volume to the 4=3 power) within the tree volume requires
a density that scales as M1=4
. This is facilitated through a hetero-
geneous distribution of mass over a range of scales. The mass of
a tree is not uniformly distributed but is rather concentrated within
the trunk and the branches. Denoting the tree height and trunk
radius by h and rT, respectively, we obtain M ∼ h4
∼ r2
Th or r2
T ∼ h3
and rT ∼ M3=8
. In order for this mass to be contained within
a volume of size h3
, the mass M cannot be greater than ρh3
, and
this can be satisfied only when h < hc, the upper cutoff scale for
tree size. Here ρ is an upper bound on the density of a tree
component and can be thought of as the mass density of the trunk.
By definition, M = ~naveh3
where ~nave is the average mass den-
sity (apart from a numerical factor that takes into account the
specific tree geometry—the numerical factor is π=6 for a sphere
of diameter h). Because M ∼ h4
, ~nave ∼ h (apart from a constant
with units that fixes the correct dimensionality). From the obvi-
ous bound ~nave < ρ, the trunk density, we deduce that hc = Kρ,
where the constant K has units of length4
/mass. One would ex-
pect that K would depend on details and not be universal.
The h3
∼ r2
T result is known to occur in two contexts: (i) It
describes the relationship between tree height and diameter (see
figure on p. 142 of ref. 6 for interspecies scaling, and figure on
p. 143 for intraspecies scaling); and (ii) because of the self-
similar nature of a tree, it also describes the tapering of a tree
trunk (22). Interestingly, the tapering has been derived pre-
viously (6) in a completely different manner using solid me-
chanics by asking how tall a column of a given diameter could
become before it buckles under its own weight.
During the seedling stage of tree growth, most of the mass is
composed of metabolically active tissues (17). When the mass of
the leaves (which is responsible for the metabolism) accounts for
a constant fraction of the total mass, M would be expected to be
proportional to B. The crossover between the two distinct
behaviors (M ∼ B and Kleiber’s M ∼ B4=3
) can be simply captured
by the expression
M ∼ aB4=3

1 +
b
B1=3

; [1]
where b3
sets the scale of B at which the crossover occurs cor-
responding to a crossover mass of ∼ ab4
. The distinct linear
A
B
Fig. 1. Log-log plots of metabolic rate versus mass for trees and animals show
deviations from pure power law behavior. The plot suggests that the curvatures
(23) in the data sets are opposite to each other. Shigeta Mori (21) provided the
tree data (A), and the mammal data (B) are taken from ref. 18. The curvatures
are explained as arising from the crossover of exponent values. (A) The solid line
shows a fit to M = aB4=3
ð1 + b=B1=3
Þ. The adjusted R2
value is 0.979, a = 2:10 with
SE 0.220 and P value of 10−19
, and b = 0:315 with SE 0.0602 and P value of 10−6
.
Interestingly, one obtains a leading exponent indistinguishable from 4=3 if one
chooses to make it an adjustable parameter. (B) Motivated by the lack of con-
sensus of the exponent associated with pure power law behavior of the meta-
bolic rate with mass, Kolokotrones et al. (23) carried out extensive analysis of
several data sets, principally one due to McNab (18), and showed that the data
exhibit curvature on a log-log plot. The analysis was carried out twice, excluding
and including the effects of body temperature on metabolic rate. In both cases,
the authors used an empirical quadratic fit in which the logarithm of the met-
abolic rate was expanded in terms of the logarithms of the body mass, measured
in grams. The dashed line is a fit to B = bM
2=3
Mammalmaxð1,ðMMammal=M1Þ1=12
Þ.
The adjusted R2
value is 0.961 comparable to the quality of fit presented in
(23), b = 0:0241 with SE 4:410−4
and P value of 10−243
, and log10M1 = 2:63
with SE 0.162 and P value of 10−50
.
3334 | www.pnas.org/cgi/doi/10.1073/pnas.1401336111 Banavar et al.
scaling for juveniles was underscored by Reich et al. (17), and
a somewhat similar crossover relationship was presented by
Enquist et al. (29) and more recently by Mori et al. (21). Fig. 1A
shows a log-log plot of B versus M for trees (data from ref. 21)
along with a fit to Eq. 1.
We now consider the other limiting case of organism geometry
corresponding to a minimal surface area for a given volume: an
animal with x = 2=3, S ∼ V2=3
, and M ∼ V ∼ h3
. To match the
metabolic efficiency of animals with trees, one now requires
v ∼ M1=12
. In the simple situation of a single velocity scale (i.e.,
the velocities in various parts of the mammal body all being
proportional to each other with a proportionality constant in-
dependent of organism mass), one would expect that the mean
blood velocity also scales as M1=12
. This is supported by empirical
data (9)—a velocity increasing with organism mass necessitates
the use of a mechanical pump such as a heart. Unlike in trees,
the service volumes being nourished in an animal do not all
reside at its surface. Thus, one requires a more complex circu-
lation network because, nonetheless, dissipation occurs at the
surface. Unlike trees, which are fractal and rooted, compact
organisms have the distinct advantage of being able to move.
Again, assuming a single velocity scale, the aorta cross-sectional
area ought to scale as the ratio of B to the transport velocity
or as M2=3
. One would expect then that the aorta radius scales
as M1=3
, again in accord with empirical data (24, 35). When
Kleiber’s law holds, the mass-specific metabolic rate, B=M,
scales as M−1=4
, whereas the transit time scales as h=v ∼ V1=3
=
ðV=BÞ1=3
∼ B1=3
∼ M1=4
.
The linear size of the service volume and the transport velocity
at the surface become smaller in an animal as its mass decreases.
One would therefore expect that below a certain threshold
mass, M1, mechanisms such as diffusion, which are body mass
independent (recall that the velocity in trees is indeed in-
dependent of mass), become operative. Our approach allows
A
B
Fig. 2. Consensus phylogenetic trees for the evolution of the major lineages of modern plants (A) and animals (B) underscore the role of physics as a major
selective pressure for driving the evolution of the design of multicellular organisms. (Adapted from refs. 36, 39, and 40.) The origins of the major innovations
in organismal form are also plotted on these trees. The earliest diverging lineages of multicellular animals (e.g., sponges and cnidarians) and of multicellular
plants (e.g., bryophytes) lack complex transport tissues. The later-arising groups of vascular plants and bilateral animals evolved complex transport tissues,
namely, xylem and phloem, and circulatory systems, respectively. In terms of species numbers, vascular plants and bilateral animals dominate modern eco-
systems, but it is important to consider the simpler forms of the basal lineages to understand the selection pressures driving the evolution of complex or-
ganismal forms. Organism drawings are intended to associate the names of different groups with representative organisms. Due to their size range of 7
orders of magnitude, they are not presented in proper scale. seg, segmentation. (Reprinted by permission of Pearson Education, Inc., Upper Saddle River, NJ.)
Banavar et al. PNAS | March 4, 2014 | vol. 111 | no. 9 | 3335
ENVIRONMENTAL
SCIENCES
one to incorporate velocity variation with organism size in a
natural way leading to:
B ∼ S  v ∼ M
2=3
Mammalmax

1; ðMMammal=M1Þ
1
12

: [2]
Fig. 1B shows a log-log plot of mammal metabolism data [from
McNab (18) and presented in ref. 23] along with a fit to Eq. 2. In
this simple scenario, the opposite curvatures in a log-log plot of
B versus M arise because the exponent crosses over from 1 to 3=4
as tree size increases whereas the crossover occurs from 2=3 to
3=4 as mammal mass goes up.
We turn now to a discussion of the prevalence of separate
convergent forms in animals and plants, which is diagnostic of
physical and metabolic factors serving as selective pressures
affecting the overall evolution of form. Developmental per-
spectives (36–38) provide the fundamental insight that the pat-
terns of organismal symmetry are established during the earliest
developmental stages for most multicellular organisms, including
plants and animals. Subsequently, these organisms often grow
into complex forms through independently evolved mechanisms
including modularity, fractal structure, and segmentation. De-
spite the diversity of life forms, the approximate validity of
Kleiber’s law (4, 6, 7, 9–25) provides a remarkable unifying
feature. This allometric scaling pertains to biological structures
ranging from unicellular organisms to the tallest trees and has
direct implications for characteristic rates and time scales.
Animals and plants evolved from different ancestral unicel-
lular eukaryotes (37), and their characteristic developmental
symmetries, transport systems, and complex forms have evolved
independently from each other (Fig. 2). Interestingly, basal lineages
of either plants or animals do not exhibit the characteristics of
transport tissues and complex structures observed in later-evolved
species of both groups. This implies that various selection pressures,
including physical constraints, have been favoring the evolution
of overall forms and transport structures that are better adapted
to carry out particular energetic strategies.
Bilaterian animals with circulatory systems are characterized
by higher metabolic and transport rates than simpler basal ani-
mals, such as barrel sponges and large cnidarians, of the same
mass. In the fruit fly Drosophila, a gene called tinman functions
as the master control switch for initiating the development of the
simple insect heart. Despite the profound differences in the
circulatory systems and cardiac structures of insects vs. verte-
brates, the homologous gene designated as Nkx2 − 5 plays the
same role in vertebrate heart development (33). The presence of
these homologous genes and associated regulatory networks in
the principal bilaterian lineages argues that the bilaterian com-
mon ancestor had evolved a major innovation in animal design,
namely a rudimentary circulatory system having a pump whose
development was regulated by the ancestral tinman=Nkx2 − 5
gene (34).
The earliest plants evolved from simple algal relatives to be-
come the first successful multicellular invaders of terrestrial
environments. They—and their modern bryophyte descendants—
lack complex transport systems, i.e., water-conducting xylem and
sugar-conducting phloem. In a manner analogous to what hap-
pened in animal evolution, the evolution of these complex
transport systems in vascular plants accompanied a dramatic
change in organismal form (36, 38). Then several lineages of
early vascular plants independently evolved bilateral leaves
specialized for photosynthesis and evapotranspiration, as well
as cylindrical roots specialized for water and ion absorption (36,
38). The basic form of these ancient plants is replicated by the
fractal stem and root systems of modern plants. Interestingly,
this fractal form has permitted many vascular plant lineages to
achieve great heights, as evidenced by repeated evolution of tree-
like plants ranging from the arborescent lycopods and horsetails
in Carboniferous forests 360–300 million years ago to the co-
niferous and angiosperm trees of today (38). Furthermore, the
evolution of space-filling leaves has allowed vascular plant trees
to effectively improve their energetic efficiency.
Methods
We postulate that Kleiber’s law represents a central tendency capturing joint
fluctuations in the measurement protocol of metabolic rates (26) (field,
basal, maximum, etc.) and body sizes (27). To illustrate the key mathematical
idea, we present an analytic derivation of Kleiber’s law for the idealized
situation of a spherical organism of radius h and volume V = ð4=3Þπh3
.
Consider an organism in steady state uniformly nourished from a single
source located at its center. Denoting the metabolic rate as B, the source
produces B metabolites per unit time. The amount of nutrients consumed
per unit volume in unit time is therefore given by B=V. Let ~nðrÞ and vðrÞ
denote the density of metabolites and their velocity at position r (measured
from the center) within the organism (metabolites are carried in a fluid). The
current of metabolites is then given by:
JðrÞ = ~nðrÞvðrÞ, [3]
with JðrÞ = 0 at the boundary, i.e., at jrj = h, because the nutrients are all used
within the organism. The uniform nourishment of the organism leads to the
conservation law:
divJðrÞ = − B=V: [4]
Note that the metabolically active sites (the leaves) are distributed uniformly
in a tree just as the metabolically active tissues are distributed uniformly in an
animal—it is the mass of the tree which is inhomogenously distributed,
unlike in an animal. As a byproduct of this nourishment, heat is generated
uniformly within the organism, which is then dissipated at its surface. This
heat is transported from within the organism by the fluid, and the nonzero
velocity at the surface plays a pivotal role. Solving Eq. 4 with the condition of
no flow at the boundary, one obtains
jJðrÞj = B
h3
− r3
3Vr2
, [5]
where r = jrj. One can proceed to derive Kleiber’s law from the above
equation by recalling that the mean velocity scales as the service volume
length (24), ðV=BÞ1=3
. The mean velocity can also be deduced using Eq. 3 and
the definition:
Æjvjæ =
Z
~nðrÞjvðrÞjd3
r
Z
~nðrÞd3
r
~
Z
jJðrÞjd3
r
M
: [6]
Equating the two measures of the mean velocity, one finds universally, for
animals and trees as well as intermediate life forms, Kleiber’s law. Of course,
deviations from the 3=4 exponent would arise when the two measures of
the velocity do not coincide. An exact result pertaining to the behavior of
optimal directed networks has been presented as supplementary material in
ref. 13.
ACKNOWLEDGMENTS. We are grateful to Tommaso Anfodillo, Jim Brown,
Marco Cagnazzo, Marco Carrer, John Damuth, Shigeta Mori, Melanie Moses,
Filippo Simini, Igor Volkov, Dave Weiss, and Mario Zago for useful
discussions and assistance. We acknowledge financial support from the
Cariparo Foundation and the European Research Council advanced grant
program through the project RINEC-227612.
1. D’Arcy Thompson W (1992) On Growth and Form (Cambridge University Press,
Cambridge, UK).
2. Ball P (2009) Shapes: Nature’s Patterns (Oxford University Press, New York).
3. Mandelbrot BB (1983) The Fractal Geometry of Nature (Freeman, San Francisco).
4. Kleiber M (1932) Body size and metabolism. Hilgardia 6:315–353.
5. Von Bertalanffy L (1957) Quantitative laws in metabolism and growth. Q Rev Biol
32(3):217–231.
6. McMahon TA, Bonner JT (1983) On Size and Life (Scientific American, New York).
7. Peters RH (1983) The Ecological Implications of Body Size (Cambridge University Press,
Cambridge, UK).
3336 | www.pnas.org/cgi/doi/10.1073/pnas.1401336111 Banavar et al.
8. Barenblatt GI, Monin AS (1983) Similarity principles for the biology of pelagic animals.
Proc Natl Acad Sci USA 80(11):3540–3542.
9. Calder WA (1984) Size, Function and Life History (Harvard University Press, Cam-
bridge, MA).
10. Schmidt-Nielsen K (1984) Scaling: Why Is Mammal Size So Important? (Cambridge
University Press, Cambridge, UK).
11. West GB, Brown JH, Enquist BJ (1997) A general model for the origin of allometric
scaling laws in biology. Science 276(5309):122–126.
12. West GB, Brown JH, Enquist BJ (1999) A general model for the structure and allometry
of plant vascular systems. Nature 399(6745):664–667.
13. Banavar JR, Maritan A, Rinaldo A (1999) Size and form in efficient transportation
networks. Nature 399(6732):130–132.
14. West GB, Brown JH, Enquist BJ (1999) The fourth dimension of life: Fractal geometry
and allometric scaling of organisms. Science 284(5420):1677–1679.
15. West GB, Woodruff WH, Brown JH (2002) Allometric scaling of metabolic rate from
molecules and mitochondria to cells and mammals. Proc Natl Acad Sci USA 99(1, Suppl
1):2473–2478.
16. Brown JH, Gillooly JF, Allen AP, Savage VM, West GB (2004) Toward a metabolic
theory of ecology. Ecology 85(7):1771–1789.
17. Reich PB, Tjoelker MG, Machado JL, Oleksyn J (2006) Universal scaling of respiratory
metabolism, size and nitrogen in plants. Nature 439(7075):457–461.
18. McNab BK (2008) An analysis of the factors that influence the level and scaling of
mammalian BMR. Comp Biochem Physiol A Mol Integr Physiol 151(1):5–28.
19. West GB, Enquist BJ, Brown JH (2009) A general quantitative theory of forest struc-
ture and dynamics. Proc Natl Acad Sci USA 106(17):7040–7045.
20. Enquist BJ, West GB, Brown JH (2009) Extensions and evaluations of a general
quantitative theory of forest structure and dynamics. Proc Natl Acad Sci USA 106(17):
7046–7051.
21. Mori S, et al. (2010) Mixed-power scaling of whole-plant respiration from seedlings to
giant trees. Proc Natl Acad Sci USA 107(4):1447–1451.
22. Simini F, Anfodillo T, Carrer M, Banavar JR, Maritan A (2010) Self-similarity and scaling
in forest communities. Proc Natl Acad Sci USA 107(17):7658–7662.
23. Kolokotrones T, Van Savage, Deeds EJ, Fontana W (2010) Curvature in metabolic
scaling. Nature 464(7289):753–756.
24. Banavar JR, et al. (2010) A general basis for quarter-power scaling in animals. Proc
Natl Acad Sci USA 107(36):15816–15820.
25. Pawar S, Dell AI, Savage VM (2012) Dimensionality of consumer search space drives
trophic interaction strengths. Nature 486(7404):485–489.
26. Dodds PS, Rothman DH, Weitz JS (2001) Re-examination of the “3/4-law” of metab-
olism. J Theor Biol 209(1):9–27.
27. Giometto A, Altermatt F, Carrara F, Maritan A, Rinaldo A (2013) Scaling body size
fluctuations. Proc Natl Acad Sci USA 110(12):4646–4650.
28. Banavar JR, Damuth J, Maritan A, Rinaldo A (2002) Supply-demand balance and
metabolic scaling. Proc Natl Acad Sci USA 99(16):10506–10509.
29. Enquist BJ, et al. (2007) Biological scaling: Does the exception prove the rule? Nature
445(7127):E9-E10, and discussion (2007) 445:E10-E11.
30. Glazier DS (2007) Metabolic level and size scaling of rates of respiration and growth in
unicellular organisms. Funct Ecol 23(5):963–968.
31. Dodds PS (2010) Optimal form of branching supply and collection networks. Phys Rev
Lett 104(4):048702.
32. Marañón E, et al. (2013) Unimodal size scaling of phytoplankton growth and the size
dependence of nutrient uptake and use. Ecol Lett 16(3):371–379.
33. Harvey RP (1996) NK-2 homeobox genes and heart development. Dev Biol 178(2):
203–216.
34. Olson EN (2006) Gene regulatory networks in the evolution and development of the
heart. Science 313(5795):1922–1927.
35. Holt JP, Rhode EA, Holt WW, Kines H (1981) Geometric similarity of aorta, venae
cavae, and certain of their branches in mammals. Am J Physiol 241(1):R100–R104.
36. Kenrick P, Crane PR (1997) The Origin and Early Diversification of Land Plants: A
Cladistic Study (Smithsonian Institution, Washington, DC).
37. Baldauf SL, Roger AJ, Wenk-Siefert I, Doolittle WF (2000) A kingdom-level phylogeny
of eukaryotes based on combined protein data. Science 290(5493):972–977.
38. Taylor TN, Taylor EL, Krings M (2009) Paleobotany: The Biology and Evolution of Fossil
Plants (Elsevier, New York).
39. Reece JB, et al. (2011) Campbell Biology (Benjamin Cummings, New York), 9th Ed.
40. Tree of Life Web Project (2002) Bilateria, triploblasts, bilaterally symmetrical animals
with three germ layers http://tolweb.org/Animals/2374/2002.01.01.
Banavar et al. PNAS | March 4, 2014 | vol. 111 | no. 9 | 3337
ENVIRONMENTAL
SCIENCES

More Related Content

What's hot

Ecological Pyramids, Food Chain and Food Web
Ecological Pyramids, Food Chain and Food WebEcological Pyramids, Food Chain and Food Web
Ecological Pyramids, Food Chain and Food WebLiwayway Memije-Cruz
 
Role Of Behavior In Evolution 1
Role Of  Behavior In  Evolution 1Role Of  Behavior In  Evolution 1
Role Of Behavior In Evolution 1naeempr
 
IOSR Journal of Pharmacy (IOSRPHR)
IOSR Journal of Pharmacy (IOSRPHR)IOSR Journal of Pharmacy (IOSRPHR)
IOSR Journal of Pharmacy (IOSRPHR)iosrphr_editor
 
Ecology and mans influence
Ecology and mans influenceEcology and mans influence
Ecology and mans influenceSophie Hidden
 
Ecological pyramid
Ecological pyramidEcological pyramid
Ecological pyramidganikakod
 
Bio 409 Facts, Theories, And Hypothesis
Bio 409 Facts, Theories, And HypothesisBio 409 Facts, Theories, And Hypothesis
Bio 409 Facts, Theories, And Hypothesisguest0140c9
 
efficency of trophic levels
efficency of trophic levelsefficency of trophic levels
efficency of trophic levelsKhaleen
 
Ecological pyramid
Ecological pyramidEcological pyramid
Ecological pyramidJsjahnabi
 
Macroinvertebrate_Poster_Katie_Senior_Research
Macroinvertebrate_Poster_Katie_Senior_ResearchMacroinvertebrate_Poster_Katie_Senior_Research
Macroinvertebrate_Poster_Katie_Senior_ResearchKatherine Guild
 
Beiko networks 2019_final
Beiko networks 2019_finalBeiko networks 2019_final
Beiko networks 2019_finalbeiko
 
EVE 161 Winter 2018 Class 9
EVE 161 Winter 2018 Class 9EVE 161 Winter 2018 Class 9
EVE 161 Winter 2018 Class 9Jonathan Eisen
 
Shifts in phenology due to global climate change: The need for a yardstick
Shifts in phenology due to global climate change: The need for a yardstickShifts in phenology due to global climate change: The need for a yardstick
Shifts in phenology due to global climate change: The need for a yardstickSimoneBoccuccia
 

What's hot (18)

Ecological Pyramids, Food Chain and Food Web
Ecological Pyramids, Food Chain and Food WebEcological Pyramids, Food Chain and Food Web
Ecological Pyramids, Food Chain and Food Web
 
Role Of Behavior In Evolution 1
Role Of  Behavior In  Evolution 1Role Of  Behavior In  Evolution 1
Role Of Behavior In Evolution 1
 
IOSR Journal of Pharmacy (IOSRPHR)
IOSR Journal of Pharmacy (IOSRPHR)IOSR Journal of Pharmacy (IOSRPHR)
IOSR Journal of Pharmacy (IOSRPHR)
 
Ecology and mans influence
Ecology and mans influenceEcology and mans influence
Ecology and mans influence
 
Paine 1980 food webs
Paine 1980   food websPaine 1980   food webs
Paine 1980 food webs
 
Ecological pyramid
Ecological pyramidEcological pyramid
Ecological pyramid
 
Bio 409 Facts, Theories, And Hypothesis
Bio 409 Facts, Theories, And HypothesisBio 409 Facts, Theories, And Hypothesis
Bio 409 Facts, Theories, And Hypothesis
 
efficency of trophic levels
efficency of trophic levelsefficency of trophic levels
efficency of trophic levels
 
Ecological pyramid
Ecological pyramidEcological pyramid
Ecological pyramid
 
2016 Poster
2016 Poster2016 Poster
2016 Poster
 
Multifractal
MultifractalMultifractal
Multifractal
 
Birds
BirdsBirds
Birds
 
ASCB15AbsR
ASCB15AbsRASCB15AbsR
ASCB15AbsR
 
Macroinvertebrate_Poster_Katie_Senior_Research
Macroinvertebrate_Poster_Katie_Senior_ResearchMacroinvertebrate_Poster_Katie_Senior_Research
Macroinvertebrate_Poster_Katie_Senior_Research
 
Ecología (medio fluvial y costero)
Ecología (medio fluvial y costero)Ecología (medio fluvial y costero)
Ecología (medio fluvial y costero)
 
Beiko networks 2019_final
Beiko networks 2019_finalBeiko networks 2019_final
Beiko networks 2019_final
 
EVE 161 Winter 2018 Class 9
EVE 161 Winter 2018 Class 9EVE 161 Winter 2018 Class 9
EVE 161 Winter 2018 Class 9
 
Shifts in phenology due to global climate change: The need for a yardstick
Shifts in phenology due to global climate change: The need for a yardstickShifts in phenology due to global climate change: The need for a yardstick
Shifts in phenology due to global climate change: The need for a yardstick
 

Viewers also liked

A general model for the origin of allometric scaling laws in biology
A general model for the origin of allometric scaling laws in biologyA general model for the origin of allometric scaling laws in biology
A general model for the origin of allometric scaling laws in biologyJosé Luis Moreno Garvayo
 
Interleukin-1 targeting drugs in familial mediterranean fever: a case series ...
Interleukin-1 targeting drugs in familial mediterranean fever: a case series ...Interleukin-1 targeting drugs in familial mediterranean fever: a case series ...
Interleukin-1 targeting drugs in familial mediterranean fever: a case series ...José Luis Moreno Garvayo
 
The timing and spatiotemporal patterning of Neanderthal disappearance
The timing and spatiotemporal patterning of Neanderthal disappearanceThe timing and spatiotemporal patterning of Neanderthal disappearance
The timing and spatiotemporal patterning of Neanderthal disappearanceJosé Luis Moreno Garvayo
 

Viewers also liked (6)

A general model for the origin of allometric scaling laws in biology
A general model for the origin of allometric scaling laws in biologyA general model for the origin of allometric scaling laws in biology
A general model for the origin of allometric scaling laws in biology
 
Body size and metabolism
Body size and metabolismBody size and metabolism
Body size and metabolism
 
Entrevista de Marie E. Belloc a Julio Verne
Entrevista de Marie E. Belloc a Julio VerneEntrevista de Marie E. Belloc a Julio Verne
Entrevista de Marie E. Belloc a Julio Verne
 
Interleukin-1 targeting drugs in familial mediterranean fever: a case series ...
Interleukin-1 targeting drugs in familial mediterranean fever: a case series ...Interleukin-1 targeting drugs in familial mediterranean fever: a case series ...
Interleukin-1 targeting drugs in familial mediterranean fever: a case series ...
 
Hearing lips and seeing voices
Hearing lips and seeing voicesHearing lips and seeing voices
Hearing lips and seeing voices
 
The timing and spatiotemporal patterning of Neanderthal disappearance
The timing and spatiotemporal patterning of Neanderthal disappearanceThe timing and spatiotemporal patterning of Neanderthal disappearance
The timing and spatiotemporal patterning of Neanderthal disappearance
 

Similar to Form, function, and evolution of living organisms

Applicatiojns of Allometric principles in animal nutrition research
Applicatiojns of Allometric principles in animal nutrition researchApplicatiojns of Allometric principles in animal nutrition research
Applicatiojns of Allometric principles in animal nutrition researchGanesh Aderao
 
Applications of allometric principles in animal nutrition nresearch
Applications of allometric principles in animal nutrition nresearchApplications of allometric principles in animal nutrition nresearch
Applications of allometric principles in animal nutrition nresearchGanesh Aderao
 
White, Patrica Accepted Thesis 11-23-15 Fa15-1
White, Patrica Accepted Thesis  11-23-15 Fa15-1White, Patrica Accepted Thesis  11-23-15 Fa15-1
White, Patrica Accepted Thesis 11-23-15 Fa15-1Patricia White
 
Avaliação de alguns currículos interdisciplinares
Avaliação de alguns currículos interdisciplinaresAvaliação de alguns currículos interdisciplinares
Avaliação de alguns currículos interdisciplinarescasifufrgs
 
A stage-structured delayed advection reaction-diffusion model for single spec...
A stage-structured delayed advection reaction-diffusion model for single spec...A stage-structured delayed advection reaction-diffusion model for single spec...
A stage-structured delayed advection reaction-diffusion model for single spec...IJECEIAES
 
Cape biology uni 2 -_ecosystems_population_ecology_and_practical_methods_of_e...
Cape biology uni 2 -_ecosystems_population_ecology_and_practical_methods_of_e...Cape biology uni 2 -_ecosystems_population_ecology_and_practical_methods_of_e...
Cape biology uni 2 -_ecosystems_population_ecology_and_practical_methods_of_e...Hilton Ritch
 
CHAPTER 7Smith, T. M., & Smith, R. L. (2015). Elements of Ecolog.docx
CHAPTER 7Smith, T. M., & Smith, R. L. (2015). Elements of Ecolog.docxCHAPTER 7Smith, T. M., & Smith, R. L. (2015). Elements of Ecolog.docx
CHAPTER 7Smith, T. M., & Smith, R. L. (2015). Elements of Ecolog.docxchristinemaritza
 
Part 2- Human Population- Ecologists often think about the dynamics o.pdf
Part 2-  Human Population- Ecologists often think about the dynamics o.pdfPart 2-  Human Population- Ecologists often think about the dynamics o.pdf
Part 2- Human Population- Ecologists often think about the dynamics o.pdfNathan2rSPeakes
 
Estimation of Mineral Content in Vegetable Extraction by Ultrasonic Technique
Estimation of Mineral Content in Vegetable Extraction by Ultrasonic TechniqueEstimation of Mineral Content in Vegetable Extraction by Ultrasonic Technique
Estimation of Mineral Content in Vegetable Extraction by Ultrasonic Techniqueinventionjournals
 
Energy flow in ecosystem
Energy flow in ecosystemEnergy flow in ecosystem
Energy flow in ecosystemgithure eliud
 
Ecology and ecosystems notes
Ecology and ecosystems notesEcology and ecosystems notes
Ecology and ecosystems notesjschmied
 
Assignment
AssignmentAssignment
Assignmentbintu55
 
[Ostrom, 2009] a general framework for analyzing sustainability of social-e...
[Ostrom, 2009]   a general framework for analyzing sustainability of social-e...[Ostrom, 2009]   a general framework for analyzing sustainability of social-e...
[Ostrom, 2009] a general framework for analyzing sustainability of social-e...FiorellaIsabelCampos1
 

Similar to Form, function, and evolution of living organisms (20)

Ecosystem structure and function
Ecosystem structure and functionEcosystem structure and function
Ecosystem structure and function
 
Ecosystem structure and function
Ecosystem structure and functionEcosystem structure and function
Ecosystem structure and function
 
Vannote 1980
Vannote 1980Vannote 1980
Vannote 1980
 
Applicatiojns of Allometric principles in animal nutrition research
Applicatiojns of Allometric principles in animal nutrition researchApplicatiojns of Allometric principles in animal nutrition research
Applicatiojns of Allometric principles in animal nutrition research
 
Applications of allometric principles in animal nutrition nresearch
Applications of allometric principles in animal nutrition nresearchApplications of allometric principles in animal nutrition nresearch
Applications of allometric principles in animal nutrition nresearch
 
Food Web.pptx
Food Web.pptxFood Web.pptx
Food Web.pptx
 
White, Patrica Accepted Thesis 11-23-15 Fa15-1
White, Patrica Accepted Thesis  11-23-15 Fa15-1White, Patrica Accepted Thesis  11-23-15 Fa15-1
White, Patrica Accepted Thesis 11-23-15 Fa15-1
 
Avaliação de alguns currículos interdisciplinares
Avaliação de alguns currículos interdisciplinaresAvaliação de alguns currículos interdisciplinares
Avaliação de alguns currículos interdisciplinares
 
A stage-structured delayed advection reaction-diffusion model for single spec...
A stage-structured delayed advection reaction-diffusion model for single spec...A stage-structured delayed advection reaction-diffusion model for single spec...
A stage-structured delayed advection reaction-diffusion model for single spec...
 
Cape biology uni 2 -_ecosystems_population_ecology_and_practical_methods_of_e...
Cape biology uni 2 -_ecosystems_population_ecology_and_practical_methods_of_e...Cape biology uni 2 -_ecosystems_population_ecology_and_practical_methods_of_e...
Cape biology uni 2 -_ecosystems_population_ecology_and_practical_methods_of_e...
 
CHAPTER 7Smith, T. M., & Smith, R. L. (2015). Elements of Ecolog.docx
CHAPTER 7Smith, T. M., & Smith, R. L. (2015). Elements of Ecolog.docxCHAPTER 7Smith, T. M., & Smith, R. L. (2015). Elements of Ecolog.docx
CHAPTER 7Smith, T. M., & Smith, R. L. (2015). Elements of Ecolog.docx
 
Science ace
Science aceScience ace
Science ace
 
Part 2- Human Population- Ecologists often think about the dynamics o.pdf
Part 2-  Human Population- Ecologists often think about the dynamics o.pdfPart 2-  Human Population- Ecologists often think about the dynamics o.pdf
Part 2- Human Population- Ecologists often think about the dynamics o.pdf
 
Estimation of Mineral Content in Vegetable Extraction by Ultrasonic Technique
Estimation of Mineral Content in Vegetable Extraction by Ultrasonic TechniqueEstimation of Mineral Content in Vegetable Extraction by Ultrasonic Technique
Estimation of Mineral Content in Vegetable Extraction by Ultrasonic Technique
 
Energy flow in ecosystem
Energy flow in ecosystemEnergy flow in ecosystem
Energy flow in ecosystem
 
Adj natural selection
Adj natural selectionAdj natural selection
Adj natural selection
 
Ecology and ecosystems notes
Ecology and ecosystems notesEcology and ecosystems notes
Ecology and ecosystems notes
 
Assignment
AssignmentAssignment
Assignment
 
Magurran estrutura comunidades
Magurran estrutura comunidadesMagurran estrutura comunidades
Magurran estrutura comunidades
 
[Ostrom, 2009] a general framework for analyzing sustainability of social-e...
[Ostrom, 2009]   a general framework for analyzing sustainability of social-e...[Ostrom, 2009]   a general framework for analyzing sustainability of social-e...
[Ostrom, 2009] a general framework for analyzing sustainability of social-e...
 

More from José Luis Moreno Garvayo

Tmc gene therapy restores auditory function in deaf mice (traduccion)
Tmc gene therapy restores auditory function in deaf mice (traduccion)Tmc gene therapy restores auditory function in deaf mice (traduccion)
Tmc gene therapy restores auditory function in deaf mice (traduccion)José Luis Moreno Garvayo
 
Tmc gene therapy restores auditory function in deaf mice
Tmc gene therapy restores auditory function in deaf miceTmc gene therapy restores auditory function in deaf mice
Tmc gene therapy restores auditory function in deaf miceJosé Luis Moreno Garvayo
 
The evolutionary history of the hominin hand since the last common ancestor o...
The evolutionary history of the hominin hand since the last common ancestor o...The evolutionary history of the hominin hand since the last common ancestor o...
The evolutionary history of the hominin hand since the last common ancestor o...José Luis Moreno Garvayo
 
The evolution of human and ape hand proportions
The evolution of human and ape hand proportionsThe evolution of human and ape hand proportions
The evolution of human and ape hand proportionsJosé Luis Moreno Garvayo
 
3.3-million-year-old stone tools from Lomekwi 3, West Turkana, Kenya
3.3-million-year-old stone tools from Lomekwi 3, West Turkana, Kenya3.3-million-year-old stone tools from Lomekwi 3, West Turkana, Kenya
3.3-million-year-old stone tools from Lomekwi 3, West Turkana, KenyaJosé Luis Moreno Garvayo
 
The SPRY domain of pyrin, mutated in familial mediterranean fever
The SPRY domain of pyrin, mutated in familial mediterranean feverThe SPRY domain of pyrin, mutated in familial mediterranean fever
The SPRY domain of pyrin, mutated in familial mediterranean feverJosé Luis Moreno Garvayo
 
The crystal structure of human pyrin B30. 2 domain: implications for mutation...
The crystal structure of human pyrin B30. 2 domain: implications for mutation...The crystal structure of human pyrin B30. 2 domain: implications for mutation...
The crystal structure of human pyrin B30. 2 domain: implications for mutation...José Luis Moreno Garvayo
 
The B30. 2 domain of pyrin, the familial mediterranean fever protein, interac...
The B30. 2 domain of pyrin, the familial mediterranean fever protein, interac...The B30. 2 domain of pyrin, the familial mediterranean fever protein, interac...
The B30. 2 domain of pyrin, the familial mediterranean fever protein, interac...José Luis Moreno Garvayo
 
Treatment of familial mediterranean fever: colchicine and beyond
Treatment of familial mediterranean fever: colchicine and beyondTreatment of familial mediterranean fever: colchicine and beyond
Treatment of familial mediterranean fever: colchicine and beyondJosé Luis Moreno Garvayo
 
Evidence based recommendations for the practical management of familial medit...
Evidence based recommendations for the practical management of familial medit...Evidence based recommendations for the practical management of familial medit...
Evidence based recommendations for the practical management of familial medit...José Luis Moreno Garvayo
 
Notes and news from the U.S.S. Yantic, Montevideo, March 11, 1892
Notes and news from the U.S.S. Yantic, Montevideo, March 11, 1892Notes and news from the U.S.S. Yantic, Montevideo, March 11, 1892
Notes and news from the U.S.S. Yantic, Montevideo, March 11, 1892José Luis Moreno Garvayo
 
Squid rocket science: how squid launch into air
Squid rocket science: how squid launch into airSquid rocket science: how squid launch into air
Squid rocket science: how squid launch into airJosé Luis Moreno Garvayo
 
Familial Mediterranean Fever: from pathogenesis to treatment
Familial Mediterranean Fever: from pathogenesis to treatmentFamilial Mediterranean Fever: from pathogenesis to treatment
Familial Mediterranean Fever: from pathogenesis to treatmentJosé Luis Moreno Garvayo
 
Anakinra suppresses Familial Mediterranean Fever crises in a colchicine-resis...
Anakinra suppresses Familial Mediterranean Fever crises in a colchicine-resis...Anakinra suppresses Familial Mediterranean Fever crises in a colchicine-resis...
Anakinra suppresses Familial Mediterranean Fever crises in a colchicine-resis...José Luis Moreno Garvayo
 
Interleukin-1 targeting drugs in Familial Mediterranean Fever: a case series ...
Interleukin-1 targeting drugs in Familial Mediterranean Fever: a case series ...Interleukin-1 targeting drugs in Familial Mediterranean Fever: a case series ...
Interleukin-1 targeting drugs in Familial Mediterranean Fever: a case series ...José Luis Moreno Garvayo
 
Colchicine failure in Familial Mediterranean Fever and potential alternatives...
Colchicine failure in Familial Mediterranean Fever and potential alternatives...Colchicine failure in Familial Mediterranean Fever and potential alternatives...
Colchicine failure in Familial Mediterranean Fever and potential alternatives...José Luis Moreno Garvayo
 

More from José Luis Moreno Garvayo (20)

Pseudoarqueología no, falsa arqueología
Pseudoarqueología no, falsa arqueologíaPseudoarqueología no, falsa arqueología
Pseudoarqueología no, falsa arqueología
 
Comentarios al libro Mala ciencia
Comentarios al libro Mala cienciaComentarios al libro Mala ciencia
Comentarios al libro Mala ciencia
 
Tmc gene therapy restores auditory function in deaf mice (traduccion)
Tmc gene therapy restores auditory function in deaf mice (traduccion)Tmc gene therapy restores auditory function in deaf mice (traduccion)
Tmc gene therapy restores auditory function in deaf mice (traduccion)
 
Tmc gene therapy restores auditory function in deaf mice
Tmc gene therapy restores auditory function in deaf miceTmc gene therapy restores auditory function in deaf mice
Tmc gene therapy restores auditory function in deaf mice
 
The evolutionary history of the hominin hand since the last common ancestor o...
The evolutionary history of the hominin hand since the last common ancestor o...The evolutionary history of the hominin hand since the last common ancestor o...
The evolutionary history of the hominin hand since the last common ancestor o...
 
The evolution of human and ape hand proportions
The evolution of human and ape hand proportionsThe evolution of human and ape hand proportions
The evolution of human and ape hand proportions
 
3.3-million-year-old stone tools from Lomekwi 3, West Turkana, Kenya
3.3-million-year-old stone tools from Lomekwi 3, West Turkana, Kenya3.3-million-year-old stone tools from Lomekwi 3, West Turkana, Kenya
3.3-million-year-old stone tools from Lomekwi 3, West Turkana, Kenya
 
The SPRY domain of pyrin, mutated in familial mediterranean fever
The SPRY domain of pyrin, mutated in familial mediterranean feverThe SPRY domain of pyrin, mutated in familial mediterranean fever
The SPRY domain of pyrin, mutated in familial mediterranean fever
 
The crystal structure of human pyrin B30. 2 domain: implications for mutation...
The crystal structure of human pyrin B30. 2 domain: implications for mutation...The crystal structure of human pyrin B30. 2 domain: implications for mutation...
The crystal structure of human pyrin B30. 2 domain: implications for mutation...
 
The B30. 2 domain of pyrin, the familial mediterranean fever protein, interac...
The B30. 2 domain of pyrin, the familial mediterranean fever protein, interac...The B30. 2 domain of pyrin, the familial mediterranean fever protein, interac...
The B30. 2 domain of pyrin, the familial mediterranean fever protein, interac...
 
Treatment of familial mediterranean fever: colchicine and beyond
Treatment of familial mediterranean fever: colchicine and beyondTreatment of familial mediterranean fever: colchicine and beyond
Treatment of familial mediterranean fever: colchicine and beyond
 
Evidence based recommendations for the practical management of familial medit...
Evidence based recommendations for the practical management of familial medit...Evidence based recommendations for the practical management of familial medit...
Evidence based recommendations for the practical management of familial medit...
 
Notes and news from the U.S.S. Yantic, Montevideo, March 11, 1892
Notes and news from the U.S.S. Yantic, Montevideo, March 11, 1892Notes and news from the U.S.S. Yantic, Montevideo, March 11, 1892
Notes and news from the U.S.S. Yantic, Montevideo, March 11, 1892
 
Squid rocket science: how squid launch into air
Squid rocket science: how squid launch into airSquid rocket science: how squid launch into air
Squid rocket science: how squid launch into air
 
Oceanic squid do fly
Oceanic squid do flyOceanic squid do fly
Oceanic squid do fly
 
Familial Mediterranean Fever: from pathogenesis to treatment
Familial Mediterranean Fever: from pathogenesis to treatmentFamilial Mediterranean Fever: from pathogenesis to treatment
Familial Mediterranean Fever: from pathogenesis to treatment
 
Anakinra suppresses Familial Mediterranean Fever crises in a colchicine-resis...
Anakinra suppresses Familial Mediterranean Fever crises in a colchicine-resis...Anakinra suppresses Familial Mediterranean Fever crises in a colchicine-resis...
Anakinra suppresses Familial Mediterranean Fever crises in a colchicine-resis...
 
Interleukin-1 targeting drugs in Familial Mediterranean Fever: a case series ...
Interleukin-1 targeting drugs in Familial Mediterranean Fever: a case series ...Interleukin-1 targeting drugs in Familial Mediterranean Fever: a case series ...
Interleukin-1 targeting drugs in Familial Mediterranean Fever: a case series ...
 
Colchicine failure in Familial Mediterranean Fever and potential alternatives...
Colchicine failure in Familial Mediterranean Fever and potential alternatives...Colchicine failure in Familial Mediterranean Fever and potential alternatives...
Colchicine failure in Familial Mediterranean Fever and potential alternatives...
 
Cognitive reflection and decision making
Cognitive reflection and decision makingCognitive reflection and decision making
Cognitive reflection and decision making
 

Recently uploaded

How to do quick user assign in kanban in Odoo 17 ERP
How to do quick user assign in kanban in Odoo 17 ERPHow to do quick user assign in kanban in Odoo 17 ERP
How to do quick user assign in kanban in Odoo 17 ERPCeline George
 
Types of Journalistic Writing Grade 8.pptx
Types of Journalistic Writing Grade 8.pptxTypes of Journalistic Writing Grade 8.pptx
Types of Journalistic Writing Grade 8.pptxEyham Joco
 
AMERICAN LANGUAGE HUB_Level2_Student'sBook_Answerkey.pdf
AMERICAN LANGUAGE HUB_Level2_Student'sBook_Answerkey.pdfAMERICAN LANGUAGE HUB_Level2_Student'sBook_Answerkey.pdf
AMERICAN LANGUAGE HUB_Level2_Student'sBook_Answerkey.pdfphamnguyenenglishnb
 
How to Configure Email Server in Odoo 17
How to Configure Email Server in Odoo 17How to Configure Email Server in Odoo 17
How to Configure Email Server in Odoo 17Celine George
 
Alper Gobel In Media Res Media Component
Alper Gobel In Media Res Media ComponentAlper Gobel In Media Res Media Component
Alper Gobel In Media Res Media ComponentInMediaRes1
 
Influencing policy (training slides from Fast Track Impact)
Influencing policy (training slides from Fast Track Impact)Influencing policy (training slides from Fast Track Impact)
Influencing policy (training slides from Fast Track Impact)Mark Reed
 
ROOT CAUSE ANALYSIS PowerPoint Presentation
ROOT CAUSE ANALYSIS PowerPoint PresentationROOT CAUSE ANALYSIS PowerPoint Presentation
ROOT CAUSE ANALYSIS PowerPoint PresentationAadityaSharma884161
 
DATA STRUCTURE AND ALGORITHM for beginners
DATA STRUCTURE AND ALGORITHM for beginnersDATA STRUCTURE AND ALGORITHM for beginners
DATA STRUCTURE AND ALGORITHM for beginnersSabitha Banu
 
Crayon Activity Handout For the Crayon A
Crayon Activity Handout For the Crayon ACrayon Activity Handout For the Crayon A
Crayon Activity Handout For the Crayon AUnboundStockton
 
What is Model Inheritance in Odoo 17 ERP
What is Model Inheritance in Odoo 17 ERPWhat is Model Inheritance in Odoo 17 ERP
What is Model Inheritance in Odoo 17 ERPCeline George
 
Earth Day Presentation wow hello nice great
Earth Day Presentation wow hello nice greatEarth Day Presentation wow hello nice great
Earth Day Presentation wow hello nice greatYousafMalik24
 
MULTIDISCIPLINRY NATURE OF THE ENVIRONMENTAL STUDIES.pptx
MULTIDISCIPLINRY NATURE OF THE ENVIRONMENTAL STUDIES.pptxMULTIDISCIPLINRY NATURE OF THE ENVIRONMENTAL STUDIES.pptx
MULTIDISCIPLINRY NATURE OF THE ENVIRONMENTAL STUDIES.pptxAnupkumar Sharma
 
ECONOMIC CONTEXT - LONG FORM TV DRAMA - PPT
ECONOMIC CONTEXT - LONG FORM TV DRAMA - PPTECONOMIC CONTEXT - LONG FORM TV DRAMA - PPT
ECONOMIC CONTEXT - LONG FORM TV DRAMA - PPTiammrhaywood
 
Gas measurement O2,Co2,& ph) 04/2024.pptx
Gas measurement O2,Co2,& ph) 04/2024.pptxGas measurement O2,Co2,& ph) 04/2024.pptx
Gas measurement O2,Co2,& ph) 04/2024.pptxDr.Ibrahim Hassaan
 
Keynote by Prof. Wurzer at Nordex about IP-design
Keynote by Prof. Wurzer at Nordex about IP-designKeynote by Prof. Wurzer at Nordex about IP-design
Keynote by Prof. Wurzer at Nordex about IP-designMIPLM
 
Introduction to AI in Higher Education_draft.pptx
Introduction to AI in Higher Education_draft.pptxIntroduction to AI in Higher Education_draft.pptx
Introduction to AI in Higher Education_draft.pptxpboyjonauth
 
Computed Fields and api Depends in the Odoo 17
Computed Fields and api Depends in the Odoo 17Computed Fields and api Depends in the Odoo 17
Computed Fields and api Depends in the Odoo 17Celine George
 

Recently uploaded (20)

Rapple "Scholarly Communications and the Sustainable Development Goals"
Rapple "Scholarly Communications and the Sustainable Development Goals"Rapple "Scholarly Communications and the Sustainable Development Goals"
Rapple "Scholarly Communications and the Sustainable Development Goals"
 
How to do quick user assign in kanban in Odoo 17 ERP
How to do quick user assign in kanban in Odoo 17 ERPHow to do quick user assign in kanban in Odoo 17 ERP
How to do quick user assign in kanban in Odoo 17 ERP
 
Types of Journalistic Writing Grade 8.pptx
Types of Journalistic Writing Grade 8.pptxTypes of Journalistic Writing Grade 8.pptx
Types of Journalistic Writing Grade 8.pptx
 
AMERICAN LANGUAGE HUB_Level2_Student'sBook_Answerkey.pdf
AMERICAN LANGUAGE HUB_Level2_Student'sBook_Answerkey.pdfAMERICAN LANGUAGE HUB_Level2_Student'sBook_Answerkey.pdf
AMERICAN LANGUAGE HUB_Level2_Student'sBook_Answerkey.pdf
 
How to Configure Email Server in Odoo 17
How to Configure Email Server in Odoo 17How to Configure Email Server in Odoo 17
How to Configure Email Server in Odoo 17
 
Alper Gobel In Media Res Media Component
Alper Gobel In Media Res Media ComponentAlper Gobel In Media Res Media Component
Alper Gobel In Media Res Media Component
 
Influencing policy (training slides from Fast Track Impact)
Influencing policy (training slides from Fast Track Impact)Influencing policy (training slides from Fast Track Impact)
Influencing policy (training slides from Fast Track Impact)
 
ROOT CAUSE ANALYSIS PowerPoint Presentation
ROOT CAUSE ANALYSIS PowerPoint PresentationROOT CAUSE ANALYSIS PowerPoint Presentation
ROOT CAUSE ANALYSIS PowerPoint Presentation
 
TataKelola dan KamSiber Kecerdasan Buatan v022.pdf
TataKelola dan KamSiber Kecerdasan Buatan v022.pdfTataKelola dan KamSiber Kecerdasan Buatan v022.pdf
TataKelola dan KamSiber Kecerdasan Buatan v022.pdf
 
DATA STRUCTURE AND ALGORITHM for beginners
DATA STRUCTURE AND ALGORITHM for beginnersDATA STRUCTURE AND ALGORITHM for beginners
DATA STRUCTURE AND ALGORITHM for beginners
 
Crayon Activity Handout For the Crayon A
Crayon Activity Handout For the Crayon ACrayon Activity Handout For the Crayon A
Crayon Activity Handout For the Crayon A
 
What is Model Inheritance in Odoo 17 ERP
What is Model Inheritance in Odoo 17 ERPWhat is Model Inheritance in Odoo 17 ERP
What is Model Inheritance in Odoo 17 ERP
 
Earth Day Presentation wow hello nice great
Earth Day Presentation wow hello nice greatEarth Day Presentation wow hello nice great
Earth Day Presentation wow hello nice great
 
MULTIDISCIPLINRY NATURE OF THE ENVIRONMENTAL STUDIES.pptx
MULTIDISCIPLINRY NATURE OF THE ENVIRONMENTAL STUDIES.pptxMULTIDISCIPLINRY NATURE OF THE ENVIRONMENTAL STUDIES.pptx
MULTIDISCIPLINRY NATURE OF THE ENVIRONMENTAL STUDIES.pptx
 
ECONOMIC CONTEXT - LONG FORM TV DRAMA - PPT
ECONOMIC CONTEXT - LONG FORM TV DRAMA - PPTECONOMIC CONTEXT - LONG FORM TV DRAMA - PPT
ECONOMIC CONTEXT - LONG FORM TV DRAMA - PPT
 
Gas measurement O2,Co2,& ph) 04/2024.pptx
Gas measurement O2,Co2,& ph) 04/2024.pptxGas measurement O2,Co2,& ph) 04/2024.pptx
Gas measurement O2,Co2,& ph) 04/2024.pptx
 
Keynote by Prof. Wurzer at Nordex about IP-design
Keynote by Prof. Wurzer at Nordex about IP-designKeynote by Prof. Wurzer at Nordex about IP-design
Keynote by Prof. Wurzer at Nordex about IP-design
 
Introduction to AI in Higher Education_draft.pptx
Introduction to AI in Higher Education_draft.pptxIntroduction to AI in Higher Education_draft.pptx
Introduction to AI in Higher Education_draft.pptx
 
OS-operating systems- ch04 (Threads) ...
OS-operating systems- ch04 (Threads) ...OS-operating systems- ch04 (Threads) ...
OS-operating systems- ch04 (Threads) ...
 
Computed Fields and api Depends in the Odoo 17
Computed Fields and api Depends in the Odoo 17Computed Fields and api Depends in the Odoo 17
Computed Fields and api Depends in the Odoo 17
 

Form, function, and evolution of living organisms

  • 1. Form, function, and evolution of living organisms Jayanth R. Banavara,1 , Todd J. Cookeb,1 , Andrea Rinaldoc,d,1,2 , and Amos Maritane,1 a Department of Physics and b Department of Cell Biology and Molecular Genetics, University of Maryland, College Park, MD 20742; c Laboratory of Ecohydrology, École Polytechnique Fédérale de Lausanne, CH-1015 Lausanne, Switzerland; d Dipartimento di Ingegneria Civile, Edile e Ambientale, Universitá di Padova, I-35131 Padova, Italy; and e Dipartimento di Fisica e Astronomia, Consorzio Nazionale Interuniversitario per le Scienze fisiche della Materia and Istituto Nazionale di Fisica Nucleare, Universitá di Padova, I-35131 Padova, Italy Contributed by Andrea Rinaldo, January 22, 2014 (sent for review November 13, 2013) Despite the vast diversity of sizes and shapes of living organisms, life’s organization across scales exhibits remarkable commonali- ties, most notably through the approximate validity of Kleiber’s law, the power law scaling of metabolic rates with the mass of an organism. Here, we present a derivation of Kleiber’s law that is independent of the specificity of the myriads of organism species. Specifically, we account for the distinct geometries of trees and mammals as well as deviations from the pure power law behavior of Kleiber’s law, and predict the possibility of life forms with ge- ometries intermediate between trees and mammals. We also make several predictions in excellent accord with empirical data. Our theory relates the separate evolutionary histories of plants and animals through the fundamental physics underlying their distinct overall forms and physiologies. allometric scaling | biological scaling | tree geometry | fractal Understanding the origin and evolution of the geometries of living forms is a formidable challenge (1, 2). The geometry of an object can be characterized by its surface−volume re- lationship—the surface area S of an object of volume V can scale at most as S ∼ V and at least as S ∼ V2=3 (3). These geometries have been used by nature in space-filling trees and animals, respectively. Here, our principal goal is to explore how it is that both geometries of life coexist on Earth, whether intermediate geometries are possible, and what all this implies for evolution of life on Earth. Living organisms span an impressive range of body mass, shapes, and scales. They are inherently complex, they have been shaped by history through evolution and natural section, and they continually extract, transform, and use energy from their environment. The most prevalent large multicellular organisms on Earth, namely plants and animals, exhibit distinct shapes, as determined by the distribution of mass over the volume. Animals are able to move and are approximately homogeneous in their mass distribution—yet they have beautiful fractal transportation networks. Plants are rooted organisms with a heterogeneous self- similar (fractal) geometry—the mass of the tree is more con- centrated in the stem and branches than in the leaves. The approximate power law dependence of the metabolic rate, the rate at which an organism burns energy, on organism mass has been carefully studied for nearly two centuries and is known as allometric scaling (4–32). From the power law behavior, with an exponent around 3/4, one can deduce the scaling of charac- teristic quantities with mass and, through dimensional analysis, obtain wide-ranging predictions often in accord with empirical data. However, what underlies this ubiquitous quarter-power scaling, and with a dominant exponent of 3/4? In an influential series of papers, West and coworkers (11, 12, 14–16) suggested that fractality was at the heart of allometric scaling. Inspired by these papers, a contrasting view was pre- sented (13), which argued that, although fractal circulatory net- works may have advantages, quarter-power scaling came built in with the directed transport of nutrients. However, this latter paper was necessarily incomplete because it did not address the distinct geometries of animals and trees. More recently, mem- bers of both groups joined together to construct explicit models for animals, which showed (24) that “quarter-power scaling can arise even when there is no underlying fractality.” Here, we take a fresh look at the problem and derive quarter-power scaling quite generally for all living organisms. We then turn to a consideration of the sharp differences in the geometries of animals and trees and argue that the evolution of organ- ismal forms follows from a rich interplay of geometry, evolu- tionary history, developmental symmetry, and efficient nutrient acquisition. Despite their independent evolution and different metabo- lisms, vascular plants and bilaterian animals share major design features, namely, an internal mass comprising organized cells capable of metabolic and bioenergetic activities, a transport mechanism for distributing molecules and energy within itself, and a surface capable of exchanging matter and energy with the environment. Regardless of the shape differences observed be- tween these two groups, the physics associated with the trans- formation, transport, and exchange of matter and energy must unavoidably impose physical constraints on their designs. An organism is akin to an engine—part of the energy obtained from nourishment is used for organism function, growth, re- production, while the rest is dissipated through its surface. We consider the hypothesis of the survival of the fittest in terms of energy metabolism and postulate that an organism with a higher energy intake would have a competitive advantage over another organism of similar mass performing energetically suboptimally, and explore its consequences. Consider an isotropic 3D organism of spatial extent h whose volume V scales as V ∝ h3 . Generalization to organisms with distinct scaling along the three different directions is straight- forward. We make the simplifying assumption that the con- sumption and metabolic activity is distributed uniformly in space and in time or suitable averaging is used. We denote the basal metabolic rate of the organism by B and its mass by M. B is Significance Understanding the origin and evolution of the shapes ob- served in nature remains an exciting challenge. Even from a cursory inspection, it is clear that the shapes of animals and plants, as determined by the distribution of mass over vol- ume, are distinct. Animals are able to move and are ap- proximately homogeneous in their mass distribution. Plants are rooted organisms endowed with heterogeneous self- similar geometry where the mass is concentrated in the stem and branches rather than in the leaves. By addressing the fundamental physics underlying the relation between form and physiology and the origins of Kleiber’s law, we discuss how the two divergent life forms of plants and animals may have independently evolved to achieve equivalent energetic efficiencies. Author contributions: J.R.B., T.J.C., A.R., and A.M. designed research, performed research, contributed new reagents/analytic tools, analyzed data, and wrote the paper. The authors declare no conflict of interest. Freely available online through the PNAS open access option. 1 J.R.B., T.J.C., A.R., and A.M. contributed equally to this work. 2 To whom correspondence should be addressed. E-mail: andrea.rinaldo@epfl.ch. 3332–3337 | PNAS | March 4, 2014 | vol. 111 | no. 9 www.pnas.org/cgi/doi/10.1073/pnas.1401336111
  • 2. a measure of the energy being delivered to the organism per unit time and ought to be proportional to the energy dissipated through its surface. There is no evidence of size selection in empirical data, and this lends support to the assumption that the efficiency of the engine is independent of the organism’s size. We will derive Kleiber’s law based on energy intake considerations and study the role of geometry, as captured in the surface− volume relationship, on considering the expelled energy. Our goal is to understand the ideal dependence of B on M in the scaling regime. The characteristic time scale associated with the organism is known to scale as M=B—it is a measure of how long it would take for energy proportional to M to be dissipated at a rate of B. Henceforth, proportionality constants, which serve to fix the correct units of various quantities related through scaling relations, will be omitted for the sake of simplicity. The number of metabolites, N, consumed in the organism per unit time is proportional to B. Let us define N = L3 , so that a single metabolite is consumed per unit time in the local region surrounding each site of an L × L × L grid. Each of these sites can be thought of as being within a service volume, in which one metabolite is consumed per unit time, of linear spatial extent h=L ∼ ðV=BÞ1=3 . At the local level, the metabolites need to be transported this distance over unit time, and one immediately finds (24) that the transport velocity v ∼ h=L ∼ ðV=BÞ1=3 . Another measure of the transport velocity is obtained by noting that it is a characteristic length scale of the organism divided by the cor- responding characteristic time scale and therefore scales as h=ðM=BÞ. Setting the two measures to be proportional to each other, one obtains Kleiber’s law B ∼ M3=4 . An alternative way of deriving the same result in a more rig- orous manner is through the consideration of the properties of efficient transportation networks. The goal is to determine the minimum number of metabolites in transit, a measure of the organism mass, to ensure that L3 metabolites are delivered in unit time within the organism volume. One can prove that the mass scales at least as L4 with the optimality arising for efficient directed networks with no large-scale backtracking (13). This again leads to Kleiber’s law. Remarkably, the idealized metabolic rate−mass relationship is predicted to be algebraic with a 3=4 exponent independent of the geometry of the organism. Such competitive equivalence explains the coexistence of animals with a homogeneous tissue density and fractal plants on Earth. The mass-specific metabolic rate, B=M, scales as M−1=4 , whereas the transit time scales as ∼ M1=4 . Indeed, characteristic biological rates (such as the heart beat and mutation rates) and characteristic biological times (such as circulation times or lifetimes) scale as M−1=4 and M1=4 , respectively (6, 7, 9–12, 14–16). Results and Discussion We now turn our attention to geometry and the constraints it imposes on the physiology of an organism. The link arises from the well-known observation that the metabolic rate is pro- portional to the surface area. The crucial point, which seems to have been overlooked in the literature, is that the proportionality constant includes the velocity of nutrient delivery and/or energy transport at the surface. Thus, the two quantities that determine the metabolic rate, B, are the surface area, S, and the velocity of transport at the surface, v: B ∼ Sv. A pure power law in the B – M relationship would be expected only when the product of the surface area and the transport velocity at the surface scales precisely as a power law of the organism mass. One would expect that the transportation ability at the surface could vary from species to species depending on the conditions of the surface as well as on ambient conditions. Thus, pure power law behavior would only hold in an idealized situation. The surface area of the organism, S, is given by B=v, and therefore S ∼ L3 =ðh=LÞ ∼ L4 =h. The surface area of an object of volume V can scale at most as S ∼ V or at least as S ∼ V2=3 . More generally, S ∼ Vx ∼ h3x with 2=3 < x < 1, and thus L4 ∼ h3x+1 . Noting that v ∼ h=ðM=BÞ, one finds that M ∼ hB=v ∼ Vð1+3xÞ=3 , v ∼ h=L ∼ Vð1−xÞ=4 , and B ∼ Vð1+3xÞ=4 . The V − B relationship is different for different geometries, leading to profound con- sequences for life (Table 1). The two limiting cases of geometry have been exploited by nature: x = 1 in trees, and x = 2=3 in animals. For a tree, the volume is all surface ðS ∼ VÞ with the leaves acting as terminal units from which water transported from the ground evaporates. The transport velocity is independent of the organism mass. This is convenient because water has to be transported upwards against gravity. The organism mass M ∼ h4 ∼ V4=3 and implies a density which increases with organ- ism mass (see Methods). This geometry is tantamount to an or- ganism in three dimensions having an effective dimensionality (12) of 4. Interestingly, a value lower than 3=4 of the metabolic rate− mass exponent is predicted if the tree is not isotropic, i.e., its crown diameter scales sublinearly with tree height (22). The mass of the tree is not uniformly distributed but rather is concentrated in the trunk and the branches in a self-similar manner (19, 20). Table 1. Summary of predictions of the theoretical analysis Tree, x = 1 Animal, x = 2=3 Intermediate geometry Metabolic rate 3=4 3=4 3=4 Characteristic length 1=4 1=3 1=ð3x + 1Þ Characteristic time 1=4 1=4 1=4 Characteristic rate −1=4 −1=4 −1=4 Organism volume 3=4 1 3=ð3x + 1Þ Transport velocity 0 1=12 3ð1 − xÞ=½4ð3x + 1ÞŠ Need for pump No Yes Yes Density 1=4 0 ð3x − 2Þ=ð3x + 1Þ Surface area 3=4 2=3 3x=ð3x + 1Þ Recirculation network No Yes Yes Fractality of organism Yes No Yes Service volume density 0 −1=4 9ðx − 1Þ=½4ð3x + 1ÞŠ Trunk radius 3=8 1=3 3x=½2ð3x + 1ÞŠ The geometry of the organism enters through the scaling of its surface area S with volume V, S ∼ Vx . The exponents characterize the scaling of the quantity in the first column with organism mass M. The idealized scaling of the basal metabolic rate, the characteristic time (as reflected in circulation times and life times), and the characteristic rate (such as mutation rates or pump rates) do not depend on the geometry and are universal. Many of the predictions for trees and animals have been observed empirically (10–12, 14–16, 19, 20). The results for organisms with intermediate geometry interpolate between the results for animals and trees. Banavar et al. PNAS | March 4, 2014 | vol. 111 | no. 9 | 3333 ENVIRONMENTAL SCIENCES
  • 3. In contrast, an animal has a uniform density—mass and vol- ume are proportional. The positive scaling (24) of the blood velocity with animal mass as M1=12 requires the presence of a pump, the heart (33, 34). A fractal tree is a rooted organism because of its branching, whereas the nonfractal animal has the advantage of being able to move. The density of service volumes is independent of tree volume, whereas it decreases with increase in animal size, as does the mitochondrial density. An organism with an intermediate geometry, although matching a tree and a mammal in metabolic efficiency, would require a complex circulation network because not all volume ele- ments lie at the surface. Such organisms would not be as easily mobile because of their fractal geometry, and require a pump because the transport velocity increases with organism mass as v ∼ Mð3−3xÞ=ð12x+4Þ . Table 1 shows the key predictions of our anal- ysis and highlights the commonalities and differences between the geometries and physical attributes of plants and animals. Given the richness of nature’s adaptive strategies and differ- ences in life history, climate, metabolic strategies, and habitat of multicellular organisms, a remarkable result is that, despite devi- ations and variations, robust trends are observed in the relation- ship between metabolic rates and body mass. Fig. 1 shows interspecies log-log plots of the metabolic rate−mass relationships for trees [data from Mori et al. (21)] and mammals [from McNab (18) and presented in ref. 23]. Even though the curvatures of the two plots are distinct, in the large mass limit, both trees and mammals approximately follow Kleiber’s law B ∼ M3=4 , where B is the basal metabolic rate of an organism of mass M. The obser- vations of such scaling behavior have been accompanied by vig- orous debate on the specific form of the relationship as well as on the reasons underlying such behavior. Much of the debate has stemmed from the exponent value of 3=4. As noted above, the 3=4 exponent arises for a tree essentially from an effective di- mensionality of the tree being 4 instead of 3. How can the effective dimensionality of an object be greater than the dimensionality of space it resides in? The constraint of packing a mass (scaling as the tree volume to the 4=3 power) within the tree volume requires a density that scales as M1=4 . This is facilitated through a hetero- geneous distribution of mass over a range of scales. The mass of a tree is not uniformly distributed but is rather concentrated within the trunk and the branches. Denoting the tree height and trunk radius by h and rT, respectively, we obtain M ∼ h4 ∼ r2 Th or r2 T ∼ h3 and rT ∼ M3=8 . In order for this mass to be contained within a volume of size h3 , the mass M cannot be greater than ρh3 , and this can be satisfied only when h < hc, the upper cutoff scale for tree size. Here ρ is an upper bound on the density of a tree component and can be thought of as the mass density of the trunk. By definition, M = ~naveh3 where ~nave is the average mass den- sity (apart from a numerical factor that takes into account the specific tree geometry—the numerical factor is π=6 for a sphere of diameter h). Because M ∼ h4 , ~nave ∼ h (apart from a constant with units that fixes the correct dimensionality). From the obvi- ous bound ~nave < ρ, the trunk density, we deduce that hc = Kρ, where the constant K has units of length4 /mass. One would ex- pect that K would depend on details and not be universal. The h3 ∼ r2 T result is known to occur in two contexts: (i) It describes the relationship between tree height and diameter (see figure on p. 142 of ref. 6 for interspecies scaling, and figure on p. 143 for intraspecies scaling); and (ii) because of the self- similar nature of a tree, it also describes the tapering of a tree trunk (22). Interestingly, the tapering has been derived pre- viously (6) in a completely different manner using solid me- chanics by asking how tall a column of a given diameter could become before it buckles under its own weight. During the seedling stage of tree growth, most of the mass is composed of metabolically active tissues (17). When the mass of the leaves (which is responsible for the metabolism) accounts for a constant fraction of the total mass, M would be expected to be proportional to B. The crossover between the two distinct behaviors (M ∼ B and Kleiber’s M ∼ B4=3 ) can be simply captured by the expression M ∼ aB4=3 1 + b B1=3 ; [1] where b3 sets the scale of B at which the crossover occurs cor- responding to a crossover mass of ∼ ab4 . The distinct linear A B Fig. 1. Log-log plots of metabolic rate versus mass for trees and animals show deviations from pure power law behavior. The plot suggests that the curvatures (23) in the data sets are opposite to each other. Shigeta Mori (21) provided the tree data (A), and the mammal data (B) are taken from ref. 18. The curvatures are explained as arising from the crossover of exponent values. (A) The solid line shows a fit to M = aB4=3 ð1 + b=B1=3 Þ. The adjusted R2 value is 0.979, a = 2:10 with SE 0.220 and P value of 10−19 , and b = 0:315 with SE 0.0602 and P value of 10−6 . Interestingly, one obtains a leading exponent indistinguishable from 4=3 if one chooses to make it an adjustable parameter. (B) Motivated by the lack of con- sensus of the exponent associated with pure power law behavior of the meta- bolic rate with mass, Kolokotrones et al. (23) carried out extensive analysis of several data sets, principally one due to McNab (18), and showed that the data exhibit curvature on a log-log plot. The analysis was carried out twice, excluding and including the effects of body temperature on metabolic rate. In both cases, the authors used an empirical quadratic fit in which the logarithm of the met- abolic rate was expanded in terms of the logarithms of the body mass, measured in grams. The dashed line is a fit to B = bM 2=3 Mammalmaxð1,ðMMammal=M1Þ1=12 Þ. The adjusted R2 value is 0.961 comparable to the quality of fit presented in (23), b = 0:0241 with SE 4:410−4 and P value of 10−243 , and log10M1 = 2:63 with SE 0.162 and P value of 10−50 . 3334 | www.pnas.org/cgi/doi/10.1073/pnas.1401336111 Banavar et al.
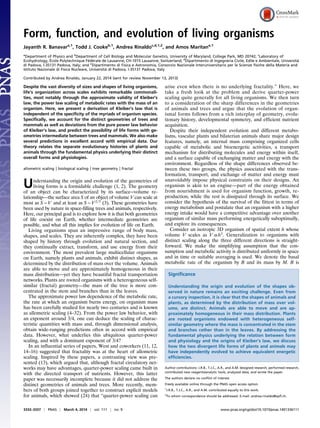
  • 4. scaling for juveniles was underscored by Reich et al. (17), and a somewhat similar crossover relationship was presented by Enquist et al. (29) and more recently by Mori et al. (21). Fig. 1A shows a log-log plot of B versus M for trees (data from ref. 21) along with a fit to Eq. 1. We now consider the other limiting case of organism geometry corresponding to a minimal surface area for a given volume: an animal with x = 2=3, S ∼ V2=3 , and M ∼ V ∼ h3 . To match the metabolic efficiency of animals with trees, one now requires v ∼ M1=12 . In the simple situation of a single velocity scale (i.e., the velocities in various parts of the mammal body all being proportional to each other with a proportionality constant in- dependent of organism mass), one would expect that the mean blood velocity also scales as M1=12 . This is supported by empirical data (9)—a velocity increasing with organism mass necessitates the use of a mechanical pump such as a heart. Unlike in trees, the service volumes being nourished in an animal do not all reside at its surface. Thus, one requires a more complex circu- lation network because, nonetheless, dissipation occurs at the surface. Unlike trees, which are fractal and rooted, compact organisms have the distinct advantage of being able to move. Again, assuming a single velocity scale, the aorta cross-sectional area ought to scale as the ratio of B to the transport velocity or as M2=3 . One would expect then that the aorta radius scales as M1=3 , again in accord with empirical data (24, 35). When Kleiber’s law holds, the mass-specific metabolic rate, B=M, scales as M−1=4 , whereas the transit time scales as h=v ∼ V1=3 = ðV=BÞ1=3 ∼ B1=3 ∼ M1=4 . The linear size of the service volume and the transport velocity at the surface become smaller in an animal as its mass decreases. One would therefore expect that below a certain threshold mass, M1, mechanisms such as diffusion, which are body mass independent (recall that the velocity in trees is indeed in- dependent of mass), become operative. Our approach allows A B Fig. 2. Consensus phylogenetic trees for the evolution of the major lineages of modern plants (A) and animals (B) underscore the role of physics as a major selective pressure for driving the evolution of the design of multicellular organisms. (Adapted from refs. 36, 39, and 40.) The origins of the major innovations in organismal form are also plotted on these trees. The earliest diverging lineages of multicellular animals (e.g., sponges and cnidarians) and of multicellular plants (e.g., bryophytes) lack complex transport tissues. The later-arising groups of vascular plants and bilateral animals evolved complex transport tissues, namely, xylem and phloem, and circulatory systems, respectively. In terms of species numbers, vascular plants and bilateral animals dominate modern eco- systems, but it is important to consider the simpler forms of the basal lineages to understand the selection pressures driving the evolution of complex or- ganismal forms. Organism drawings are intended to associate the names of different groups with representative organisms. Due to their size range of 7 orders of magnitude, they are not presented in proper scale. seg, segmentation. (Reprinted by permission of Pearson Education, Inc., Upper Saddle River, NJ.) Banavar et al. PNAS | March 4, 2014 | vol. 111 | no. 9 | 3335 ENVIRONMENTAL SCIENCES
  • 5. one to incorporate velocity variation with organism size in a natural way leading to: B ∼ S  v ∼ M 2=3 Mammalmax 1; ðMMammal=M1Þ 1 12 : [2] Fig. 1B shows a log-log plot of mammal metabolism data [from McNab (18) and presented in ref. 23] along with a fit to Eq. 2. In this simple scenario, the opposite curvatures in a log-log plot of B versus M arise because the exponent crosses over from 1 to 3=4 as tree size increases whereas the crossover occurs from 2=3 to 3=4 as mammal mass goes up. We turn now to a discussion of the prevalence of separate convergent forms in animals and plants, which is diagnostic of physical and metabolic factors serving as selective pressures affecting the overall evolution of form. Developmental per- spectives (36–38) provide the fundamental insight that the pat- terns of organismal symmetry are established during the earliest developmental stages for most multicellular organisms, including plants and animals. Subsequently, these organisms often grow into complex forms through independently evolved mechanisms including modularity, fractal structure, and segmentation. De- spite the diversity of life forms, the approximate validity of Kleiber’s law (4, 6, 7, 9–25) provides a remarkable unifying feature. This allometric scaling pertains to biological structures ranging from unicellular organisms to the tallest trees and has direct implications for characteristic rates and time scales. Animals and plants evolved from different ancestral unicel- lular eukaryotes (37), and their characteristic developmental symmetries, transport systems, and complex forms have evolved independently from each other (Fig. 2). Interestingly, basal lineages of either plants or animals do not exhibit the characteristics of transport tissues and complex structures observed in later-evolved species of both groups. This implies that various selection pressures, including physical constraints, have been favoring the evolution of overall forms and transport structures that are better adapted to carry out particular energetic strategies. Bilaterian animals with circulatory systems are characterized by higher metabolic and transport rates than simpler basal ani- mals, such as barrel sponges and large cnidarians, of the same mass. In the fruit fly Drosophila, a gene called tinman functions as the master control switch for initiating the development of the simple insect heart. Despite the profound differences in the circulatory systems and cardiac structures of insects vs. verte- brates, the homologous gene designated as Nkx2 − 5 plays the same role in vertebrate heart development (33). The presence of these homologous genes and associated regulatory networks in the principal bilaterian lineages argues that the bilaterian com- mon ancestor had evolved a major innovation in animal design, namely a rudimentary circulatory system having a pump whose development was regulated by the ancestral tinman=Nkx2 − 5 gene (34). The earliest plants evolved from simple algal relatives to be- come the first successful multicellular invaders of terrestrial environments. They—and their modern bryophyte descendants— lack complex transport systems, i.e., water-conducting xylem and sugar-conducting phloem. In a manner analogous to what hap- pened in animal evolution, the evolution of these complex transport systems in vascular plants accompanied a dramatic change in organismal form (36, 38). Then several lineages of early vascular plants independently evolved bilateral leaves specialized for photosynthesis and evapotranspiration, as well as cylindrical roots specialized for water and ion absorption (36, 38). The basic form of these ancient plants is replicated by the fractal stem and root systems of modern plants. Interestingly, this fractal form has permitted many vascular plant lineages to achieve great heights, as evidenced by repeated evolution of tree- like plants ranging from the arborescent lycopods and horsetails in Carboniferous forests 360–300 million years ago to the co- niferous and angiosperm trees of today (38). Furthermore, the evolution of space-filling leaves has allowed vascular plant trees to effectively improve their energetic efficiency. Methods We postulate that Kleiber’s law represents a central tendency capturing joint fluctuations in the measurement protocol of metabolic rates (26) (field, basal, maximum, etc.) and body sizes (27). To illustrate the key mathematical idea, we present an analytic derivation of Kleiber’s law for the idealized situation of a spherical organism of radius h and volume V = ð4=3Þπh3 . Consider an organism in steady state uniformly nourished from a single source located at its center. Denoting the metabolic rate as B, the source produces B metabolites per unit time. The amount of nutrients consumed per unit volume in unit time is therefore given by B=V. Let ~nðrÞ and vðrÞ denote the density of metabolites and their velocity at position r (measured from the center) within the organism (metabolites are carried in a fluid). The current of metabolites is then given by: JðrÞ = ~nðrÞvðrÞ, [3] with JðrÞ = 0 at the boundary, i.e., at jrj = h, because the nutrients are all used within the organism. The uniform nourishment of the organism leads to the conservation law: divJðrÞ = − B=V: [4] Note that the metabolically active sites (the leaves) are distributed uniformly in a tree just as the metabolically active tissues are distributed uniformly in an animal—it is the mass of the tree which is inhomogenously distributed, unlike in an animal. As a byproduct of this nourishment, heat is generated uniformly within the organism, which is then dissipated at its surface. This heat is transported from within the organism by the fluid, and the nonzero velocity at the surface plays a pivotal role. Solving Eq. 4 with the condition of no flow at the boundary, one obtains jJðrÞj = B h3 − r3 3Vr2 , [5] where r = jrj. One can proceed to derive Kleiber’s law from the above equation by recalling that the mean velocity scales as the service volume length (24), ðV=BÞ1=3 . The mean velocity can also be deduced using Eq. 3 and the definition: Æjvjæ = Z ~nðrÞjvðrÞjd3 r Z ~nðrÞd3 r ~ Z jJðrÞjd3 r M : [6] Equating the two measures of the mean velocity, one finds universally, for animals and trees as well as intermediate life forms, Kleiber’s law. Of course, deviations from the 3=4 exponent would arise when the two measures of the velocity do not coincide. An exact result pertaining to the behavior of optimal directed networks has been presented as supplementary material in ref. 13. ACKNOWLEDGMENTS. We are grateful to Tommaso Anfodillo, Jim Brown, Marco Cagnazzo, Marco Carrer, John Damuth, Shigeta Mori, Melanie Moses, Filippo Simini, Igor Volkov, Dave Weiss, and Mario Zago for useful discussions and assistance. We acknowledge financial support from the Cariparo Foundation and the European Research Council advanced grant program through the project RINEC-227612. 1. D’Arcy Thompson W (1992) On Growth and Form (Cambridge University Press, Cambridge, UK). 2. Ball P (2009) Shapes: Nature’s Patterns (Oxford University Press, New York). 3. Mandelbrot BB (1983) The Fractal Geometry of Nature (Freeman, San Francisco). 4. Kleiber M (1932) Body size and metabolism. Hilgardia 6:315–353. 5. Von Bertalanffy L (1957) Quantitative laws in metabolism and growth. Q Rev Biol 32(3):217–231. 6. McMahon TA, Bonner JT (1983) On Size and Life (Scientific American, New York). 7. Peters RH (1983) The Ecological Implications of Body Size (Cambridge University Press, Cambridge, UK). 3336 | www.pnas.org/cgi/doi/10.1073/pnas.1401336111 Banavar et al.
  • 6. 8. Barenblatt GI, Monin AS (1983) Similarity principles for the biology of pelagic animals. Proc Natl Acad Sci USA 80(11):3540–3542. 9. Calder WA (1984) Size, Function and Life History (Harvard University Press, Cam- bridge, MA). 10. Schmidt-Nielsen K (1984) Scaling: Why Is Mammal Size So Important? (Cambridge University Press, Cambridge, UK). 11. West GB, Brown JH, Enquist BJ (1997) A general model for the origin of allometric scaling laws in biology. Science 276(5309):122–126. 12. West GB, Brown JH, Enquist BJ (1999) A general model for the structure and allometry of plant vascular systems. Nature 399(6745):664–667. 13. Banavar JR, Maritan A, Rinaldo A (1999) Size and form in efficient transportation networks. Nature 399(6732):130–132. 14. West GB, Brown JH, Enquist BJ (1999) The fourth dimension of life: Fractal geometry and allometric scaling of organisms. Science 284(5420):1677–1679. 15. West GB, Woodruff WH, Brown JH (2002) Allometric scaling of metabolic rate from molecules and mitochondria to cells and mammals. Proc Natl Acad Sci USA 99(1, Suppl 1):2473–2478. 16. Brown JH, Gillooly JF, Allen AP, Savage VM, West GB (2004) Toward a metabolic theory of ecology. Ecology 85(7):1771–1789. 17. Reich PB, Tjoelker MG, Machado JL, Oleksyn J (2006) Universal scaling of respiratory metabolism, size and nitrogen in plants. Nature 439(7075):457–461. 18. McNab BK (2008) An analysis of the factors that influence the level and scaling of mammalian BMR. Comp Biochem Physiol A Mol Integr Physiol 151(1):5–28. 19. West GB, Enquist BJ, Brown JH (2009) A general quantitative theory of forest struc- ture and dynamics. Proc Natl Acad Sci USA 106(17):7040–7045. 20. Enquist BJ, West GB, Brown JH (2009) Extensions and evaluations of a general quantitative theory of forest structure and dynamics. Proc Natl Acad Sci USA 106(17): 7046–7051. 21. Mori S, et al. (2010) Mixed-power scaling of whole-plant respiration from seedlings to giant trees. Proc Natl Acad Sci USA 107(4):1447–1451. 22. Simini F, Anfodillo T, Carrer M, Banavar JR, Maritan A (2010) Self-similarity and scaling in forest communities. Proc Natl Acad Sci USA 107(17):7658–7662. 23. Kolokotrones T, Van Savage, Deeds EJ, Fontana W (2010) Curvature in metabolic scaling. Nature 464(7289):753–756. 24. Banavar JR, et al. (2010) A general basis for quarter-power scaling in animals. Proc Natl Acad Sci USA 107(36):15816–15820. 25. Pawar S, Dell AI, Savage VM (2012) Dimensionality of consumer search space drives trophic interaction strengths. Nature 486(7404):485–489. 26. Dodds PS, Rothman DH, Weitz JS (2001) Re-examination of the “3/4-law” of metab- olism. J Theor Biol 209(1):9–27. 27. Giometto A, Altermatt F, Carrara F, Maritan A, Rinaldo A (2013) Scaling body size fluctuations. Proc Natl Acad Sci USA 110(12):4646–4650. 28. Banavar JR, Damuth J, Maritan A, Rinaldo A (2002) Supply-demand balance and metabolic scaling. Proc Natl Acad Sci USA 99(16):10506–10509. 29. Enquist BJ, et al. (2007) Biological scaling: Does the exception prove the rule? Nature 445(7127):E9-E10, and discussion (2007) 445:E10-E11. 30. Glazier DS (2007) Metabolic level and size scaling of rates of respiration and growth in unicellular organisms. Funct Ecol 23(5):963–968. 31. Dodds PS (2010) Optimal form of branching supply and collection networks. Phys Rev Lett 104(4):048702. 32. Marañón E, et al. (2013) Unimodal size scaling of phytoplankton growth and the size dependence of nutrient uptake and use. Ecol Lett 16(3):371–379. 33. Harvey RP (1996) NK-2 homeobox genes and heart development. Dev Biol 178(2): 203–216. 34. Olson EN (2006) Gene regulatory networks in the evolution and development of the heart. Science 313(5795):1922–1927. 35. Holt JP, Rhode EA, Holt WW, Kines H (1981) Geometric similarity of aorta, venae cavae, and certain of their branches in mammals. Am J Physiol 241(1):R100–R104. 36. Kenrick P, Crane PR (1997) The Origin and Early Diversification of Land Plants: A Cladistic Study (Smithsonian Institution, Washington, DC). 37. Baldauf SL, Roger AJ, Wenk-Siefert I, Doolittle WF (2000) A kingdom-level phylogeny of eukaryotes based on combined protein data. Science 290(5493):972–977. 38. Taylor TN, Taylor EL, Krings M (2009) Paleobotany: The Biology and Evolution of Fossil Plants (Elsevier, New York). 39. Reece JB, et al. (2011) Campbell Biology (Benjamin Cummings, New York), 9th Ed. 40. Tree of Life Web Project (2002) Bilateria, triploblasts, bilaterally symmetrical animals with three germ layers http://tolweb.org/Animals/2374/2002.01.01. Banavar et al. PNAS | March 4, 2014 | vol. 111 | no. 9 | 3337 ENVIRONMENTAL SCIENCES