postpartum newborn teaching record and reflection Lisa Tripp
EEB Group Ecology Report
1. Lisa Tripp
UID 303892770
EEB 100L Lab 2
Nov. 27, 2013
The Effect of Distance to Water Source on Plant Biodiversity
Introduction:
The relationship between plant species and water is extremely important for plant survival and
diversity. As 70% of the Earth’s surface is covered in water, it is vital for us to understand the effect of water
on one of our main food, shelter, and energy sources. Past studies have demonstrated the importance of water
for general plant survival, but equally important in the study of water-plant dynamics is the element of
biodiversity (Fader et. al. 2010). Studying and understanding this relationship is key to the need to maintain
biodiversity, as different plants have different water needs. Plant and water system interactions may also
serve as a model to help us as humans understand our own water needs, and understanding of these
interactions grow more and more relevant as global climate change may change fresh water source
availability (Gerten et. al. 2013).
One particularly suited system to study the effect of water on the diversity of plant species is the
California Temescal Canyon Gateway Park creek system. A large variety of plants grow in the temperate
climate area, and the plants in the area grow wild and are for the most part native (other than few invasive
species). Because the creek is the only water source in the area (the area is a non-maintained park), the creek
serves as a very controlled water source variable in the ecosystem.
To test the effect of water on the biodiversity in the Temescal Canyon creek ecosystem, we measured
the degree of biodiversity in reference to distance from the creek. Our hypothesis was that the shorter the
distance from the creek, the greater diversity in plant species will be observed. In this observational study,
the distance from the creek at which the biodiversity of plant species was measured served as the
independent categorical variable, and the degree of biodiversity of plant species measured served as the
dependent interval variable (as the amount of biodiversity may depend on distance from water).
2. Experimental Methods:
To perform this experiment, we collected data in the Temescal Canyon Gateway Park in the Pacific
Palisades of California. We collected our data from alongside a creek at the southernmost end of the
canyon, parallel to Temescal Canyon Road, about 30 yards into the trail.
The object of the experiment was to collect species biodiversity data, so we did not focus on any one
species in particular. Species that we did see included vine-like species and grasses, some of which were
crawling, and which grew to an average height of six inches. All evidence of plant life was included,
whether dead or alive. We collected data on the number of species rather than the quantity of individuals
in the area.
Equipment used in this experiment included transects (one for each replicate group, totaling four
replicate groups), as well as 0.5m2 quadrats (one for each replicate group, totaling four replicate groups),
flags to mark where measurements were already taken, and the human eye to count species within the
quadrats.
To conduct the experiment, we split our class into four groups. Each of the four groups performed four
measurements close to the creek (0m away, with the edge of the quadrat laying on and parallel to the
creek edge), and four measurements away from the creek (1m away, with the edge of the quadrat laying
on the transect and parallel to the creek edge). Distance from the creek was determined by laying the
transect perpendicular to the edge of the creek moving outward. Once we arrived at the location and split
into groups, each working at different sections of the creek, we randomly chose four sites per group
along the creek (with a plant-presence bias) in our group’s section. We then measured out 0m from the
creek and 1m from the creek using the transect, and placed the quadrat at these distances in these four
different sites. We then used the human eye to count and record the number of species within the
3. quadrat at these sites and distances. After measuring the biodiversity at a site and distance, we flagged
the area to avoid repeat measurements. In total among the four groups, 16 measurements were taken 0m
away from the creek, and 16 measurements were taken 1m away from the creek.
To analyze our data, we used the JMP statistical software and performed a T-test, as our variables were a
dependent interval variable of number of species and an independent categorical variable of distance
from the creek (0m or 1m).
Results:
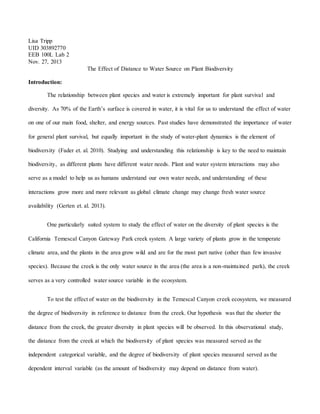
The results of this experiment indicate that distance from the creek did significantly affect the degree of
biodiversity in the Temescal Canyon creek ecosystem. The T-test ran on the results of this study yielded
a p-value of 0.0354, statistically demonstrating the significance of the difference in the degree of
biodiversity between the two sets of results (0m from the creek and 1m from the creek) (figure 1). Not
only did the T-test reveal a significant difference in the average degree of biodiversity, but also in the
range of species richness, with a range of species richness 0m from the creek of 4, and a range 1m from
the creek of 3 (figure 1). On average, both the species richness and the range of species richness closer
to the creek were greater than away from the creek.
Discussion:
In this study, areas in close proximity to the Temescal Canyon creek contained on average a greater
degree of biodiversity and a greater range of species richness in comparison to areas further away from the
creek. From our statistical analysis, we have sufficient evidence in order to reject the null hypothesis that
there is no significant difference between the two experimental groups. Our statistical analysis supports the
hypothesis that the shorter the distance from the creek, the greater the level of biodiversity.
4. This study was reliable because it took place in a wild, natural environment in which variables were
not manipulated. The reliability of the results of this experiment could have been increased by using a greater
number of replicates, data collection at more distance increments from the creek, and elimination of the plant
presence bias. A greater number of replicate locations along the creek in this experiment could have
eliminated the effects of any outlier locations, and could have served as a better representation of the system
as a whole. Data collection at more distance increments along the creek could have indicated more about the
possible existence of a biodiversity gradient, and could reveal specific points of significant change.
Additionally, eliminating the plant presence bias could have produced more accurate, objective results.
Although this experiment did demonstrate an increase in the degree of biodiversity closer to the
creek, further studies could be done to both increase the reliability of the study results, and further investigate
other possible variables and effects. Such studies could address other possible factors affecting this system
such as the presence of invasive species, the presence of sunlight, the temperature close to and away from the
water source, and could look at additional systems other than the Temescal creek ecosystem.
In summary, areas in closer proximity to the creek exhibit a greater level of biodiversity in
comparison to areas away from the creek. In a larger ecological context, it can be deduced that other creek
ecosystems may exhibit the same sort of trend, and in even more general terms, this study demonstrates the
importance of a water source in the development of species diversity. This study demonstrates
commonalities discovered in similar ecosystems, and adds valuable evidence to our overall understanding of
plant-water dynamics (Knapp 2002).
5. Figure 1: Species richness sorted by distance from the creek. Species richness was on average higher
closer to the creek. The range of species richness was also on higher closer to the creek.
Literature Cited:
Fader, Marianela, Stefanie Rost, and Christoph Muller. "Virtual Water Content of Temperate Cereals and
Maize: Present and Potential Future Patterns." Journal of Hydrology 384.3-4 (2010): 218-31.
Gerten, Dieter, Wolfgang Lucht, Sebastian Ostberg, and Jens Heinke. "Asynchronous Exposure to Global
Warming: Freshwater Resources and Terrestrial Ecosystems."Environmental Research Letters 8.3
(2013): 18-26.
Knapp, Alan, Fay Phillip, John Blair, Scott Colins, Melinda Smith, Jonathan Carlisle, Christopher Harper,
Brett Danner, Michelle Lett, and James McCaran. "Rainfall Variability, Carbon Cycling, and Plant
Species Diversity in a Mesic Grassland."Science 298.5601 (2002): 2202-205.