CaBA Startup Conference 02 - A response to the challenge from the third sector
Macroinvertebrate_Poster_Katie_Senior_Research
1. Macroinvertebrates are significant determinants of stream health based upon their sensitivity
to pollution. Our study utilized passive and active methods of macroinvertebrate collection at
sites on the upper main stem of the Susquehanna River along a transect line that straddled Byers
Island near Shamokin Dam, PA. The collection and identification of these organisms to family
classification allowed us to determine pollution tolerance values and other comparative metrics.
The Shannon Diversity and Hilsenhoff Biotic Indices reflected the absence of pollution-intolerant
taxa. The Bray-Curtis similarity index confirmed our analysis of the indices. Based upon the
EPA’s definition of the strengths and weaknesses for each method, the results of the collection
were explained. Overall, the metrics did not highlight one technique over another, but rather
supported the practice of using both passive and active collection in order to observe the
macroinvertebrate community thoroughly.
Passive and Active Macroinvertebrate Collection Method Assessment along Adjacent Reaches
of the Susquehanna River
Department of Biology, Susquehanna University, 514 University Avenue, Selinsgrove, PA 17870
Katherine Guild*, Michael Bilger, and Jack Holt
Figure 2: Image of Byers Island and site locations
along the Susquehanna River.
Field Methods (Flotemersch et al. 2006)
Passive Methods
• Six rock baskets filled with limestone rock and another six baskets filled with river rock were
deployed at sites 1 and 2.
• In a diamond formation, two baskets of each substrate were placed at the top three points
• Three Hester-Dendy multiplate traps were attached to a cement block at the southernmost point
of the diamond.
• The baskets were monitored for 4.5 weeks before collection.
• Using a sieve bucket, rock baskets and Hester-Dendy samplers were cleaned of invertebrates,
which were stored in 95% ethanol.
Active Methods
• Along the allotted 500m reaches on either side of the river, Serber samplers and D-frame nets
were used.
• Nets were positioned facing upstream and rakes were used to ‘kick’ the substrates
• Ten sample substrates: one shoreline vegetation, three fine sediment, and six cobble
• Total of 0.15m2 area per reach were ‘kicked’
• Collected organisms were placed into labeled containers of 95% ethanol
Laboratory Methods
• Samples organisms were separated and identified to family using Merritt et al. (2008), Peckarsky
et al. (1990), and Voshell (2002).
• Pollution Tolerance Index (PTI) values were assigned based on Family (Hilsenhoff 1988).
• Using the Pennsylvania Department of Environmental Protection’s Bethic Index of Biotic
Integrity (2009), the following metrics were employed: Shannon Diversity Index, Hilsenhoff
Biotic Index, and Percent EPT
• Benthic macroinvertebrates are significant indicators of
stream health (Flotemersch et al. 2006) and integrate
environmental conditions over annual cycles.
• Diversity of the benthic macroinvertebrate community
allows for stress tolerances for pollution to be assigned
(Hilsenhoff 1988).
• Non-wadeable river have rarely been monitored due to
high variability between reaches and complex substrate
mosaic (Flotesmerch, et al. 2006).
• Passive methods of biomonitoring benthic
macroinvertebrates include artificial habitats using
natural substrates that they colonize until collection
(Johnson et al. 2006).
• Active methods include disturbing the substrates using
D-frame nets and Serber samplers utilizing stream flow
to capture macroinvertebrates.
• Our research focuses on the comparison of five
macroinvertebrate collection methods along the same
reach of a non-wadeable river
• Sites 1-2 are accessible through Shady Nook in
Hummel’s Wharf, PA about seven kilometers below
the confluence of the North and West branches of
the Susquehanna River (Figure 2).
• Both sites are below the Adam T. Bower inflatable
dam and low head dams.
Passive Collection Sites
• Site 1 receives water from the West branch.
• Site 2 receives water from the North branch.
Active Collection Sites
• Six more sites were designated 50m above the
primary sites stretching across a 500m reach.
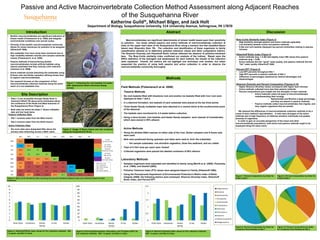
Figure 5: Percent Ephemeroptera, Plecoptera, and Tricoptera (EPT) for
five collection methods. Site 1 is green, and Site 2 is blue.
Figure 3: Bray-Curtis Similarity Index showing the percent similarity between sites and methods based on taxa
frequency.
Figure 4: Hilsenhoff Biotic Index values for five collection methods. Site
1 is green, and Site 2 is blue.
Figure 6: Shannon Diversity Index values for five collection methods.
Site 1 is green, and Site 2 is blue.
Site Description
Introduction
Methods
•Bray-Curtis Similarity Index (Figure 3)
• High similarity amongst passive and active methods separately
• Low similarity between active and passive methods
• D-Net and rock baskets displayed top percent similarities relating to species
richness
•Hilsenhoff Biotic Index (Figure 4)
• Active methods (avg. = 4.39) had slightly lower HBI values than passive
methods (avg. = 5.08)
• Active methods fall into “good” water quality, and passive methods fall into
“fair” water quality (Hilsenhoff 1988)
•Percent EPT (Figure 5)
• Low EPT percents throughout Site 1
• High EPT percents in passive methods of Site 2
• Difference of percentages explained by method advantages and
disadvantages
•Shannon Diversity and Percent Composition (Figures 6-10)
• Higher Shannon Diversity values correspond with higher taxa richness.
• Active methods collected more taxa than passive methods
• Percent compositions give insight into the strengths of each methods
• Active methods collect all types of macroinvertebrates
notwithstanding their ecology
• Ephemeridae and Bivalvia a large percentage,
and they are absent in passive methods
• Passive methods collect macroinvertebrates that migrate, and
they neglect organisms that are sessile
We interpret the differences of macroinvertebrate collection methods to be a
cause of each method’s specialization. D-nets were strongest of the active
methods due to high frequency of relatively sensitive individuals and greater
diversity of organisms.
In order to gain an accurate perspective of the insect and other
macroinvertebrate populations, both active and passive methods ought to be
employed along the same reach.
Discussion
Figure 1: Collecting the rock baskets 4.5 weeks
after deployment before Hurricane Sandy
arrived.
Abstract
0
1
2
3
4
5
6
7
8
9
10
River Rock Limestone Hester
Dendy
D-net Serber
0
0.5
1
1.5
2
2.5
River Rock Limestone Hester
Dendy
D-net Serber
0
10
20
30
40
50
60
70
80
90
100
River Rock Limestone Hester
Dendy
D-net Serber
Figure 7: Percent Composition by Order for
D-Net at Site 1
Figure 8: Percent Composition by Order for
D-Net at Site 2
Figure 9: Percent Composition by Order for
Limestone Rock Baskets at Site 1
Figure 10: Percent Composition by Order
for Limestone Rock Baskets at Site 2
Site 1
Site 2
RR1 RR2 LS1 LS2 HD1 HD2 DN1 DN2 SS1
RR2 21.1
0-19.9%
Very low overlap
LS1 75.8 32.4
20- 39.9%
Low overlap
LS2 38.6 58.9 52
40-59.9%
Moderate overlap
HD1 38.1 55 49.3 45
60-79.9%
High overlap
HD2 14.2 39.4 24.3 23.4 48.7
80-100%
Very high overlap
DN1 36.2 7.2 31.9 12.7 13.7 4.9
DN2 25 7.5 23.7 14.2 15.9 5.4 68.8
SS1 14.3 12.4 16.1 9.2 17.4 10.4 60.2 58.9
SS2 8.1 26.5 18.8 15.3 24.5 41.7 12 12.4 19.1
RR- River rock
LS- Limestone
HD- Hester-Dendy
DN- D-net
SS- Serber sampler