More Related Content
Similar to Daily livestock report nov 15 2012
Similar to Daily livestock report nov 15 2012 (20)
More from joseleorcasita (20)
Daily livestock report nov 15 2012
- 1. Vol. 10, No. 222 / November 15, 2012
Market Comments US FEEDLOT INVENTORY
Feedlots with 1000+ Cattle, USDA, 000 head
Sharply higher feed costs have forced a dramatic 12,300
BEGINNING OF MONTH INVENTORIES, 000 HEAD
reduction in the number of cattle placed on feed. Since June,
when corn prices started their upward move, feedlots have reduced
11,800
feedlot cattle placements by almost 1.3 million head compared to
the previous year (if we include the average October estimate).
Some of this comparison may be skewed a bit by the fact that in 11,300
2011 feeders in the Southern Plains were forced to market calves
early due to drought pressures and lack of adequate pastures. This
10,800
year, pastures in the Southern Plains were somewhat better, which Range of
limited placements of light cattle from that region. Still, overall US Estimates and
Average
pasture and range conditions in 2012 were even worse than in 10,300
2011. Which brings us back to corn and other feeds. While drought
is a factor in pushing calves onto feedlots, it is not a determinant.
9,800
The matrix of feed, feeder cattle and live cattle prices is what deter- JAN FEB MAR APR MAY JUN JUL AUG SEP OCT NOV DEC
mines the pace of feedlot placements. Feedlot operators are adept
at running least cost formulations on their feed ingredients but 2007-11 Avg. 2011 2012
that becomes difficult when all feeds, corn, wheat, soy meal, DDGs,
hay, etc increase by double digits in a matter of weeks. Consider 000 HEAD GROWTH IN NUMBER OF CATTLE PLACED ON FEED
the following: Cash corn in October at $7.76/bu (KC basis) +22%, CHANGE VS. YEAR AGO, 000 HEAD
500
winter wheat at $9.69/bu (KC basis) +23%, soybean meal at $490/
ton +61%, DDGs at $290/ton (KC basis) +26%, and hay at all time
‐1.27 MM head
record highs. The drought and high feed costs have depressed feed- 300 since Jun
er cattle values but not enough to offset the entire increase in feed *includes Oct
analyst estimate
prices. Also, the volatility in live cattle markets and the inability of
100
the beef cutout to break over the $200/cwt. mark point to the fact
that beef supplies will need to decline further in order to bring a
margin back in the cattle feeding business. (100)
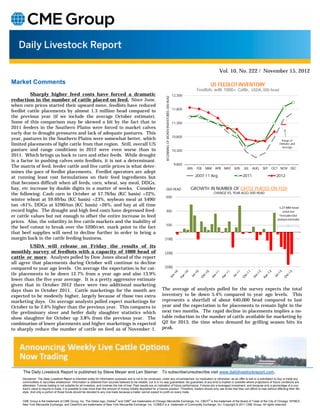
USDA will release on Friday the results of its
monthly survey of feedlots with a capacity of 1000 head of (300)
cattle or more. Analysts polled by Dow Jones ahead of the report
all agree that placements during October will continue to decline
compared to year ago levels. On average the expectation is for cat- (500)
tle placements to be down 12.7% from a year ago and also 13.9%
lower than the five year average. It is a pretty aggressive estimate
given that in October 2012 there were two additional marketing
days than in October 2011. Cattle marketings for the month are The average of analysts polled for the survey expects the total
expected to be modestly higher, largely because of those two extra inventory to be down 5.4% compared to year ago levels. This
marketing days. On average analysts polled expect marketings for represents a shortfall of about 640,000 head compared to last
October to be 2.6% higher than the previous year. This compares to year and the expectation is for placements to remain light in the
the preliminary steer and heifer daily slaughter statistics which next two months. The rapid decline in placements implies a no-
show slaughter for October up 3.8% from the previous year. The table reduction in the number of cattle available for marketing by
combination of lower placements and higher marketings is expected Q2 for 2013, the time when demand for grilling season hits its
to sharply reduce the number of cattle on feed as of November 1. peak.
The Daily Livestock Report is published by Steve Meyer and Len Steiner. To subscribe/unsubscribe visit www.dailylivestockreport.com.
Disclaimer: The Daily Livestock Report is intended solely for information purposes and is not to be construed, under any circumstances, by implication or otherwise, as an offer to sell or a solicitation to buy or trade any
commodities or securities whatsoever. Information is obtained from sources believed to be reliable, but is in no way guaranteed. No guarantee of any kind is implied or possible where projections of future conditions are
attempted. Futures trading is not suitable for all investors, and involves the risk of loss. Past results are no indication of future performance. Futures are a leveraged investment, and because only a percentage of a con-
tract’s value is require to trade, it is possible to lose more than the amount of money initially deposited for a futures position. Therefore, traders should only use funds that they can afford to lose without affecting their life-
style. And only a portion of those funds should be devoted to any one trade because a trader cannot expect to profit on every trade.
CME Group is the trademark of CME Group, Inc. The Globe logo, Globex® and CME® are trademarks of Chicago Mercantile Exchange, Inc. CBOT® is the trademark of the Board of Trade of the City of Chicago. NYMEX,
New York Mercantile Exchange, and ClearPort are trademarks of New York Mercantile Exchange. Inc. COMEX is a trademark of Commodity Exchange, Inc. Copyright © 2011 CME Group. All rights reserved.