OZ Metals 20141012
•
0 likes•249 views

Update on ASX listed junior and mid-cap mining companies

Recommended
More Related Content
What's hot
What's hot (20)
Similar to OZ Metals 20141012
Similar to OZ Metals 20141012 (20)
More from J-François Bertincourt
More from J-François Bertincourt (20)
OZ Metals 20141012
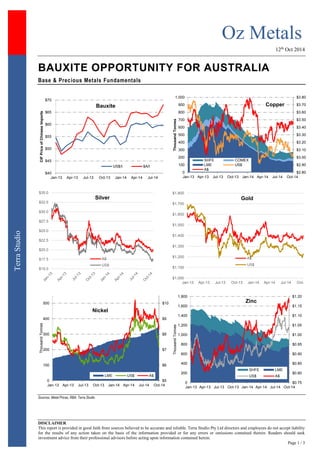
- 1. Oz Metals 12th Oct 2014 DISCLAIMER This report is provided in good faith from sources believed to be accurate and reliable. Terra Studio Pty Ltd directors and employees do not accept liability for the results of any action taken on the basis of the information provided or for any errors or omissions contained therein. Readers should seek investment advice from their professional advisors before acting upon information contained herein. Page 1 / 3 Terra Studio BAUXITE OPPORTUNITY FOR AUSTRALIA Base & Precious Metals Fundamentals Sources: Metal Prices, RBA, Terra Studio $40 $45 $50 $55 $60 $65 $70 Jan-13 Apr-13 Jul-13 Oct-13 Jan-14 Apr-14 Jul-14 CIF Price of Chinese Imports Bauxite US$/t $A/t $2.80 $2.90 $3.00 $3.10 $3.20 $3.30 $3.40 $3.50 $3.60 $3.70 $3.80 0 100 200 300 400 500 600 700 800 900 1,000 Jan-13 Apr-13 Jul-13 Oct-13 Jan-14 Apr-14 Jul-14 Oct-14 Thousand Tonnes Copper SHFE COMEX LME US$ A$ $15.0 $17.5 $20.0 $22.5 $25.0 $27.5 $30.0 $32.5 $35.0 Silver A$ US$ $1,000 $1,100 $1,200 $1,300 $1,400 $1,500 $1,600 $1,700 $1,800 Jan-13 Apr-13 Jul-13 Oct-13 Jan-14 Apr-14 Jul-14 Oct-14 Gold A$ US$ $5 $6 $7 $8 $9 $10 0 100 200 300 400 500 Jan-13 Apr-13 Jul-13 Oct-13 Jan-14 Apr-14 Jul-14 Oct-14 Thousand Tonnes Nickel LME US$ A$ $0.75 $0.80 $0.85 $0.90 $0.95 $1.00 $1.05 $1.10 $1.15 $1.20 0 200 400 600 800 1,000 1,200 1,400 1,600 1,800 Jan-13 Apr-13 Jul-13 Oct-13 Jan-14 Apr-14 Jul-14 Oct-14 Thousand Tonnes Zinc SHFE LME US$ A$
- 2. Oz Metals 12th Oct 2014 DISCLAIMER This report is provided in good faith from sources believed to be accurate and reliable. Terra Studio Pty Ltd directors and employees do not accept liability for the results of any action taken on the basis of the information provided or for any errors or omissions contained therein. Readers should seek investment advice from their professional advisors before acting upon information contained herein. Page 2 / 3 Terra Studio Markets & Majors Alcoa expects aluminium demand to outpace supply by 671,000 tonnes this year, down from a previous estimate of 930,000 tonnes. Anglo American plans to start the sale of non-core copper assets in Chile, including three mines and a smelter, as it shifts focus to more profitable operations in the country, Bloomberg News reported Oct. 7, citing people with knowledge of the matter. The assets, valued at US$1 billion, reportedly include the Mantoverde and Mantos Blancos mines, as well as the company's 50.1% interests in the El Soldado property and Chagres smelter. Aurubis, the biggest producer of refined copper in Europe, will charge higher copper premiums by 4.8% next year, Bloomberg News reported. The company will collect US$110 a metric tonne on top of the copper prices on the London Metal Exchange, up from US$105/t this year. Codelco is now considering a step-by-step expansion of the Andina mine (the largest of seven structural projects and the only project expected to increase the production of the state company, capex US$8.3 billion). The project is expected to be operational by 2023 and increase the copper production of the division by 343,000 tpa. Thomson Reuters - Commodities trader and miner Glencore has considered a secondary listing in Australia over the last year, eyeing the potential to tap a market with mining experience and captive funds, a source with direct knowledge of the matter said. Glencore listed on the London market in 2011, with a secondary listing in Hong Kong, marking the end of almost four decades as a privately held firm. It listed in South Africa late last year to attract funds trapped by caps on foreign investment. The World Gold Council called on the Indian government to find ways to mobilize and monetize up to 25,000 tonnes of gold held idle in Indian households and temples. This could reduce the government's reliance on imports in the next five years, according to the council. Deals & Transactions Australian molybdenum explorer Dart Mining received a A$13.5 million takeover bid from a Marshall Islands-registered company, which made an indicative and incomplete nonbinding cash-and-scrip offer of 6.5¢ per share. Western Areas signed agreements with Gunson Resources and Monax Mining allowing the company to acquire a 90% interest in key tenements in South Australia totalling about 2,746 km2. Western Areas could initially earn a 75% interest in Gunson's Fowlers Bay nickel project by spending A$800,000 within 2.5 years and in three tenements comprising Monax's Western Gawler Craton project by spending at least A$400,000 in 2.5 years as well. Nyrstar has sold a part of its future silver production at Port Pirie, South Australia to raise €79 million for the redevelopment of the lead smelter at the site, Metal Bulletin wrote. Silver Lake Resources will lease its Murchison gold mill and associated infrastructure to a private consortium for 10 months, starting by January next year. The company will receive a total of A$7.9 million for the initial lease term. Bauxite Sector Source: ASX Copper Producers Source: SNL Copper Developers & Explorers Source: SNL Code Company Name Close Price Week r YTD r 52 Week Range Market Cap (A$m) Cash (A$m) TEV (A$m) ABX Australian Bauxite 0.35 ▲ 21% 59% 44 2 42 BAU Bauxite Resources 0.13 ▲ 8% 8% 30 41 (11) CBX Cape Alumina 0.023 — 0% (23%) 6 1 4 Code Company Name Close Price Week r YTD r 52 Week Range Market Cap (A$m) Cash (A$m) TEV (A$m) TEV/ EBITDA ABY Aditya Birla Minerals 0.22 ▼ (9%) (37%) 67 137 (69) NM AOH Altona Mining 0.23 ▼ (2%) 39% 123 18 108 3.0x DML Discovery Metals 0.030 — 0% (43%) 19 5 139 2.4x HGO Hillgrove Resources 0.54 ▼ (6%) (25%) 80 16 94 2.3x KBL KBL Mining 0.040 ▼ (9%) (9%) 16 7 31 1.9x OZL OZ Minerals 3.68 ▼ (2%) 17% 1,117 364 962 5.2x PNA PanAust 1.77 ▼ (1%) (2%) 1,127 146 1,343 NA SFR Sandfire Resources 5.50 ▲ 0% (15%) 856 58 959 4.4x SRQ Straits Resources 0.005 — 0% (38%) 6 13 129 17.5x TGS Tiger Resources 0.24 ▼ (4%) (30%) 252 42 381 NA 985 CST Mining 0.007 ▲ 9% (30%) 189 146 33 NM 1208 MMG 0.41 ▼ (1%) 71% 2,194 154 4,109 4.5x 3993 China Molybdenum 0.71 ▼ (1%) 38% 6,164 347 6,880 NA MWE Mawson West 0.19 — 0% (67%) 33 54 28 NM Code Company Name Close Price Week r YTD r 52 Week Range Market Cap (A$m) Cash (A$m) TEV (A$m) ARE Argonaut Resources 0.019 ▲ 12% (20%) 8 2 5 AVB Avanco Resources 0.090 ▲ 3% 27% 150 32 117 AVI Avalon Minerals 0.004 ▼ (33%) (60%) 6 1 5 AZS Azure Minerals 0.024 — 0% (20%) 19 1 18 BMB Balamara Resources 0.065 — 0% (32%) 23 0 23 BTR Blackthorn Resources 0.27 ▲ 2% 2% 44 12 31 CDU CuDeco 1.39 ▼ (3%) (23%) 326 9 317 ENR Encounter Resources 0.23 ▼ (10%) 18% 30 4 26 ERM Emmerson Resources 0.032 ▼ (11%) (17%) 12 2 10 FND Finders Resources 0.160 — 0% (23%) 108 8 92 GCR Golden Cross Resources 0.105 ▲ 5% 5% 10 2 7 GPR Geopacific Resources 0.069 ▲ 8% 130% 20 3 20 HMX Hammer Metals 0.230 ▲ 5% (46%) 80 13 78 HAV Havilah Resources 0.069 ▲ 8% 130% 20 3 20 HCH Hot Chili 0.23 ▲ 5% (46%) 80 13 78 IAU Intrepid Mines 0.27 ▼ (2%) (14%) 151 11 (8) IRN Indophil Resources 0.28 — 0% 70% 337 215 128 KDR Kidman Resources 0.065 ▼ (7%) (65%) 7 3 5 KGL KGL Resources 0.25 ▲ 11% 133% 34 7 20 MEP Minotaur Exploration 0.16 ▼ (9%) 10% 24 5 20 MNC Metminco 0.016 ▼ (6%) (48%) 28 8 25 PEX Peel Mining 0.080 ▼ (13%) (69%) 11 3 7 RDM Red Metal 0.15 ▼ (14%) 0% 26 2 25 RXM Rex Minerals 0.24 ▼ (11%) (51%) 52 3 49 SMD Syndicated Metals 0.042 ▲ 11% 24% 12 2 9 SRI Sipa Resources 0.034 ▼ (11%) (39%) 12 2 9 SUH Southern Hemisphere 0.066 — 0% 33% 16 2 14 THX Thundelarra Resources 0.095 ▼ (5%) 150% 30 1 30 TLM Talisman Mining 0.12 ▼ (11%) 14% 16 16 (0) XAM Xanadu Mines 0.11 ▼ (12%) 120% 27 4 28
- 3. Oz Metals 12th Oct 2014 DISCLAIMER This report is provided in good faith from sources believed to be accurate and reliable. Terra Studio Pty Ltd directors and employees do not accept liability for the results of any action taken on the basis of the information provided or for any errors or omissions contained therein. Readers should seek investment advice from their professional advisors before acting upon information contained herein. Page 3 / 3 Terra Studio Gold Producers Source: SNL Gold Developers & Explorers Source: SNL Nickel Sector Source: SNL Zinc & Poly-metallic Sector Source: SNL For further information, please contact: JF Bertincourt m +61 406 998 779 jf@terrastudio.biz Code Company Name Close Price Week r YTD r 52 Week Range Market Cap (A$m) Cash (A$m) TEV (A$m) TEV/ EBITDA AGD Austral Gold 0.12 ▼ (8%) 0% 20 NA 80 6.8x ALK Alkane Resources 0.21 ▼ (5%) (40%) 85 16 69 10.2x AMI Aurelia Metals 0.36 ▲ 8% 54% 122 22 207 NM BDR Beadell Resources 0.36 ▼ (11%) (55%) 284 10 345 2.8x DRM Doray Minerals 0.49 ▼ (4%) (13%) 80 16 80 2.5x EVN Evolution Mining 0.74 ▲ 4% 20% 524 32 654 3.2x IGO Independence Group 4.06 ▼ (2%) 31% 951 57 922 6.6x KCN Kingsgate Consolidated 0.69 ▼ (3%) (22%) 154 54 254 NM KRM Kingsrose Mining 0.41 ▲ 9% 22% 147 7 153 NM LSA Lachlan Star 0.075 — 0% (63%) 11 2 28 10.5x MIZ Minera Gold 0.005 — 0% (29%) 12 0 17 NM MLX Metals X 0.21 ▼ (7%) 21% 339 57 283 4.0x MML Medusa Mining 0.72 ▼ (10%) (65%) 149 14 144 2.7x MOY Millennium Minerals 0.078 ▲ 1% (59%) 17 2 55 5.6x NCM Newcrest Mining 9.64 ▼ (6%) 24% 7,386 141 11,447 NM NGF Norton Gold Fields 0.13 ▼ (7%) (4%) 121 38 222 NA NST Northern Star Resources 1.21 ▼ (5%) 54% 711 82 634 7.6x OGC OceanaGold Corp. 2.45 ▲ 4% 46% 739 28 864 3.8x PGI PanTerra Gold 0.035 ▼ (8%) (15%) 29 6 94 4.7x PRU Perseus Mining 0.34 ▲ 3% 39% 179 37 149 26.9x RMS Ramelius Resources 0.045 ▼ (4%) (53%) 21 12 11 NM RRL Regis Resources 1.52 ▼ (5%) (48%) 757 7 791 NM RSG Resolute Mining 0.40 ▼ (10%) (28%) 256 19 288 2.7x SAR Saracen Mineral Holdings 0.33 ▼ (10%) 80% 258 36 236 5.6x SLR Silver Lake Resources 0.36 ▼ (8%) (34%) 179 24 168 NM SBM St Barbara 0.13 ▼ (10%) (50%) 63 79 324 NM TBR Tribune Resources 2.78 ▼ (6%) 19% 140 11 154 9.0x TRY Troy Resources 0.71 ▼ (4%) (10%) 138 43 135 NM UML Unity Mining 0.010 ▲ 25% (76%) 11 7 5 NM Code Company Name Close Price Week r YTD r 52 Week Range Market Cap (A$m) Cash (A$m) TEV (A$m) ABU ABM Resources 0.37 ▲ 1% 11% 100 10 90 AWV Anova Metals 0.040 ▼ (7%) 100% 9 1 7 AZM Azumah Resources 0.034 ▼ (3%) 21% 13 4 11 BAB Bullabulling Gold 0.078 — 0% 73% 27 4 25 BLK Blackham Resources 0.14 ▼ (7%) (21%) 16 1 16 BSR Bassari Resources 0.016 ▼ (6%) 100% 19 - 19 CHN Chalice Gold Mines 0.12 ▼ (4%) (15%) 33 44 (11) DCN Dacian Gold 0.32 ▼ (3%) 33% 23 11 12 EXG Excelsior Gold 0.063 ▼ (3%) (9%) 28 1 28 FML Focus Minerals 0.012 — 0% 0% 110 81 109 GCY Gascoyne Resources 0.15 ▼ (6%) 7% 25 1 24 GMR Golden Rim Resources 0.010 — 0% (9%) 11 1 12 GOR Gold Road Resources 0.25 ▼ (14%) 153% 148 10 139 GRY Gryphon Minerals 0.13 — 0% (26%) 50 34 15 IDC Indochine Mining 0.016 ▼ (11%) (63%) 19 0 21 KGD Kula Gold 0.078 ▲ 11% (26%) 12 3 12 MSR Manas Resources 0.027 ▼ (7%) (16%) 12 6 10 MUX Mungana Goldmines 0.145 ▲ 7% 437% 24 5 19 MYG Mutiny Gold 0.034 ▼ (3%) 8% 23 3 20 OBS Orbis Gold 0.42 ▲ 20% 68% 105 5 100 OGX Orinoco Gold 0.092 ▼ (8%) (28%) 11 1 12 PIR Papillon Resources 1.49 — 0% 52% 532 53 492 PXG Phoenix Gold 0.10 ▼ (7%) (37%) 36 9 27 RED Red 5 0.085 — 0% (3%) 65 38 26 RNI Resource & Investment 0.12 ▼ (11%) 126% 51 2 63 RNS Renaissance Minerals 0.069 ▼ (1%) 15% 28 2 26 SIH Sihayo Gold 0.018 — 0% (40%) 18 0 14 SXG Southern Cross Goldfields 0.013 ▲ 8% 0% 13 3 16 TAM Tanami Gold 0.015 ▼ (12%) (32%) 18 1 24 WPG WPG Resources 0.042 ▼ (9%) 45% 11 5 6 Code Company Name Close Price Week r YTD r 52 Week Range Market Cap (A$m) Cash (A$m) TEV (A$m) TEV/ EBITDA IGO Independence Group 4.06 ▼ (2%) 31% 951 57 922 6.6x MCR Mincor Resources 0.56 ▼ (3%) (7%) 104 26 82 2.6x PAN Panoramic Resources 0.64 ▲ 1% 154% 205 64 149 3.1x WSA Western Areas 4.19 ▼ (3%) 77% 975 231 962 6.7x AVQ Axiom Mining 0.019 ▲ 19% 27% 63 0 62 NM CZI Cassini Resources 0.18 ▼ (10%) 250% 20 8 12 NM LEG Legend Mining 0.009 ▼ (10%) 13% 18 5 14 NM PIO Pioneer Resources 0.02 ▼ (11%) 33% 10 1 8 NM POS Poseidon Nickel 0.20 ▲ 3% 163% 103 4 133 NM SEG Segue Resources 0.013 ▲ 18% 225% 20 1 18 NA SGQ St George Mining 0.10 ▼ (27%) 0% 11 1 9 NA SIR Sirius Resources 2.77 ▼ (8%) 22% 946 59 887 NM WIN Winward Resources 0.20 ▼ (5%) 0% 13 6 7 NM Code Company Name Close Price Week r YTD r 52 Week Range Market Cap (A$m) Cash (A$m) TEV (A$m) AQR Aeon Metals 0.13 ▼ (16%) 0% 40 5 47 CCU Cobar Consolidated 0.058 — 0% (52%) 19 6 31 HRR Heron Resources 0.15 ▼ (6%) 7% 54 40 17 IBG Ironbark Zinc 0.10 — 0% 72% 44 2 42 IPT Impact Minerals 0.022 ▼ (12%) (45%) 12 1 12 IVR Investigator Resources 0.025 ▼ (4%) (47%) 12 3 9 MRP MacPhersons Resources 0.14 ▲ 4% (22%) 42 7 35 ROL Robust Resources 0.48 ▼ (1%) 36% 93 17 79 RXL Rox Resources 0.043 ▲ 2% 30% 36 3 34 TZN Terramin Australia 0.072 ▼ (4%) 157% 95 5 144 VXR Venturex Resources 0.006 — 0% (40%) 9 3 6