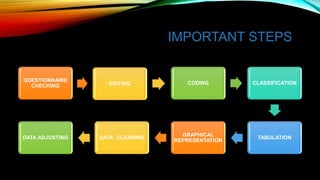
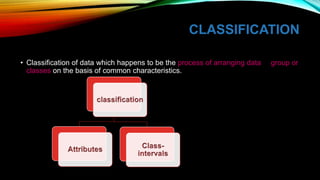
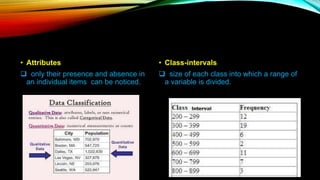
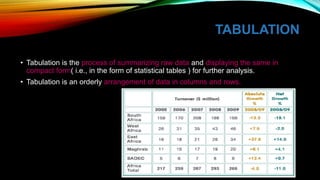
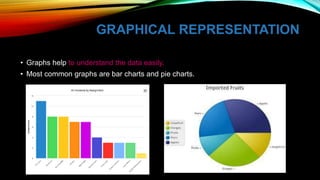
RESEARCH
METHODOLOGY
PROCESSING OF
DATA
JENIFER S.K.
FINAL YEAR
MBA
SRMC
INTRODUCTION
1. The data, after collection, has to be prepared for
analysis.
2. Collected data is raw and it must be converted to the
form that is suitable for the required analysis.
3. The result of the analysis are affected a lot by the form
of the data.
4. So, proper data preparation is must to get reliable
result.
IMPORTANT STEPS
QUESTIONNAIRE
CHECKING EDITING CODING CLASSIFICATION
TABULATION
GRAPHICAL
REPRESENTATION
DATA CLEANINGDATA ADJUSTING
QUESTIONNAIRE CHECKING
When the data is collected through questionnaires, the first steps of data
preparation process is to check the questionnaires if they are accepted or not.
NOT ACCEPTED IF:
 Incomplete partially or fully.
 Answered by a person who has inadequate knowledge.
 which gives the impression that the impression that the
respondent could not understand the questions.
EDITING
Editing of data is a process of examining the collected raw data (specially in
surveys) to detect errors and omissions and to correct these when possible.
FIELD EDITING
CENTRAL EDITING
Translating
or
rewriting
Wrong
and
replacement
CODING
• Coding refers to the process of assigning numerals or other symbols to answers so
that responses can be put into limited number of categories or classes.
CLASSIFICATION
• Classification of data which happens to be the process of arranging data in group or
classes on the basis of common characteristics.
• Attributes
 only their presence and absence in
an individual items can be noticed.
• Class-intervals
 size of each class into which a range of
a variable is divided.
TABULATION
• Tabulation is the process of summarizing raw data and displaying the same in
compact form( i.e., in the form of statistical tables ) for further analysis.
• Tabulation is an orderly arrangement of data in columns and rows.
GRAPHICAL REPRESENTATION
• Graphs help to understand the data easily.
• Most common graphs are bar charts and pie charts.
DATA CLEANING
• Checking the data for consistency and treatment for missing value.
DATA ADJUSTING
• Data adjusting is not always necessary but it may improve the quality of analysis
sometimes.
RESEARCH METHODOLOGY- PROCESSING OF DATA

RESEARCH METHODOLOGY- PROCESSING OF DATA

  • 1.
  • 2.
    INTRODUCTION 1. The data,after collection, has to be prepared for analysis. 2. Collected data is raw and it must be converted to the form that is suitable for the required analysis. 3. The result of the analysis are affected a lot by the form of the data. 4. So, proper data preparation is must to get reliable result.
  • 3.
    IMPORTANT STEPS QUESTIONNAIRE CHECKING EDITINGCODING CLASSIFICATION TABULATION GRAPHICAL REPRESENTATION DATA CLEANINGDATA ADJUSTING
  • 4.
    QUESTIONNAIRE CHECKING When thedata is collected through questionnaires, the first steps of data preparation process is to check the questionnaires if they are accepted or not. NOT ACCEPTED IF:  Incomplete partially or fully.  Answered by a person who has inadequate knowledge.  which gives the impression that the impression that the respondent could not understand the questions.
  • 5.
    EDITING Editing of datais a process of examining the collected raw data (specially in surveys) to detect errors and omissions and to correct these when possible. FIELD EDITING CENTRAL EDITING Translating or rewriting Wrong and replacement
  • 6.
    CODING • Coding refersto the process of assigning numerals or other symbols to answers so that responses can be put into limited number of categories or classes.
  • 7.
    CLASSIFICATION • Classification ofdata which happens to be the process of arranging data in group or classes on the basis of common characteristics.
  • 8.
    • Attributes  onlytheir presence and absence in an individual items can be noticed. • Class-intervals  size of each class into which a range of a variable is divided.
  • 9.
    TABULATION • Tabulation isthe process of summarizing raw data and displaying the same in compact form( i.e., in the form of statistical tables ) for further analysis. • Tabulation is an orderly arrangement of data in columns and rows.
  • 10.
    GRAPHICAL REPRESENTATION • Graphshelp to understand the data easily. • Most common graphs are bar charts and pie charts.
  • 11.
    DATA CLEANING • Checkingthe data for consistency and treatment for missing value.
  • 12.
    DATA ADJUSTING • Dataadjusting is not always necessary but it may improve the quality of analysis sometimes.