
Recommended
Recommended
More Related Content
Similar to Financial Performance Analysis of Banking Sector in India
Similar to Financial Performance Analysis of Banking Sector in India (20)
More from ijtsrd
More from ijtsrd (20)
Recently uploaded
Recently uploaded (20)
Financial Performance Analysis of Banking Sector in India
- 1. International Journal of Trend in Scientific Research and Development (IJTSRD) Volume 7 Issue 4, July-August 2023 Available Online: www.ijtsrd.com e-ISSN: 2456 – 6470 @ IJTSRD | Unique Paper ID – IJTSRD59672 | Volume – 7 | Issue – 4 | Jul-Aug 2023 Page 254 Financial Performance Analysis of Banking Sector in India Dr. Prem Parihar Assistant Professor in EAFM, Government Commerce College, Sikar, Rajasthan, India ABSTRACT The banking sector is the backbone of our economy. It offers a wide range of financial services. The banking industry's growth is dependent on the public's traditional services, such as deposits and loans. The banking sector has a direct impact on economic development. Customer service, deposit and loan facilities, and financial results are all factors that affect the bank's ability to grow. The following paper covers the financial performance analysis of the public sector banks. Financial Performance analysis of Selected Public and private Sector Bank (State Bank of India, ICICI bank and HDFC bank) during the Periods of 5 Financial year (2018 to 2022). This study based on entirely on secondary data and tools used to Ratio analysis selected public sector banks. Based on the data review the study found that private banks outperformed public sector banks. In the private sector, HDFC Bank outperformed ICICIBank. Among public sector banks, SBI was observed to be very stable and to offer consistent returns to investors. KEYWORDS: Financial Performance, public banks, private banks, ratio analysis How to cite this paper: Dr. PremParihar "Financial Performance Analysis of Banking Sector in India" Published in International Journal of Trend in Scientific Research and Development (ijtsrd), ISSN: 2456-6470, Volume-7 | Issue-4, August 2023, pp.254-260, URL: www.ijtsrd.com/papers/ijtsrd59672.pdf Copyright © 2023 by author (s) and International Journal of Trend in Scientific Research and Development Journal. This is an Open Access article distributed under the terms of the Creative Commons Attribution License (CC BY 4.0) (http://creativecommons.org/licenses/by/4.0) INTRODUCTION The banking sector is the backbone of our economy. It offers a wide range of financial services. The banking industry's growth is dependent on the public's traditional services, such as deposits and loans. The banking sector has a direct impact on economic development. Customer service, deposit and loan facilities, and financial results are all factors that affect the bank's ability to grow. Public and private sector banks each have their own set of advantages and disadvantages. They play a very important role in the effort to attain stable prices, high level of employment and sound economic growth. Theymake funds available to meet the needs of individuals, businesses and the government. In So before making any financial decisions about a bank, it is vital to determine its financial efficiency, regardless of whether it is public or private. Research Objective- 1. To look at India's banking sector's financial success over the last five years. 2. The study also aims to identify the key factors that affect bank performance. 3. To identify the best banks based on their financial results over a fixed period of time. Research Methodology- This research is descriptive and quantitative in nature as it is studying the current financial status of the selected 4 banks that is SBI, BoB, ICICI bank, and HDFC bank. The yearly financial data of SBI, BoB, ICICI bank, and HDFC bank from 2018 to 2022 were collected from the financial websites. For the data analysis purpose, the total net profit, total assets, total income, total expense, net profit margin ratio, and return to net-worth ratio, Earning per share ratio, CASA ratio and Capital Adequacy ratio is calculated and compared. Review of Literature- Karri, Meghani and Mishra 2015 in A Comparative Study on Financial Performance of Public Sector Banks in India: An Analysis on Camel Model they used the CAMEL model and T- test to evaluate the financial strength of Bank of Baroda and Punjab National Bank. Based on financial ratios they discovered that Bank of Baroda outperformed Punjab National Bank on average. Kumar N. and Kumar N 2016 in A Comparative Financial Performance Analysis of Selected Public Sector Banks in India they studied and compared the output of four public sector banks from 2011 to 2015. IJTSRD59672
- 2. International Journal of Trend in Scientific Research and Development @ www.ijtsrd.com eISSN: 2456-6470 @ IJTSRD | Unique Paper ID – IJTSRD59672 | Volume – 7 | Issue – 4 | Jul-Aug 2023 Page 255 They compared SBI to other public banks using a variety of financial ratios and came to the conclusion that SBI is superior. Srinivasan and Tamilarasu 2022 in article A study of financial performance analysis of selected Public and Private sector Banks they investigated that the financial ratios reveal that public sector banks have a better outreach among both the urban and rural populace but private sector banks, though well embedded in urban regions, are still stretched thin in rural regions. This reveals that the public sector banks have heavy assets and employ a huge work force compared to private sector banks. In terms of financial performance, public sector banks lag in profitability in comparison to private sector banks but enjoy the stability due to the support of the Union government. Private sector banks give more importance to current accounts in comparison to savings account as current accounts improve profitability by cutting expenses while savings accounts are expensive to the bank. In case of public sector banks, customers prefer them more for savings accounts and fixed deposits owing to their stability and security. According to the literature review, the performance of private banks and public banks differ significantly in terms of time, profitability, credit risk, asset quality, return generating capability and other factors. DATA ANALYSIS 1. Net Profit Table-1. Net Profit (Am. in Crore rs.) Name of Bank 2018 2019 2020 2021 2022 SBI -4177 3085 12395 22912 43775 BoB -1912 1087 942 1454 7700 ICICI 6959 7910 7486 8054 8936 HDFC 18561 22446 27296 31857 38151 Source- Compiled from financial data available in moneycontrol.com as on 15.04.2023 Source- Compiled from financial data available in moneycontrol.com as on 15.04.2023 The table-1 show that the zig-zag pattern of BoB's net profit is decreased and increased in 2019, and decreased by 9.88 times in 2020. It Remain Inceasing in 2021 and 2022. On the other hand, SBI controlled its profit after 2018 and raised its profit. ICICI Bank performed well in the private banking sector as compared to the other two banks. Its profit has steadily increased over the last five years, while HDFC Bank's profit has remained stagnant. 2. Total Assets or Total Liabilities Table- 2. Total Assets or Total Liabilities (Am. in Crore rs.) Name of Bank 2018 2019 2020 2021 2022 SBI 3616433 3888467 4197492 4845618 5360883 BoB 747804 819671 1199942 1202675 1340137 ICICI 1124281 1238793 1377292 1573812 1752637 HDFC 1103186 1292805 1580830 1799506 2122934 Source- Compiled from financial data available in moneycontrol.com as on 15.04.2023
- 3. International Journal of Trend in Scientific Research and Development @ www.ijtsrd.com eISSN: 2456-6470 @ IJTSRD | Unique Paper ID – IJTSRD59672 | Volume – 7 | Issue – 4 | Jul-Aug 2023 Page 256 Source- Compiled from financial data available in moneycontrol.com as on 15.04.2023 According to table 2 assets of all four banks increased over a five-year period from 2018 to 2022. In comparison to all banks, HDFC bank's assets increased 1.92 times, BoB's 1.79 times, SBI's 1.48 times, and ICICI bank's 1.56 times. 3. Total Income Table- 3. Total Income (Am. in Crore rs.) Name of Bank 2018 2019 2020 2021 2022 SBI 306527 330687 362229 383970 406973 BoB 54048 60793 91086 89001 87780 ICICI 118969 131306 149610 161192 157536 HDFC 101344 124107 147068 155885 167695 Source- Compiled from financial data available in moneycontrol.com as on 15.04.2023 Source- Compiled from financial data available in moneycontrol.com as on 15.04.2023 According to table 3 total income of all four banks increased over a five-year period from 2018 to 2022. In comparison to all banks, HDFC bank's total income increased 1.65 times, BoB's 1.62 times, SBI's 1.33 times, and ICICI bank's 1.32 times. 4. Total Expenses Table-4. Total Expenses (Am. in Crore rs.) Name of Bank 2018 2019 2020 2021 2022 SBI 242746 270651 292905 306439 323139 BoB 40487 45274 70616 66318 63654 ICICI 90017 103436 116183 118930 114318 HDFC 66308 81407 95173 94248 98896 Source- Compiled from financial data available in moneycontrol.com as on 15.04.2023
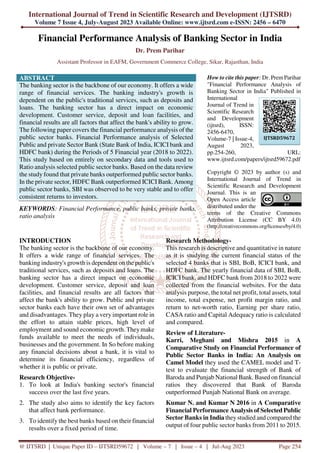
- 4. International Journal of Trend in Scientific Research and Development @ www.ijtsrd.com eISSN: 2456-6470 @ IJTSRD | Unique Paper ID – IJTSRD59672 | Volume – 7 | Issue – 4 | Jul-Aug 2023 Page 257 0 50000 100000 150000 200000 250000 300000 350000 2018 2019 2020 2021 2022 Total Expenses Source- Compiled from financial data available in moneycontrol.com as on 15.04.2023 Total expenditures for all four banks rose over a five-year period from 2018 to 2022 according to table 4. The ICIC bank was found to be effective in its cost management. In contrast to other banks, BoB's overall expenditures were 1.57 times higher, HDFC's 1.49 times higher, SBI's 1.33 times higher, and ICICI bank's 1.27 times higher. SBI had the highest overall expenses. 5. Net Profit Margin Ratio Table- 5. Net Profit Margin Ratio (Values in percentage) Name of Bank 2018 2019 2020 2021 2022 SBI -1.82 1.21 6.73 8.73 12.53 BoB -4.15 2.05 1.19 1.95 10.49 ICICI 14.63 7.90 13.23 22.67 27.02 HDFC 21.76 21.34 22.33 24.78 28.06 Source- Compiled from financial data available in moneycontrol.com as on 15.04.2023 -10 -5 0 5 10 15 20 25 30 2018 2019 2020 2021 2022 Net Profit Margin Ratio Source- Compiled from financial data available in moneycontrol.com as on 15.04.2023 The higher the net profit ratio, the more effective the company. This ratio measures the efficiency in which assets are used to produce revenue. Table- 5 shows that HDFC Bank performed well in comparison to the other three banks. The performance of SBI, BoB and ICICI was observed to be increasing. 6. Return on Net Worth / Equity Table- 6. Return on Net Worth / Equity (Values in percentage) Name of Bank 2018 2019 2020 2021 2022 SBI -2.21 0.98 8.69 8.89 12.53 BoB -4.05 2.20 1.21 1.87 8.54 ICICI 7.16 3.82 7.98 11.90 14.04 HDFC 16.88 14.53 15.45 15.17 15.38 Source- Compiled from financial data available in moneycontrol.com as on 15.04.2023
- 5. International Journal of Trend in Scientific Research and Development @ www.ijtsrd.com eISSN: 2456-6470 @ IJTSRD | Unique Paper ID – IJTSRD59672 | Volume – 7 | Issue – 4 | Jul-Aug 2023 Page 258 Source- Compiled from financial data available in moneycontrol.com as on 15.04.2023 This ratio calculates the rate of return on net worth investments. This is regarded as the most critical financial ratio because it relates to the return on shareholder equity. As a general rule the higher Return on Net Worth / Equity, the better the financial performance of the Bank and company. Table -6 shows that the HDFC bank outperformed the other four banks over the course of five years. ICICI banks' output has dropped by nearly 47 percent in 2019. In 2018, both public-sector banks performed very poorly but SBIimproving after 2019 in return on Net Worth / Equity. BoB still decreasing. Return on Net Worth / Equity till 2021 and in 2022 it increases by 4.57 times. 7. Earning Per Share Ratio Table- 7 Earning Per Share Ratio (Values in Rs.) Name of Bank 2018 2019 2020 2021 2022 SBI -5.34 2.58 22.15 25.11 39.64 BoB -8.17 4.16 2.32 3.32 15.18 ICICI 12.02 6.61 14.81 27.26 36.21 HDFC 71.73 83.33 49.84 57.88 68.77 Source- Compiled from financial data available in moneycontrol.com as on 15.04.2023 Source- Compiled from financial data available in moneycontrol.com as on 15.04.2023 Earnings per share (EPS) is a measure of how much money is made per share. Table-7 shows that SBI has also changed from -5.34 to 39.64 rupees per share from 2018 to 2022, and BoB's has also changed from -8.17 to 15.18 rupees per share from 2018 to 2022. HDFC Bank's earnings per share (EPS) decreased, while ICICI Bank's EPS increased. In terms of EPS volatility SBI was found to be less volatile than other banks.
- 6. International Journal of Trend in Scientific Research and Development @ www.ijtsrd.com eISSN: 2456-6470 @ IJTSRD | Unique Paper ID – IJTSRD59672 | Volume – 7 | Issue – 4 | Jul-Aug 2023 Page 259 8. CASA Ratio Table- 8. CASA Ratio (Value in Percentage) Name of Bank 2018 2019 2020 2021 2022 SBI 44.45 45.40 44.17 45.40 44.51 BoB 35.62 34.60 35.02 39.80 41.14 ICICI 51.32 48.77 44.83 46.16 48.60 HDFC 43.48 42.35 42.18 46.07 48.13 Source- Compiled from financial data available in moneycontrol.com as on 15.04.2023 Source- Compiled from financial data available in moneycontrol.com as on 15.04.2023 The CASA ratio describes total bank deposits in current and savings accounts in table 8. The higher ratio is beneficial since the bulk of funds come from the cheapest sources of funds, namely current and savings accounts. In table 8, the ICICI bank was found to be the best, followed by SBI and HDFC bank. In 2018, the BoB had a lower ratio, which improved by 1.16 times from 2018 to 2022. 9. Capital Adequacy Ratio Table- 9. Capital Adequacy Ratio (Value in Percentage) Name of Bank 2018 2019 2020 2021 2022 SBI 13.00 13.00 13.13 13.74 13.85 BoB 12.13 13.42 13.30 14.99 15.84 ICICI 18.00 16.89 16.11 19.12 19.16 HDFC 15.00 17.11 18.52 18.79 18.90 Source- Compiled from financial data available in moneycontrol.com as on 15.04.2023 Source- Compiled from financial data available in moneycontrol.com as on 15.04.2023 Capital adequacy ratios compare the sum of a bank's capital to the amount of its riskweighted credit exposures. The higher a bank's capital adequacy levels, the more unexpected losses it will take before going bankrupt. Table 9 shows that private banks performed better than public banks, with ICICI doing the highest of the four banks in 2021 and 2022 but in overall HDFC doing best.
- 7. International Journal of Trend in Scientific Research and Development @ www.ijtsrd.com eISSN: 2456-6470 @ IJTSRD | Unique Paper ID – IJTSRD59672 | Volume – 7 | Issue – 4 | Jul-Aug 2023 Page 260 10. Valuation Ratio or Price Earning Ratio Table- 10. Valuation Ratio or Price Earning Ratio Name of Bank 2018 2019 2020 2021 2022 SBI -46.80 124.32 8.89 14.51 12.45 BoB -17.42 30.93 23.08 22.32 7.35 ICICI 23.16 60.59 21.86 21.35 20.17 HDFC 13.15 13.91 17.29 25.81 21.38 Source- Compiled from financial data available in moneycontrol.com as on 15.04.2023 Source- Compiled from financial data available in moneycontrol.com as on 15.04.2023 The Price Earnings Ratio is simply the stock price divided by the earnings per share. High PE Ratio stocks are considered expensive and growth stocks, whereas low PE Ratio stocks are considered inexpensive and value stocks. SBI had excellent returns in 2021 and BOB had excellent returns in 2019 but were very expensive, while HDFC was a very safe and ICICI’s Price Earnings Ratio is deceasing after 2019. Conclusion- The financial performance of India's banking sector over the last five years from 2018 to 2022. The study also aimed to identify the main factors influencing bank success, as well as the best banks based on their financial results over a set period of time. Based on the data review the study found that private banks outperformed public sector banks. In the private sector, HDFC Bank outperformed ICICI Bank. Among public sector banks, SBI was observed to be very stable and to offer consistent returns to investors. References- [1] moneycontrol.com as on 15.04.2023 [2] Karri H. K., Meghani K. and Mishra B. M., A Comparative Study on Financial Performance of Public Sector Banks in India: An Analysis on Camel Model. Oman Chapter of Arabian Journal of Business and Management Review, 2015, 4(8), 18–34. [3] Kumar, N. and Kumar N., A Comparative Financial Performance Analysis of Selected Public Sector Banks in India. 2016, 3(2), 5. [4] Srinivasan and Tamilarasu, A studyof financial performance analysis of selected Public and private sector Banks, IJCRT, vol. 10, Issue 4, April 2022, page no. e720-e726 [5] Budhedeo, S. H. and Pandya, N. P. Financial Performance of Public Sector Banks in India: A Post Reform Analysis. Indian Journal of Finance, 12(10), 2018. [6] Dr. Haque Ansarul, Comparison of financial performance analysis of Commercial Banks: A case syudy in the context of India (2009-2013), Economics, Commerce and Trade Management: An International Journal (ECTIJ) Vol. 1, No.1, 2017, page no. 15-25 [7] Chaudhary K. and Sharma M., Performance of Indian Public Sector Banks and Private Sector Banks: A Comparative study, International Journal of Innovation, Management and Technology, Vol. 2, No. 3, 2011, page no. 249- 256 [8] Patel J.V. and Dr. Patel C.K., A Comparative financial performance analysis of selected Public and private sector Banks in India, IJARCMSS, Vol. 4, No. 3(II), July-September, page no. 100-108