This document discusses two forest carbon modeling tools:
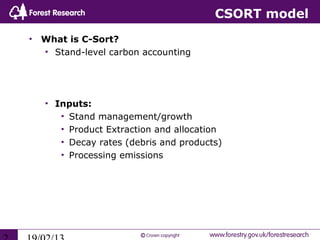
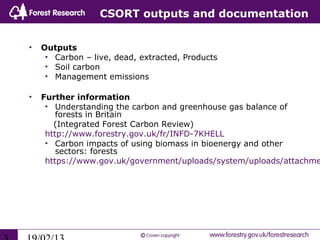
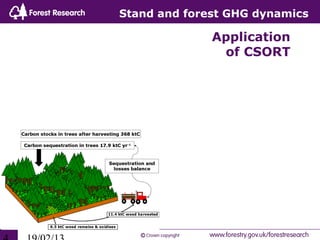
1) CSORT, a stand-level model that accounts for carbon in live biomass, dead material, extracted products, and soil under different management scenarios.
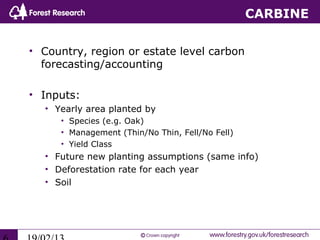
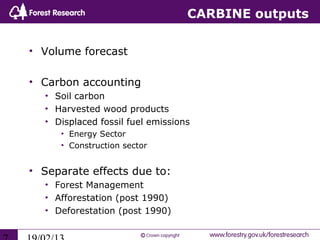
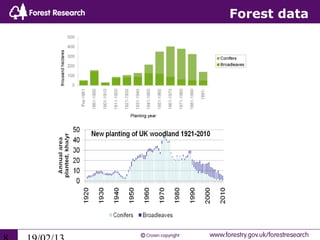
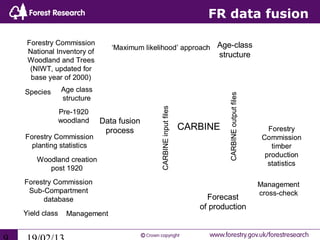
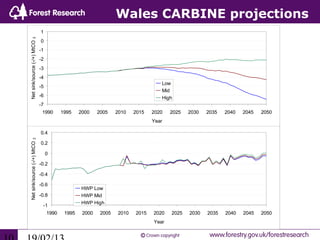
2) CARBINE, a larger-scale model that forecasts carbon stocks and fluxes at regional to national scales based on inputs like planting, yield, and harvest statistics. It accounts for impacts of afforestation, deforestation, forest management, and harvested wood products.
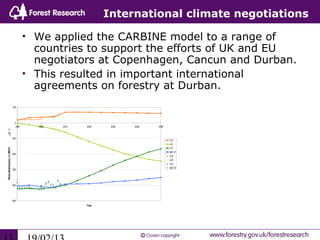
The document describes applications of CARBINE to support climate negotiations by projecting the carbon impacts of forestry policies in different countries. Ongoing work aims to improve both models by adding disturbances and dynamic utilization options.