SlideShare a Scribd company logo
1 of 2
Download to read offline
Asimple randomsample of100 postalemployees is used to test ifthe average time postalemployees have worked for the postalservice has
changed fromthe value of7.5 years recorded 20 years ago. The sample meanwas 7 years witha standard deviationof2 years. Assume the
distributionofthe time the employees have worked for the postalservice is approximatelynormal. The hypotheses beingtested are H0: = 7.5,
HA: 7.5. Aone-sample t test willbe used.
1. What are the appropriate degrees offreedomfor this test?
A. 19
B. 99
C. 7
D. 100
2. What is the value ofthe test statistic for the one-sample t?
A. -0.25
B. 2
C. 2.5
D. -2.5
3. What is the p-value for the one-sample t?
A. 0.01 > p-value > 0.005
B. 0.02 > p-value > 0.01
C. 0.0062
D. 0.05 > p-value > 0.01
E. 0.10 > p-value > 0.05
4. Suppose the meanand standard deviationobtained were based ona sample ofsize n=25 postalworkers rather than100. What do we know
about the value ofthe p-value?
A. It would be larger.
B. It would be smaller.
C. It would be unchanged because the difference betweenthe sample meanand the hypothesized meanis the same.
D. It would be unchanged because the variabilityor standard deviationis the same.
5. What would youconclude about the population?
A. The true average years is equalto 7.5
B. The true average years is not equalto 7.5
C. The true average years is greater than7.5
D. Not enoughinformation
checking if it gets accepted

More Related Content

Similar to checking if it gets accepted

Week7 lecturestatisticsfordecisionmaking
Week7 lecturestatisticsfordecisionmakingWeek7 lecturestatisticsfordecisionmaking
Week7 lecturestatisticsfordecisionmaking
Brent Heard
 
Question 1 of 201.0 PointsAccepted characters numbers.docx
Question 1 of 201.0 PointsAccepted characters numbers.docxQuestion 1 of 201.0 PointsAccepted characters numbers.docx
Question 1 of 201.0 PointsAccepted characters numbers.docx
teofilapeerless
 
The following calendar-year information is taken from the December.docx
The following calendar-year information is taken from the December.docxThe following calendar-year information is taken from the December.docx
The following calendar-year information is taken from the December.docx
cherry686017
 
Sheet1QUESTIONS NumberANSWERS1234567891011121314151617181920Shee.docx
Sheet1QUESTIONS NumberANSWERS1234567891011121314151617181920Shee.docxSheet1QUESTIONS NumberANSWERS1234567891011121314151617181920Shee.docx
Sheet1QUESTIONS NumberANSWERS1234567891011121314151617181920Shee.docx
lesleyryder69361
 
Question 2 of 231.0 PointsA company operates four machines dur.docx
Question 2 of 231.0 PointsA company operates four machines dur.docxQuestion 2 of 231.0 PointsA company operates four machines dur.docx
Question 2 of 231.0 PointsA company operates four machines dur.docx
wraythallchan
 
Week 3 – Multiple Choice4) A random sample of 100 observations f.docx
Week 3 – Multiple Choice4) A random sample of 100 observations f.docxWeek 3 – Multiple Choice4) A random sample of 100 observations f.docx
Week 3 – Multiple Choice4) A random sample of 100 observations f.docx
melbruce90096
 
1192012 155942 f023_=_statistical_inference
1192012 155942 f023_=_statistical_inference1192012 155942 f023_=_statistical_inference
1192012 155942 f023_=_statistical_inference
Dev Pandey
 
Project Week 71. Both graphs shows a.docx
Project Week 71. Both graphs shows a.docxProject Week 71. Both graphs shows a.docx
Project Week 71. Both graphs shows a.docx
wkyra78
 
Statistik Chapter 6
Statistik Chapter 6Statistik Chapter 6
Statistik Chapter 6
WanBK Leo
 
Esitmates for year 201620162015Sales (units) increase.docx
Esitmates for year 201620162015Sales (units) increase.docxEsitmates for year 201620162015Sales (units) increase.docx
Esitmates for year 201620162015Sales (units) increase.docx
YASHU40
 

Similar to checking if it gets accepted (16)

BUS173 Lecture 5.pdf
BUS173 Lecture 5.pdfBUS173 Lecture 5.pdf
BUS173 Lecture 5.pdf
 
Week7 lecturestatisticsfordecisionmaking
Week7 lecturestatisticsfordecisionmakingWeek7 lecturestatisticsfordecisionmaking
Week7 lecturestatisticsfordecisionmaking
 
Week7 lecturestatisticsfordecisionmaking
Week7 lecturestatisticsfordecisionmakingWeek7 lecturestatisticsfordecisionmaking
Week7 lecturestatisticsfordecisionmaking
 
Question 1 of 201.0 PointsAccepted characters numbers.docx
Question 1 of 201.0 PointsAccepted characters numbers.docxQuestion 1 of 201.0 PointsAccepted characters numbers.docx
Question 1 of 201.0 PointsAccepted characters numbers.docx
 
The following calendar-year information is taken from the December.docx
The following calendar-year information is taken from the December.docxThe following calendar-year information is taken from the December.docx
The following calendar-year information is taken from the December.docx
 
STATISTIC ESTIMATION
STATISTIC ESTIMATIONSTATISTIC ESTIMATION
STATISTIC ESTIMATION
 
Sheet1QUESTIONS NumberANSWERS1234567891011121314151617181920Shee.docx
Sheet1QUESTIONS NumberANSWERS1234567891011121314151617181920Shee.docxSheet1QUESTIONS NumberANSWERS1234567891011121314151617181920Shee.docx
Sheet1QUESTIONS NumberANSWERS1234567891011121314151617181920Shee.docx
 
Question 2 of 231.0 PointsA company operates four machines dur.docx
Question 2 of 231.0 PointsA company operates four machines dur.docxQuestion 2 of 231.0 PointsA company operates four machines dur.docx
Question 2 of 231.0 PointsA company operates four machines dur.docx
 
Week 3 – Multiple Choice4) A random sample of 100 observations f.docx
Week 3 – Multiple Choice4) A random sample of 100 observations f.docxWeek 3 – Multiple Choice4) A random sample of 100 observations f.docx
Week 3 – Multiple Choice4) A random sample of 100 observations f.docx
 
Test of significance (t-test, proportion test, chi-square test)
Test of significance (t-test, proportion test, chi-square test)Test of significance (t-test, proportion test, chi-square test)
Test of significance (t-test, proportion test, chi-square test)
 
1192012 155942 f023_=_statistical_inference
1192012 155942 f023_=_statistical_inference1192012 155942 f023_=_statistical_inference
1192012 155942 f023_=_statistical_inference
 
Project Week 71. Both graphs shows a.docx
Project Week 71. Both graphs shows a.docxProject Week 71. Both graphs shows a.docx
Project Week 71. Both graphs shows a.docx
 
Statistik Chapter 6
Statistik Chapter 6Statistik Chapter 6
Statistik Chapter 6
 
Esitmates for year 201620162015Sales (units) increase.docx
Esitmates for year 201620162015Sales (units) increase.docxEsitmates for year 201620162015Sales (units) increase.docx
Esitmates for year 201620162015Sales (units) increase.docx
 
Two Means, Two Dependent Samples, Matched Pairs
Two Means, Two Dependent Samples, Matched PairsTwo Means, Two Dependent Samples, Matched Pairs
Two Means, Two Dependent Samples, Matched Pairs
 
Chapter09
Chapter09Chapter09
Chapter09
 

Recently uploaded

Personalisation of Education by AI and Big Data - Lourdes Guàrdia
Personalisation of Education by AI and Big Data - Lourdes GuàrdiaPersonalisation of Education by AI and Big Data - Lourdes Guàrdia
Personalisation of Education by AI and Big Data - Lourdes Guàrdia
EADTU
 
SPLICE Working Group: Reusable Code Examples
SPLICE Working Group:Reusable Code ExamplesSPLICE Working Group:Reusable Code Examples
SPLICE Working Group: Reusable Code Examples
Peter Brusilovsky
 

Recently uploaded (20)

Model Attribute _rec_name in the Odoo 17
Model Attribute _rec_name in the Odoo 17Model Attribute _rec_name in the Odoo 17
Model Attribute _rec_name in the Odoo 17
 
UGC NET Paper 1 Unit 7 DATA INTERPRETATION.pdf
UGC NET Paper 1 Unit 7 DATA INTERPRETATION.pdfUGC NET Paper 1 Unit 7 DATA INTERPRETATION.pdf
UGC NET Paper 1 Unit 7 DATA INTERPRETATION.pdf
 
21st_Century_Skills_Framework_Final_Presentation_2.pptx
21st_Century_Skills_Framework_Final_Presentation_2.pptx21st_Century_Skills_Framework_Final_Presentation_2.pptx
21st_Century_Skills_Framework_Final_Presentation_2.pptx
 
OSCM Unit 2_Operations Processes & Systems
OSCM Unit 2_Operations Processes & SystemsOSCM Unit 2_Operations Processes & Systems
OSCM Unit 2_Operations Processes & Systems
 
Personalisation of Education by AI and Big Data - Lourdes Guàrdia
Personalisation of Education by AI and Big Data - Lourdes GuàrdiaPersonalisation of Education by AI and Big Data - Lourdes Guàrdia
Personalisation of Education by AI and Big Data - Lourdes Guàrdia
 
Michaelis Menten Equation and Estimation Of Vmax and Tmax.pptx
Michaelis Menten Equation and Estimation Of Vmax and Tmax.pptxMichaelis Menten Equation and Estimation Of Vmax and Tmax.pptx
Michaelis Menten Equation and Estimation Of Vmax and Tmax.pptx
 
Including Mental Health Support in Project Delivery, 14 May.pdf
Including Mental Health Support in Project Delivery, 14 May.pdfIncluding Mental Health Support in Project Delivery, 14 May.pdf
Including Mental Health Support in Project Delivery, 14 May.pdf
 
NO1 Top Black Magic Specialist In Lahore Black magic In Pakistan Kala Ilam Ex...
NO1 Top Black Magic Specialist In Lahore Black magic In Pakistan Kala Ilam Ex...NO1 Top Black Magic Specialist In Lahore Black magic In Pakistan Kala Ilam Ex...
NO1 Top Black Magic Specialist In Lahore Black magic In Pakistan Kala Ilam Ex...
 
Andreas Schleicher presents at the launch of What does child empowerment mean...
Andreas Schleicher presents at the launch of What does child empowerment mean...Andreas Schleicher presents at the launch of What does child empowerment mean...
Andreas Schleicher presents at the launch of What does child empowerment mean...
 
Ernest Hemingway's For Whom the Bell Tolls
Ernest Hemingway's For Whom the Bell TollsErnest Hemingway's For Whom the Bell Tolls
Ernest Hemingway's For Whom the Bell Tolls
 
PANDITA RAMABAI- Indian political thought GENDER.pptx
PANDITA RAMABAI- Indian political thought GENDER.pptxPANDITA RAMABAI- Indian political thought GENDER.pptx
PANDITA RAMABAI- Indian political thought GENDER.pptx
 
Observing-Correct-Grammar-in-Making-Definitions.pptx
Observing-Correct-Grammar-in-Making-Definitions.pptxObserving-Correct-Grammar-in-Making-Definitions.pptx
Observing-Correct-Grammar-in-Making-Definitions.pptx
 
AIM of Education-Teachers Training-2024.ppt
AIM of Education-Teachers Training-2024.pptAIM of Education-Teachers Training-2024.ppt
AIM of Education-Teachers Training-2024.ppt
 
Introduction to TechSoup’s Digital Marketing Services and Use Cases
Introduction to TechSoup’s Digital Marketing  Services and Use CasesIntroduction to TechSoup’s Digital Marketing  Services and Use Cases
Introduction to TechSoup’s Digital Marketing Services and Use Cases
 
TỔNG HỢP HƠN 100 ĐỀ THI THỬ TỐT NGHIỆP THPT TOÁN 2024 - TỪ CÁC TRƯỜNG, TRƯỜNG...
TỔNG HỢP HƠN 100 ĐỀ THI THỬ TỐT NGHIỆP THPT TOÁN 2024 - TỪ CÁC TRƯỜNG, TRƯỜNG...TỔNG HỢP HƠN 100 ĐỀ THI THỬ TỐT NGHIỆP THPT TOÁN 2024 - TỪ CÁC TRƯỜNG, TRƯỜNG...
TỔNG HỢP HƠN 100 ĐỀ THI THỬ TỐT NGHIỆP THPT TOÁN 2024 - TỪ CÁC TRƯỜNG, TRƯỜNG...
 
HMCS Vancouver Pre-Deployment Brief - May 2024 (Web Version).pptx
HMCS Vancouver Pre-Deployment Brief - May 2024 (Web Version).pptxHMCS Vancouver Pre-Deployment Brief - May 2024 (Web Version).pptx
HMCS Vancouver Pre-Deployment Brief - May 2024 (Web Version).pptx
 
COMMUNICATING NEGATIVE NEWS - APPROACHES .pptx
COMMUNICATING NEGATIVE NEWS - APPROACHES .pptxCOMMUNICATING NEGATIVE NEWS - APPROACHES .pptx
COMMUNICATING NEGATIVE NEWS - APPROACHES .pptx
 
SPLICE Working Group: Reusable Code Examples
SPLICE Working Group:Reusable Code ExamplesSPLICE Working Group:Reusable Code Examples
SPLICE Working Group: Reusable Code Examples
 
Accessible Digital Futures project (20/03/2024)
Accessible Digital Futures project (20/03/2024)Accessible Digital Futures project (20/03/2024)
Accessible Digital Futures project (20/03/2024)
 
Understanding Accommodations and Modifications
Understanding  Accommodations and ModificationsUnderstanding  Accommodations and Modifications
Understanding Accommodations and Modifications
 

checking if it gets accepted

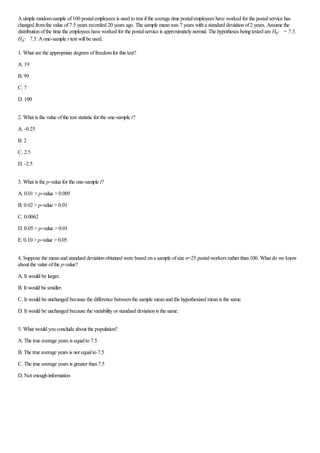
  • 1. Asimple randomsample of100 postalemployees is used to test ifthe average time postalemployees have worked for the postalservice has changed fromthe value of7.5 years recorded 20 years ago. The sample meanwas 7 years witha standard deviationof2 years. Assume the distributionofthe time the employees have worked for the postalservice is approximatelynormal. The hypotheses beingtested are H0: = 7.5, HA: 7.5. Aone-sample t test willbe used. 1. What are the appropriate degrees offreedomfor this test? A. 19 B. 99 C. 7 D. 100 2. What is the value ofthe test statistic for the one-sample t? A. -0.25 B. 2 C. 2.5 D. -2.5 3. What is the p-value for the one-sample t? A. 0.01 > p-value > 0.005 B. 0.02 > p-value > 0.01 C. 0.0062 D. 0.05 > p-value > 0.01 E. 0.10 > p-value > 0.05 4. Suppose the meanand standard deviationobtained were based ona sample ofsize n=25 postalworkers rather than100. What do we know about the value ofthe p-value? A. It would be larger. B. It would be smaller. C. It would be unchanged because the difference betweenthe sample meanand the hypothesized meanis the same. D. It would be unchanged because the variabilityor standard deviationis the same. 5. What would youconclude about the population? A. The true average years is equalto 7.5 B. The true average years is not equalto 7.5 C. The true average years is greater than7.5 D. Not enoughinformation