
Recommended
Recommended
More Related Content
Similar to GenotypeObservedType of GameteY F CV.docx
Similar to GenotypeObservedType of GameteY F CV.docx (20)
More from hanneloremccaffery
More from hanneloremccaffery (20)
Recently uploaded
Recently uploaded (20)
GenotypeObservedType of GameteY F CV.docx
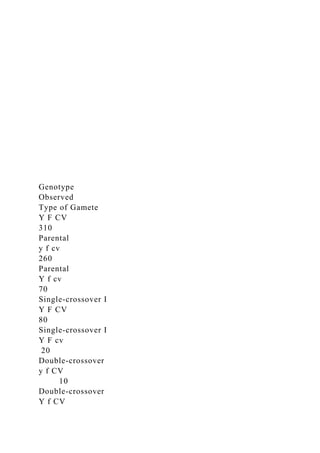
- 1. Genotype Observed Type of Gamete Y F CV 310 Parental y f cv 260 Parental Y f cv 70 Single-crossover I Y F CV 80 Single-crossover I Y F cv 20 Double-crossover y f CV 10 Double-crossover Y f CV
- 2. 135 Single-crossover II y F cv 115 Single-crossover II Total 1000 Following is the published distances for three genes 1st middle 3rd 13.7 mu 43 mu
- 3. Make up Data_Sec 06 Recombination and Linkage A Three point test cross in Drosophila Linkage Relationship between two or more genes near each other on the same chromosome is known as Linkage Law of independent assortment applies to genes on different chromosomes(non linked genes) Linkage In a three point cross if there is no linkage what would be the expected ratio for all classes ? 1:1:1:1:1:1:1:1 Aim for three point linkage experiment Locate the respective position of the three linked gene loci on
- 4. the same chromosome Measure distances between genes Construct the genetic map which estimate the physical distances between gene loci Drosophila Genes & Phenotypes Genotype (alleles) y cv f mutant and + + + (Y CV F) wildtype Phenotype (appearance) Mutant: wild type: y: yellow body grey body cv: crossveinless wings crossvein wings f: forked bristles straight bristles Genes are located on the X chromosome Parental Cross: +++ / Y X ycvf / ycvf Males Females Phenotype (P): [WT] [yellow, crossveinless, forked] F1 Generation: ycvf / Y and +++ / ycvf Males Females P: [yellow, crossveinless, forked] [WT] F1 trihybrid test cross: ycvf / Y X +++ / ycvf 4 Males 6 Females
- 5. First day lab set up Test Cross-Testing genotype of parents showing dominant phenotype Test cross- Cross between F1 progeny and recessive parents. F1 trihybrid test cross: ycvf / Y x +++ / ycvf 4 Males 6 Females During meiosis of spermatogenesis male Drosophila flies do not exhibit crossing over between homologous pair - no recombinant product. X chromosome and Y chromosome do have regions of pairing, and do form tetrads, but don’t recombine. Male show complete linkage, advantageous for our experiment. Tri-hybrid females had crossing over . 8 Phenotypes You will be expecting today!! Grey, crossvein,straight (+ + + ) Yellow,crossveinless,forked(y cv f ) Grey,crossveinless,forked (+cv f ) Yellow,crossvein,straight(y + +) Grey,crossvein,forked (+ + f) Yellow,crossveinless,straight (y cv +) Grey, crossveinless,straight(+cv +) Yellow,crossvein,forked(y + f)
- 6. Place 10 -12 flies at a time to get the phenotypes. Non-recombinant Single CO- region I Single CO-region II Double CO Our results pool out the whole class data to calculate the genetic distance more accurately Today’s Goal: Construct a crude genetic map Find the gene position calculate c.o.c., interference Perform X²(to determine if the map distance from the pooled class data are statistically same with the published map distance) F2 Trihybrid Test Cross example axp / +++ X axp / Y gametes a x p YClass#F2+ + ++ + +/ a x p+ + +/ Y162a x pa x p/ a x p a x p/ Y252+ x p+ x p/ a x p+ x p/ Y314a + +a + +/ a x pa + + / Y416+ + p+ + p/ a x p+ + p/ Y54a x +a x +/ a x pa x +/ Y62+ x ++ x +/ a x p+ x +/ Y727a + pa +
- 7. p/ a x pa + p/ Y823 ** phenotypes of both sexes are similar, gender does not matter F1 Parents- F2 Data Analysis: Assigning ClassesphenotypesClass#F2+ + +162a x p252+ x p314a + +416+ + p54a x +62+ x +727a + p823 Non-recombinants (parental) usually have greatest # Double crossover classes usually have smallest #
- 8. Single crossover I Reciprocal classes have similar numbers Single crossover II F2 Data Analysis: 1st goal- determine the order of loci We will be comparing P & DCO classesphenotypesClass#F2+ + +162a x p252+ x p314a + +416+ + p54a x +62+ x +727a + p823 200 + + + a x p + + p a x + a+ p x+ a p+ x a+ p+ x+ a p x In DC classes ,middle gene gets inverted from its initial position in the parental chromosome F2 Data Analysis: Rearrange and Calculate Recombination
- 9. percentage RF = phenotypesClass#F2+ + +162a p x252+ p x314a + +416+ + x527a p +623+ p +74a + x82 200 RF I = = 0.18 Between a and p RF II = = 0.28 Between p and x Note that F2# is greater for CO between p and x
- 10. F2 Data Analysis: Drawing the Map based on recombinant frequency 1 map unit = 1% recombination a p x 18 m.u. 28 m.u. 2nd step: Calculate C.O.C and interference Coefficient of coincidence(c.o.c.) = Expected DCO = (RF I)(RF II)(Total #) Interference(I) = 1 – c.o.c Exp DCO = (0.18)(0.28)(200) = 10.08 c.o.c. = = 0.595 I = 1 – 0.595 = 0.405 ~ 40% interference Negative value means scoring is wrong C.O.C-measure the amount the interference of one CO to reduce the formation of another CO Third Goal:X² Analyses ( Observed vs published distance between 1st and 2nd gene)
- 11. to…. a p x 13.7 mu 43 mu X² for Region IObservedExpected(f-f*)2/f*Recomb. I14+16+4+2= 36(RF1 Pub) x total 0.137x200=27.42.7NonRecomb ITotal- recomb 200-36=164Total-recomb 200-27.4=172.6 0.43 X2 = 3.13 df = 1 X² Analyses: Observed vs Published for Region II NOT due to…. a p x 13.7 mu 43 mu X2 = 18.4 df = 1X² for Region IIObservedExpected(f-f*)2/f*Recomb. II27+23+4+2= 56(RF2 pub) x total 0.43x200=8610.5NonRecomb IITotal-
- 12. recomb 200-56=144Total-recomb 200-86=1147.9 X² Analyses: Reciprocal Classes Numbers for reciprocal classes should be 1:1 ratio X² Class 1&2ObservedExpected(f-f*)2/f*Class 162½ (total) = ½(114) 570.44Class 252½ (total) = ½ (114) 57 0.44 X2 = 0.88 df = 1 chance Possible Sources of Error Over-estimation of RF Inadequate sample size Misscoring of flies Missing double crossovers Under-estimation of RF Some crossover flies are less viable and selected against Ex. Triple mutants less viable than double/single mutants Failure to detect multiple crossovers in a given region **Do not want to hear the typical “standard experimental error” Ways to Improve Score phenotypes more carefully. It is better to use more markers so RF is not being measured for
- 13. distant genes that would have lots of crossovers, such as cv-f region, unlike the y-cv region, which is smaller, so less DCO occur. Increase sample size In summary 1. Determine the order of the three genes on the chromosome and find the middle gene 2. Calculate the recombination percentages for the two intervening regions 3. Construct the genetic map 4. Calculate the COC and Interference