GEOGRAPHY IGCSE: GEOGRAPHICAL SKILLS - CONTOURS AND SPOT HEIGHTS
•Download as PPTX, PDF•
0 likes•1,137 views

GEOGRAPHY IGCSE: GEOGRAPHICAL SKILLS - CONTOURS AND SPOT HEIGHTS. It contains: contours, spot heights, contour lines.

Recommended
Recommended
More Related Content
What's hot
What's hot (20)
Similar to GEOGRAPHY IGCSE: GEOGRAPHICAL SKILLS - CONTOURS AND SPOT HEIGHTS
Similar to GEOGRAPHY IGCSE: GEOGRAPHICAL SKILLS - CONTOURS AND SPOT HEIGHTS (20)
More from George Dumitrache
More from George Dumitrache (20)
Recently uploaded
Recently uploaded (20)
GEOGRAPHY IGCSE: GEOGRAPHICAL SKILLS - CONTOURS AND SPOT HEIGHTS
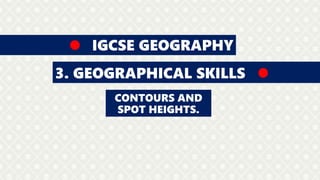
- 1. IGCSE GEOGRAPHY 3. GEOGRAPHICAL SKILLS CONTOURS AND SPOT HEIGHTS.
- 2. On a map, height is shown in metres above sea level. Spot heights show the height of a particular point on the map.
- 3. Contour lines are added to a map to show height and gradient. On OS maps they are shown as thin orange or brown lines, some of which have the land height written on them. The lines join areas of equal height: • Contour lines that are close together show land that increases or decreases in height quickly. This is steep land. • Contour lines that are far apart show land that increases or decreases in height slowly. This land is gently sloping.
- 4. We can use contour lines to create cross-section diagrams of landscapes. This helps to match contour lines on the map to landscape features in real life, eg hills, valleys and spurs of land.