
Recommended
More Related Content
What's hot
What's hot (13)
Similar to Reconciliation of Non-GAAP Measures
Similar to Reconciliation of Non-GAAP Measures (20)
More from finance26
More from finance26 (20)
Recently uploaded
Recently uploaded (20)
Reconciliation of Non-GAAP Measures
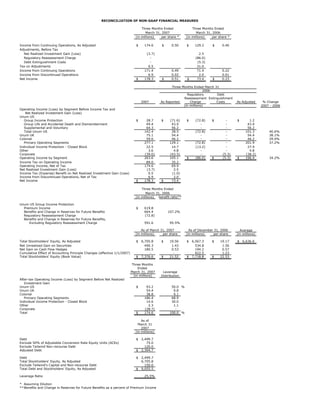
- 1. RECONCILIATION OF NON-GAAP FINANCIAL MEASURES Three Months Ended Three Months Ended March 31, 2007 March 31, 2006 (in millions) per share * (in millions) per share * Income from Continuing Operations, As Adjusted $ 174.6 $ 0.50 $ 129.2 $ 0.40 Adjustments, Before Tax Net Realized Investment Gain (Loss) (3.7) 2.5 Regulatory Reassessment Charge - (86.0) Debt Extinguishment Costs - (5.3) Tax on Adjustments 0.5 31.0 Income from Continuing Operations 171.4 0.49 71.4 0.22 Income from Discontinued Operations 6.9 0.02 2.0 0.01 Net Income $ 178.3 $ 0.51 $ 73.4 $ 0.23 Three Months Ended March 31 2006 Regulatory Debt Reassessment Extinguishment 2007 As Reported Charge Costs As Adjusted % Change (in millions) 2007 - 2006 Operating Income (Loss) by Segment Before Income Tax and Net Realized Investment Gain (Loss) Unum US Group Income Protection $ 28.7 $ (71.6) $ (72.8) $ - $ 1.2 Group Life and Accidental Death and Dismemberment 49.4 43.9 - - 43.9 Supplemental and Voluntary 64.3 56.2 - - 56.2 Total Unum US 142.4 28.5 (72.8) - 101.3 40.6% Unum UK 75.1 54.4 - - 54.4 38.1% Colonial 59.6 46.2 - - 46.2 29.0% Primary Operating Segments 277.1 129.1 (72.8) - 201.9 37.2% Individual Income Protection - Closed Block 22.5 14.7 (13.2) - 27.9 Other 3.6 4.8 - - 4.8 Corporate (39.6) (43.5) - (5.3) (38.2) Operating Income by Segment 263.6 105.1 $ (86.0) $ (5.3) $ 196.4 34.2% Income Tax on Operating Income 89.0 35.2 Operating Income, Net of Tax 174.6 69.9 Net Realized Investment Gain (Loss) (3.7) 2.5 Income Tax (Expense) Benefit on Net Realized Investment Gain (Loss) 0.5 (1.0) Income from Discontinued Operations, Net of Tax 6.9 2.0 Net Income $ 178.3 $ 73.4 Three Months Ended March 31, 2006 (in millions) benefit ratio** Unum US Group Income Protection Premium Income $ 619.8 Benefits and Change in Reserves for Future Benefits 664.4 107.2% Regulatory Reassessment Charge (72.8) Benefits and Change in Reserves for Future Benefits, Excluding Regulatory Reassessment Charge 591.6 95.5% As of March 31, 2007 As of December 31, 2006 Average (in millions) per share (in millions) per share (in millions) Total Stockholders' Equity, As Adjusted $ 6,705.8 $ 19.56 $ 6,567.3 $ 19.17 $ 6,636.6 Net Unrealized Gain on Securities 490.3 1.43 534.8 1.56 Net Gain on Cash Flow Hedges 180.5 0.53 194.2 0.57 Cumulative Effect of Accounting Principle Changes (effective 1/1/2007) - - 422.5 1.23 Total Stockholders' Equity (Book Value) $ 7,376.6 $ 21.52 $ 7,718.8 $ 22.53 Three Months Ended March 31, 2007 Leverage (in millions) Distribution After-tax Operating Income (Loss) by Segment Before Net Realized Investment Gain Unum US $ 93.2 50.0 % Unum UK 54.4 9.8 Colonial 38.8 9.1 Primary Operating Segments 186.4 68.9 Individual Income Protection - Closed Block 14.6 30.0 Other 2.3 1.1 Corporate (28.7) - Total $ 174.6 100.0 % As of March 31 2007 (in millions) Debt $ 2,499.7 Exclude 50% of Adjustable Conversion Rate Equity Units (ACEs) 75.0 Exclude Tailwind Non-recourse Debt 120.0 Adjusted Debt $ 2,304.7 Debt $ 2,499.7 Total Stockholders' Equity, As Adjusted 6,705.8 Exclude Tailwind's Capital and Non-recourse Debt 150.0 Total Debt and Stockholders' Equity, As Adjusted $ 9,055.5 Leverage Ratio 25.5% * Assuming Dilution ** Benefits and Change in Reserves for Future Benefits as a percent of Premium Income