
Recommended
More Related Content
What's hot
What's hot (13)
Similar to Reconciliation of Non-GAAP Financial Measures
Similar to Reconciliation of Non-GAAP Financial Measures (20)
More from finance26
More from finance26 (20)
Recently uploaded
Recently uploaded (20)
Reconciliation of Non-GAAP Financial Measures
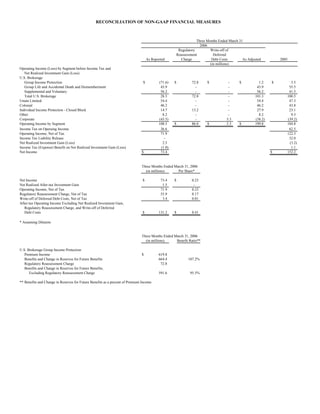
- 1. RECONCILIATION OF NON-GAAP FINANCIAL MEASURES Three Months Ended March 31 2006 Regulatory Write-off of Reassessment Deferred As Reported Charge Debt Costs As Adjusted 2005 (in millions) Operating Income (Loss) by Segment before Income Tax and Net Realized Investment Gain (Loss) U.S. Brokerage Group Income Protection $ (71.6) $ 72.8 $ - $ 1.2 $ 3.5 Group Life and Accidental Death and Dismemberment 43.9 - - 43.9 55.5 Supplemental and Voluntary 56.2 - - 56.2 41.5 Total U.S. Brokerage 28.5 72.8 - 101.3 100.5 Unum Limited 54.4 - - 54.4 47.3 Colonial 46.2 - - 46.2 43.8 Individual Income Protection - Closed Block 14.7 13.2 - 27.9 23.1 Other 8.2 - - 8.2 9.3 Corporate (43.5) - 5.3 (38.2) (39.2) Operating Income by Segment 108.5 $ 86.0 $ 5.3 $ 199.8 184.8 Income Tax on Operaing Income 36.6 62.5 Operating Income, Net of Tax 71.9 122.3 Income Tax Liability Release - 32.0 Net Realized Investment Gain (Loss) 2.5 (3.2) Income Tax (Expense) Benefit on Net Realized Investment Gain (Loss) (1.0) 1.1 Net Income $ 73.4 $ 152.2 Three Months Ended March 31, 2006 (in millions) Per Share* Net Income $ 73.4 $ 0.23 Net Realized After-tax Investment Gain 1.5 - Operating Income, Net of Tax 71.9 0.23 Regulatory Reassessment Charge, Net of Tax 55.9 0.17 Write-off of Deferred Debt Costs, Net of Tax 3.4 0.01 After-tax Operating Income Excluding Net Realized Investment Gain, Regulatory Reassessment Charge, and Write-off of Deferred Debt Costs $ 131.2 $ 0.41 * Assuming Dilution Three Months Ended March 31, 2006 (in millions) Benefit Ratio** U.S. Brokerage Group Income Protection Premium Income $ 619.8 Benefits and Change in Reserves for Future Benefits 664.4 107.2% Regulatory Reassessment Charge 72.8 Benefits and Change in Reserves for Future Benefits, Excluding Regulatory Reassessment Charge 591.6 95.5% ** Benefits and Change in Reserves for Future Benefits as a percent of Premium Income
- 2. RECONCILIATION OF NON-GAAP FINANCIAL MEASURES - Continued As of March 31 2006 2005 (in millions) Per Share (in millions) Per Share Book Value Total Stockholders' Equity $ 6,568.0 $ 21.94 $ 7,052.4 $ 23.68 Exclude Net Unrealized Gain on Securities 256.2 0.86 1,018.3 3.42 Exclude Net Gain on Cash Flow Hedges 203.6 0.68 230.5 0.77 As Adjusted $ 6,108.2 $ 20.40 $ 5,803.6 $ 19.49 As of December 31 2005 2004 Average (in millions) Per Share (in millions) Per Share (in millions) Book Value Total Stockholders' Equity $ 7,363.9 $ 24.66 $ 7,224.1 $ 24.36 Exclude Net Unrealized Gain on Securities 1,040.7 3.49 1,309.8 4.41 Exclude Net Gain on Cash Flow Hedges 273.3 0.91 236.9 0.80 As Adjusted $ 6,049.9 $ 20.26 $ 5,677.4 $ 19.15 $ 5,863.6 Twelve Months Ended December 31, 2005 Net Income $ 513.6 Exclude: Net Realized Investment Loss, Net of Tax (4.3) California Settlement Agreement and Related Matters, Net of Tax (51.6) 1Q05 Income Tax Liabilities 32.0 3Q05 Income Tax Liabilities 10.8 Gain on Sale of Netherlands Branch, Net of Tax 4.0 As Adjusted $ 522.7 Return on Equity (as a percentage of average Stockholders' Equity excluding SFAS 115 and 133 adjustments) 8.9% Outlook Range Twelve Months Ended December 31, 2006 (in millions) Per Share *** (in millions) Per Share *** After-tax Operating Income Excluding Net Realized Investment Gain, Regulatory Reassessment Charge, and Write-off of Deferred Debt Costs $ 555.0 $ 1.65 $ 572.0 $ 1.70 Regulatory Reassessment Charge, Net of Tax (55.9) (0.17) (55.9) (0.17) Write-off of Deferred Debt Costs, Net of Tax (3.4) (0.01) (3.4) (0.01) After-tax Operating Income Excluding Net Realized Investment Gain 495.7 1.47 512.7 1.52 2.5 - 2.5 - Net Realized Investment Gain (1.0) - (1.0) - Income Tax Expense on Net Realized Investment Gain $ 497.2 $ 1.47 $ 514.2 $ 1.52 Net Income *** Assuming Dilution - Forecasted Weighted Average Shares of 337.0 million