SlideShare a Scribd company logo
1 of 5
PEABODY ENERGY CORPORATION
Quarterly Consolidated Statements of Operations
(Dollars in millions, except per share data)

                                                                                            Quarters Ended (Unaudited)                           (Audited)        Peabody
                                                                       March 31,            June 30,         Sept. 30,          Dec. 31,         Calendar        Continuing
                                                                         2004                 2004             2004              2004              2004          Operations2
REVENUES
  Sales                                                                      $744.5              $898.6           $895.2             $1,006.8       $3,545.1        $2,680.9
  Other revenues                                                               27.8                18.2             23.8                 16.7           86.5            82.2
      Total revenues                                                          772.3               916.8            919.0              1,023.5        3,631.6         2,763.1

COSTS AND EXPENSES
 Operating costs and expenses                                                 649.0                  756.8         734.7               825.1         2,965.6         2,206.7
 Depreciation, depletion and amortization                                      59.8                   73.1          70.2                67.1           270.2           205.4
 Asset retirement obligation expense                                           13.0                    8.6          10.1                10.7            42.4            14.8
 Selling and administrative expenses                                           27.8                   32.1          33.6                49.5           143.0            84.5
 Other operating income:
   Net gain on disposal of assets                                             (10.4)                  (1.9)         (1.8)                (9.7)          (23.8)         (18.1)
   Income from equity affiliates                                               (5.6)                  (3.7)         (1.7)                (1.4)          (12.4)          (0.1)
OPERATING PROFIT                                                               38.7                   51.8          73.9                82.2           246.6           269.9
 Interest expense                                                              21.3                   24.6          25.0                25.9            96.8            89.0
 Early debt extinguishment (gains) costs                                         -                      -           (0.6)                2.3             1.7             1.8
 Interest income                                                               (0.9)                  (1.2)         (1.1)               (1.7)           (4.9)           (4.0)

INCOME BEFORE INCOME TAXES
 AND MINORITY INTERESTS                                                        18.3                   28.4          50.6                 55.7          153.0           183.1
  Income tax provision (benefit)                                               (5.7)                 (15.2)          7.0                (12.6)         (26.5)            0.2
  Minority interests                                                            0.3                    0.4           0.2                  0.4            1.3             1.0
INCOME FROM CONTINUING OPERATIONS                                              23.7                   43.2          43.4                67.9           178.2           181.9
  Gain (loss) from discontinued operations, net of taxes                       (1.1)                  (1.7)           -                   -             (2.8)           (5.6)
NET INCOME                                                                    $22.6                  $41.5         $43.4               $67.9          $175.4          $176.3


Diluted number of shares (weighted average in millions)1                     228.62              261.75           263.12               264.90          254.81

Diluted EPS                                                                   $0.10                  $0.16         $0.17               $0.26           $0.70
              1


EBITDA                                                                       $111.5              $133.5           $154.2              $160.0          $559.2

    Reflects the company's March 30, 2005 and February 22, 2006 two-for-one stock splits.
1


    Adjusted for discontinued operations of Patriot Coal Corporation and the assets held for sale.
2


This information is intended to be reviewed in conjunction with the company's filings with the Securities and Exchange Commission.
PEABODY ENERGY CORPORATION
Quarterly Consolidated Income Statements
(Dollars in millions, except per share data)

                                                                                           Quarters Ended (Unaudited)                          (Audited)        Peabody
                                                                       March 31,           June 30,         Sept. 30,          Dec. 31,        Calendar        Continuing
                                                                        2005                 2005             2005              2005             2005          Operations2
REVENUES
  Sales                                                                   $1,062.5           $1,089.8          $1,191.3          $1,201.7         $4,545.3         $3,516.2
  Other revenues                                                              15.0               19.0              32.2              33.0             99.2             81.7
      Total revenues                                                       1,077.5            1,108.8           1,223.5           1,234.7          4,644.5          3,597.9
COSTS AND EXPENSES
 Operating costs and expenses                                                912.9               879.0            986.2               937.7        3,715.8          2,828.4
 Depreciation, depletion and amortization                                     76.0                79.3             77.1                83.7          316.1            244.9
 Asset retirement obligation expense                                           9.2                 7.2              7.4                12.1           35.9             19.9
 Selling and administrative expenses                                          37.8                40.7             57.0                54.4          189.9            132.7
 Other operating income:
   Net gain on disposal or exchange of assets                                (31.1)              (16.5)           (47.6)               (6.3)        (101.5)           (44.4)
   Income from equity affiliates                                              (8.1)              (10.2)            (7.5)               (4.3)         (30.1)           (15.2)
OPERATING PROFIT                                                              80.8               129.3            150.9               157.4          518.4            431.6
 Interest expense                                                             25.6                25.2             25.3                26.8          102.9             98.0
 Interest income                                                              (1.4)               (1.8)            (3.2)               (4.2)         (10.6)            (9.1)
INCOME BEFORE INCOME TAXES
 AND MINORITY INTERESTS                                                       56.6               105.9            128.8               134.8          426.1            342.7
  Income tax provision (benefit)                                               4.4                10.1             14.8               (28.4)           0.9             63.8
  Minority interests                                                           0.3                 0.5              0.7                 1.0            2.5              2.3
INCOME FROM CONTINUING OPERATIONS                                             51.9                   95.3         113.3               162.2          422.7            276.6
    Gain (loss) from discontinued operations, net of taxes                       -                     -                -                 -                -          142.4
NET INCOME                                                                   $51.9               $95.3          $113.3               $162.2         $422.7           $419.0


                                                                            266.80              267.62           268.52              268.98          268.01
Diluted number of shares (weighted average in millions)1
                                                                             $0.19               $0.36            $0.42               $0.60          $1.58
Diluted EPS   1


EBITDA                                                                      $166.0             $215.8           $235.4               $253.2         $870.4

    Reflects the company's March 30, 2005 and February 22, 2006 two-for-one stock splits.
1


    Adjusted for discontinued operations of Patriot Coal Corporation and the assets held for sale.
2


This information is intended to be reviewed in conjunction with the company's filings with the Securities and Exchange Commission.
PEABODY ENERGY CORPORATION
Quarterly Consolidated Income Statements
(Dollars in millions, except per share data)

                                                                                            Quarters Ended (Unaudited)                           (Audited)       Peabody
                                                                        March 31,           June 30,         Sept. 30,          Dec. 31,         Calendar       Continuing
                                                                         2006                 2006             2006              2006              2006         Operations2
REVENUES
  Sales                                                                    $1,288.9            $1,293.7         $1,223.3             $1,339.1       $5,145.0        $3,944.8
  Other revenues                                                               22.9                22.7             41.7                 24.0          111.3           106.0
      Total revenues                                                        1,311.8             1,316.4          1,265.0              1,363.1        5,256.3         4,050.8

COSTS AND EXPENSES
 Operating costs and expenses                                               1,022.4             1,053.5          1,003.0              1,077.1         4,156.0         3,088.3
 Depreciation, depletion and amortization                                      81.0                91.5             90.6                114.1           377.2           284.1
 Asset retirement obligation expense                                            7.2                11.6              7.1                 14.2            40.1            14.3
 Selling and administrative expenses                                           46.5                40.8             31.5                 57.1           175.9           127.9
 Other operating income:
   Net gain on disposal or exchange of assets                                   (9.2)                (50.0)        (35.0)               (37.9)        (132.1)           (53.5)
   Income from equity affiliates                                                (7.3)                 (6.7)         (5.2)                (4.7)         (23.9)           (22.8)

OPERATING PROFIT                                                              171.2                  175.7         173.0               143.2           663.1           612.5
 Interest expense                                                              27.4                   25.7          26.4                63.9           143.4           137.7
 Early debt extinguishment costs (gains)                                         -                    (0.4)           -                  1.8             1.4             1.4
 Interest income                                                               (2.6)                  (1.5)         (1.9)               (6.7)          (12.7)          (11.3)

INCOME BEFORE INCOME TAXES
 AND MINORITY INTERESTS                                                       146.4                  151.9         148.5                 84.2          531.0           484.7
  Income tax provision (benefit)                                               11.5                   (3.3)          2.7                (92.4)         (81.5)          (90.1)
  Minority interests                                                            4.7                    1.8           3.8                  1.5           11.8             0.6

INCOME FROM CONTINUING OPERATIONS                                             130.2                  153.4         142.0               175.1           600.7           574.2
  Gain (loss) from discontinued operations, net of taxes                         -                      -             -                   -               -             37.6

NET INCOME                                                                   $130.2              $153.4           $142.0              $175.1          $600.7          $611.8


Diluted number of shares (weighted average in millions) 1                    269.36              269.76           268.82               268.14          269.19
Diluted EPS                                                                   $0.48                  $0.57         $0.53               $0.65           $2.23
              1


EBITDA                                                                       $259.4              $278.8           $270.7              $271.5        $1,080.4

    Reflects the company's February 22, 2006 two-for-one stock split.
1


    Adjusted for discontinued operations of Patriot Coal Corporation and the assets held for sale.
2


This information is intended to be reviewed in conjunction with the company's filings with the Securities and Exchange Commission.
PEABODY ENERGY CORPORATION
Quarterly Consolidated Income Statements
(Dollars in millions, except per share data)

                                                                                                      Quarters Ended (Unaudited)                                       (Audited)
                                                                        March 31,                  June 30,               Sept. 30,              Dec. 31,             Year Ended
                                                                         2007                        2007                   2007                  2007               Dec. 31, 2007
REVENUES
  Sales                                                                        $1,059.5                 $1,023.6                     $1,138.0         $1,114.1               $4,335.1
  Other revenues                                                                   50.3                     45.2                         60.5             54.0                  210.0
      Total revenues                                                            1,109.8                  1,068.8                      1,198.5          1,168.1                4,545.1

COSTS AND EXPENSES
 Operating costs and expenses                                                     846.7                     823.1                      980.1                882.6             3,532.5
 Depreciation, depletion and amortization                                          81.9                      88.5                       89.3                 92.5               352.2
 Asset retirement obligation expense                                                5.7                       3.8                        5.0                  9.1                23.7
 Selling and administrative expenses                                               31.7                      32.1                       33.2                 50.1               147.1
 Other operating income:
   Net gain on disposal or exchange of assets                                       (1.4)                   (53.0)                      (21.9)              (12.3)              (88.6)
   Income from equity affiliates                                                    (2.2)                    (4.3)                       (2.9)               (5.0)              (14.5)

OPERATING PROFIT                                                                  147.4                     178.6                      115.7                151.1               592.7
 Interest expense                                                                  57.5                      58.6                       58.7                 60.2               235.0
 Interest income                                                                   (2.8)                     (1.5)                      (1.5)                (1.3)               (7.1)

INCOME BEFORE INCOME TAXES
 AND MINORITY INTERESTS                                                             92.7                    121.5                       58.5              92.2                  364.8
  Income tax provision (benefit)                                                    11.1                     17.0                        6.7            (107.6)                 (72.9)
  Minority interests                                                                (0.3)                     4.8                       (3.2)             (3.6)                  (2.3)
INCOME FROM CONTINUING OPERATIONS                                                   81.9                     99.7                       55.0                203.4               440.0
  Income (loss) from discontinued operations, net of taxes                           6.6                      8.0                       (22.7)          (167.6)                (175.7)
NET INCOME                                                                        $88.5                   $107.7                       $32.3                $35.8              $264.3


Diluted number of shares (weighted average in millions)                          268.12                    268.71                      268.94           270.54                 269.17

Diluted EPS                                                                       $0.30                     $0.37                      $0.20                $0.13               $0.98

EBITDA                                                                          $235.0                    $270.9                      $210.0            $252.7                 $968.6


This information is intended to be reviewed in conjunction with the company's filings with the Securities and Exchange Commission.
PEABODY ENERGY CORPORATION
Quarterly Consolidated Income Statements
(Dollars in millions, except per share data)
(Unaudited)
                                                                                                             Quarter Ended
                                                                        March 31,                 June 30,                   Sept. 30,            Dec. 31,             Year Ended
                                                                         2008                       2008                      2008                 2008               Dec. 31, 2008

REVENUES
  Sales                                                                       $1,189.7                  $1,422.1                     $1,761.8          $1,662.7               $6,036.3
  Other revenues                                                                  86.3                     108.8                        143.9             218.1                  557.1
      Total revenues                                                           1,276.0                   1,530.9                      1,905.7           1,880.8                6,593.4

COSTS AND EXPENSES
  Operating costs and expenses                                                  1,013.7                  1,048.5                      1,253.0           1,301.8                4,617.2
  Depreciation, depletion and amortization                                         94.0                     93.6                        103.8             114.9                  406.2
  Asset retirement obligation expense                                               6.8                      9.2                         15.8              16.4                   48.2
  Selling and administrative expenses                                              50.9                     43.1                         44.2              63.6                  201.8
  Other operating income:
    Net gain on disposal or exchange of assets                                    (59.4)                      (3.6)                       (4.8)               (5.1)              (72.9)
    (Income) loss from equity affiliates                                           (2.7)                      (3.7)                        3.5                 3.0                  -

OPERATING PROFIT                                                                 172.7                       343.8                       490.2               386.2             1,392.9
  Interest expense                                                                59.3                        57.6                        54.1                55.2               226.2
  Interest income                                                                 (1.1)                       (2.5)                       (3.5)               (3.0)              (10.1)

INCOME BEFORE INCOME TAXES
 AND MINORITY INTERESTS                                                          114.5                       288.7                       439.6               334.0             1,176.8
  Income tax provision                                                            44.1                        43.6                        60.2                37.9               185.8
  Minority interests                                                               0.9                         2.5                         2.3                 0.5                 6.2
INCOME FROM CONTINUING OPERATIONS                                                   69.5                     242.6                       377.1               295.6               984.8
  Loss from discontinued operations, net of taxes                                 (12.3)                      (9.2)                       (7.5)               (2.3)              (31.3)
NET INCOME                                                                       $57.2                    $233.4                      $369.6             $293.3                $953.5


Diluted number of shares (weighted average in millions)                          272.14                    272.66                      272.62            267.39                 271.28

Diluted EPS                                                                      $0.26                       $0.89                       $1.38               $1.10               $3.51

EBITDA                                                                          $273.5                    $446.6                      $609.8             $517.5               $1,847.3


This information is intended to be reviewed in conjunction with the company's filings with the Securities and Exchange Commission.

More Related Content

What's hot

tjx Annual Reports1998
tjx Annual Reports1998tjx Annual Reports1998
tjx Annual Reports1998
finance14
 
Q1 2009 Earning Report of Smith International, Inc.
Q1 2009 Earning Report of Smith International, Inc. Q1 2009 Earning Report of Smith International, Inc.
Q1 2009 Earning Report of Smith International, Inc.
earningreport earningreport
 
omnicom group Q3 2007 Earnings Release (
omnicom group  Q3 2007 Earnings Release (omnicom group  Q3 2007 Earnings Release (
omnicom group Q3 2007 Earnings Release (
finance22
 
aetna table 2005 4th
aetna table 2005 4thaetna table 2005 4th
aetna table 2005 4th
finance9
 
northan trust corp._Financial_web_2006
northan trust corp._Financial_web_2006northan trust corp._Financial_web_2006
northan trust corp._Financial_web_2006
finance38
 
Big_Lots_AR2001FSO
Big_Lots_AR2001FSOBig_Lots_AR2001FSO
Big_Lots_AR2001FSO
finance50
 
conoco phillips 2006Fourth Quarter
conoco phillips 2006Fourth Quarterconoco phillips 2006Fourth Quarter
conoco phillips 2006Fourth Quarter
finance1
 
MGMM ar00
MGMM  ar00MGMM  ar00
MGMM ar00
finance29
 
yum brands annual reports 2001
 yum brands annual reports 2001 yum brands annual reports 2001
yum brands annual reports 2001
finance26
 
RyderPresReleasTablesQ32005
RyderPresReleasTablesQ32005RyderPresReleasTablesQ32005
RyderPresReleasTablesQ32005
finance44
 
Ryder2QFinInfo
Ryder2QFinInfoRyder2QFinInfo
Ryder2QFinInfo
finance44
 
Anthem Southeast Historical Data
Anthem Southeast Historical DataAnthem Southeast Historical Data
Anthem Southeast Historical Data
finance4
 
ppg industries 3Q2007EARNINGSTABLES
ppg industries 3Q2007EARNINGSTABLESppg industries 3Q2007EARNINGSTABLES
ppg industries 3Q2007EARNINGSTABLES
finance22
 

What's hot (13)

tjx Annual Reports1998
tjx Annual Reports1998tjx Annual Reports1998
tjx Annual Reports1998
 
Q1 2009 Earning Report of Smith International, Inc.
Q1 2009 Earning Report of Smith International, Inc. Q1 2009 Earning Report of Smith International, Inc.
Q1 2009 Earning Report of Smith International, Inc.
 
omnicom group Q3 2007 Earnings Release (
omnicom group  Q3 2007 Earnings Release (omnicom group  Q3 2007 Earnings Release (
omnicom group Q3 2007 Earnings Release (
 
aetna table 2005 4th
aetna table 2005 4thaetna table 2005 4th
aetna table 2005 4th
 
northan trust corp._Financial_web_2006
northan trust corp._Financial_web_2006northan trust corp._Financial_web_2006
northan trust corp._Financial_web_2006
 
Big_Lots_AR2001FSO
Big_Lots_AR2001FSOBig_Lots_AR2001FSO
Big_Lots_AR2001FSO
 
conoco phillips 2006Fourth Quarter
conoco phillips 2006Fourth Quarterconoco phillips 2006Fourth Quarter
conoco phillips 2006Fourth Quarter
 
MGMM ar00
MGMM  ar00MGMM  ar00
MGMM ar00
 
yum brands annual reports 2001
 yum brands annual reports 2001 yum brands annual reports 2001
yum brands annual reports 2001
 
RyderPresReleasTablesQ32005
RyderPresReleasTablesQ32005RyderPresReleasTablesQ32005
RyderPresReleasTablesQ32005
 
Ryder2QFinInfo
Ryder2QFinInfoRyder2QFinInfo
Ryder2QFinInfo
 
Anthem Southeast Historical Data
Anthem Southeast Historical DataAnthem Southeast Historical Data
Anthem Southeast Historical Data
 
ppg industries 3Q2007EARNINGSTABLES
ppg industries 3Q2007EARNINGSTABLESppg industries 3Q2007EARNINGSTABLES
ppg industries 3Q2007EARNINGSTABLES
 

Viewers also liked

ecolab ClearlyEcolab
ecolab  ClearlyEcolabecolab  ClearlyEcolab
ecolab ClearlyEcolab
finance37
 
newmont mining Final_West_Coast_Presentation
newmont mining Final_West_Coast_Presentationnewmont mining Final_West_Coast_Presentation
newmont mining Final_West_Coast_Presentation
finance37
 
western digital proxy00
western digital  proxy00western digital  proxy00
western digital proxy00
finance37
 
Network Hospitals
Network HospitalsNetwork Hospitals
Network Hospitals
gauravbh77
 
newmont mining 2006_Annual_Report
newmont mining 2006_Annual_Reportnewmont mining 2006_Annual_Report
newmont mining 2006_Annual_Report
finance37
 
western digital 2278-001005-A03
western digital  2278-001005-A03western digital  2278-001005-A03
western digital 2278-001005-A03
finance37
 
western digital annual02
western digital  annual02western digital  annual02
western digital annual02
finance37
 

Viewers also liked (7)

ecolab ClearlyEcolab
ecolab  ClearlyEcolabecolab  ClearlyEcolab
ecolab ClearlyEcolab
 
newmont mining Final_West_Coast_Presentation
newmont mining Final_West_Coast_Presentationnewmont mining Final_West_Coast_Presentation
newmont mining Final_West_Coast_Presentation
 
western digital proxy00
western digital  proxy00western digital  proxy00
western digital proxy00
 
Network Hospitals
Network HospitalsNetwork Hospitals
Network Hospitals
 
newmont mining 2006_Annual_Report
newmont mining 2006_Annual_Reportnewmont mining 2006_Annual_Report
newmont mining 2006_Annual_Report
 
western digital 2278-001005-A03
western digital  2278-001005-A03western digital  2278-001005-A03
western digital 2278-001005-A03
 
western digital annual02
western digital  annual02western digital  annual02
western digital annual02
 

Similar to PEABODY ENERGY BTUQuarterlyData-website

RYDERFINAL 2Q05TablesFinal
RYDERFINAL 2Q05TablesFinalRYDERFINAL 2Q05TablesFinal
RYDERFINAL 2Q05TablesFinal
finance44
 
lemark international lxk_2006ar
lemark international lxk_2006arlemark international lxk_2006ar
lemark international lxk_2006ar
finance47
 
Reconciliations and Financial Slides from Safeway Investor Conference
	Reconciliations and Financial Slides from Safeway Investor Conference	Reconciliations and Financial Slides from Safeway Investor Conference
Reconciliations and Financial Slides from Safeway Investor Conference
finance6
 
lemark international lxk_AR2005
lemark international lxk_AR2005lemark international lxk_AR2005
lemark international lxk_AR2005
finance47
 
omnicom group Q1 2008 Earnings Release
omnicom group  Q1 2008 Earnings Release omnicom group  Q1 2008 Earnings Release
omnicom group Q1 2008 Earnings Release
finance22
 
RYDERFINAL2Q06_PRTables
RYDERFINAL2Q06_PRTablesRYDERFINAL2Q06_PRTables
RYDERFINAL2Q06_PRTables
finance44
 
RYDERFINAL2Q06_PRTables
RYDERFINAL2Q06_PRTablesRYDERFINAL2Q06_PRTables
RYDERFINAL2Q06_PRTables
finance44
 
RYDERFINAL Q207tables
RYDERFINAL Q207tablesRYDERFINAL Q207tables
RYDERFINAL Q207tables
finance44
 
Q207tables
Q207tablesQ207tables
Q207tables
finance44
 
Q207tables
Q207tablesQ207tables
Q207tables
finance44
 
RYDERFINAL Q207tables
RYDERFINAL Q207tablesRYDERFINAL Q207tables
RYDERFINAL Q207tables
finance44
 
RyderPresReleasTablesQ32005
RyderPresReleasTablesQ32005RyderPresReleasTablesQ32005
RyderPresReleasTablesQ32005
finance44
 
northan trust corp._2007FAR
northan trust corp._2007FARnorthan trust corp._2007FAR
northan trust corp._2007FAR
finance38
 
asbury
asburyasbury
asbury
finance36
 
RYDERFINAL Q405tables
RYDERFINAL Q405tablesRYDERFINAL Q405tables
RYDERFINAL Q405tables
finance44
 
RYDERFINAL Q405tables
RYDERFINAL Q405tablesRYDERFINAL Q405tables
RYDERFINAL Q405tables
finance44
 
Reconciliations from Recent Conferences
Reconciliations from Recent ConferencesReconciliations from Recent Conferences
Reconciliations from Recent Conferences
finance6
 
Ryder2QFinInfo
Ryder2QFinInfoRyder2QFinInfo
Ryder2QFinInfo
finance44
 
Ryder2QFinInfo
Ryder2QFinInfoRyder2QFinInfo
Ryder2QFinInfo
finance44
 
Progressive 2003 review
Progressive 2003 reviewProgressive 2003 review
Progressive 2003 review
finance18
 

Similar to PEABODY ENERGY BTUQuarterlyData-website (20)

RYDERFINAL 2Q05TablesFinal
RYDERFINAL 2Q05TablesFinalRYDERFINAL 2Q05TablesFinal
RYDERFINAL 2Q05TablesFinal
 
lemark international lxk_2006ar
lemark international lxk_2006arlemark international lxk_2006ar
lemark international lxk_2006ar
 
Reconciliations and Financial Slides from Safeway Investor Conference
	Reconciliations and Financial Slides from Safeway Investor Conference	Reconciliations and Financial Slides from Safeway Investor Conference
Reconciliations and Financial Slides from Safeway Investor Conference
 
lemark international lxk_AR2005
lemark international lxk_AR2005lemark international lxk_AR2005
lemark international lxk_AR2005
 
omnicom group Q1 2008 Earnings Release
omnicom group  Q1 2008 Earnings Release omnicom group  Q1 2008 Earnings Release
omnicom group Q1 2008 Earnings Release
 
RYDERFINAL2Q06_PRTables
RYDERFINAL2Q06_PRTablesRYDERFINAL2Q06_PRTables
RYDERFINAL2Q06_PRTables
 
RYDERFINAL2Q06_PRTables
RYDERFINAL2Q06_PRTablesRYDERFINAL2Q06_PRTables
RYDERFINAL2Q06_PRTables
 
RYDERFINAL Q207tables
RYDERFINAL Q207tablesRYDERFINAL Q207tables
RYDERFINAL Q207tables
 
Q207tables
Q207tablesQ207tables
Q207tables
 
Q207tables
Q207tablesQ207tables
Q207tables
 
RYDERFINAL Q207tables
RYDERFINAL Q207tablesRYDERFINAL Q207tables
RYDERFINAL Q207tables
 
RyderPresReleasTablesQ32005
RyderPresReleasTablesQ32005RyderPresReleasTablesQ32005
RyderPresReleasTablesQ32005
 
northan trust corp._2007FAR
northan trust corp._2007FARnorthan trust corp._2007FAR
northan trust corp._2007FAR
 
asbury
asburyasbury
asbury
 
RYDERFINAL Q405tables
RYDERFINAL Q405tablesRYDERFINAL Q405tables
RYDERFINAL Q405tables
 
RYDERFINAL Q405tables
RYDERFINAL Q405tablesRYDERFINAL Q405tables
RYDERFINAL Q405tables
 
Reconciliations from Recent Conferences
Reconciliations from Recent ConferencesReconciliations from Recent Conferences
Reconciliations from Recent Conferences
 
Ryder2QFinInfo
Ryder2QFinInfoRyder2QFinInfo
Ryder2QFinInfo
 
Ryder2QFinInfo
Ryder2QFinInfoRyder2QFinInfo
Ryder2QFinInfo
 
Progressive 2003 review
Progressive 2003 reviewProgressive 2003 review
Progressive 2003 review
 

More from finance37

western digital q105iis
western digital  q105iiswestern digital  q105iis
western digital q105iis
finance37
 
western digital q205iis
western digital  q205iiswestern digital  q205iis
western digital q205iis
finance37
 
western digital q305iis
western digital  q305iiswestern digital  q305iis
western digital q305iis
finance37
 
western digital q405iis
western digital  q405iiswestern digital  q405iis
western digital q405iis
finance37
 
western digital q106iis
western digital  q106iiswestern digital  q106iis
western digital q106iis
finance37
 
western digital q206iis
western digital  q206iiswestern digital  q206iis
western digital q206iis
finance37
 
western digital q306iis
western digital  q306iiswestern digital  q306iis
western digital q306iis
finance37
 
western digital q406iis
western digital  q406iiswestern digital  q406iis
western digital q406iis
finance37
 
western digital q107iis
western digital  q107iiswestern digital  q107iis
western digital q107iis
finance37
 
western digital q207iis
western digital  q207iiswestern digital  q207iis
western digital q207iis
finance37
 
western digital q307iis
western digital  q307iiswestern digital  q307iis
western digital q307iis
finance37
 
western digital Q407iis
western digital  Q407iiswestern digital  Q407iis
western digital Q407iis
finance37
 
western digital q108iis
western digital  q108iiswestern digital  q108iis
western digital q108iis
finance37
 
western digital q208iis
western digital  q208iiswestern digital  q208iis
western digital q208iis
finance37
 
western digital q308iis
western digital  q308iiswestern digital  q308iis
western digital q308iis
finance37
 
western digital q408iis
western digital  q408iiswestern digital  q408iis
western digital q408iis
finance37
 
western digital q109iis
western digital  q109iiswestern digital  q109iis
western digital q109iis
finance37
 
western digital q209iis
western digital  q209iiswestern digital  q209iis
western digital q209iis
finance37
 
western digital ap95
western digital  ap95western digital  ap95
western digital ap95
finance37
 
western digital annual96
western digital  annual96western digital  annual96
western digital annual96
finance37
 

More from finance37 (20)

western digital q105iis
western digital  q105iiswestern digital  q105iis
western digital q105iis
 
western digital q205iis
western digital  q205iiswestern digital  q205iis
western digital q205iis
 
western digital q305iis
western digital  q305iiswestern digital  q305iis
western digital q305iis
 
western digital q405iis
western digital  q405iiswestern digital  q405iis
western digital q405iis
 
western digital q106iis
western digital  q106iiswestern digital  q106iis
western digital q106iis
 
western digital q206iis
western digital  q206iiswestern digital  q206iis
western digital q206iis
 
western digital q306iis
western digital  q306iiswestern digital  q306iis
western digital q306iis
 
western digital q406iis
western digital  q406iiswestern digital  q406iis
western digital q406iis
 
western digital q107iis
western digital  q107iiswestern digital  q107iis
western digital q107iis
 
western digital q207iis
western digital  q207iiswestern digital  q207iis
western digital q207iis
 
western digital q307iis
western digital  q307iiswestern digital  q307iis
western digital q307iis
 
western digital Q407iis
western digital  Q407iiswestern digital  Q407iis
western digital Q407iis
 
western digital q108iis
western digital  q108iiswestern digital  q108iis
western digital q108iis
 
western digital q208iis
western digital  q208iiswestern digital  q208iis
western digital q208iis
 
western digital q308iis
western digital  q308iiswestern digital  q308iis
western digital q308iis
 
western digital q408iis
western digital  q408iiswestern digital  q408iis
western digital q408iis
 
western digital q109iis
western digital  q109iiswestern digital  q109iis
western digital q109iis
 
western digital q209iis
western digital  q209iiswestern digital  q209iis
western digital q209iis
 
western digital ap95
western digital  ap95western digital  ap95
western digital ap95
 
western digital annual96
western digital  annual96western digital  annual96
western digital annual96
 

Recently uploaded

MASTERING FOREX: STRATEGIES FOR SUCCESS.pdf
MASTERING FOREX: STRATEGIES FOR SUCCESS.pdfMASTERING FOREX: STRATEGIES FOR SUCCESS.pdf
MASTERING FOREX: STRATEGIES FOR SUCCESS.pdf
Cocity Enterprises
 

Recently uploaded (20)

Mahendragarh Escorts 🥰 8617370543 Call Girls Offer VIP Hot Girls
Mahendragarh Escorts 🥰 8617370543 Call Girls Offer VIP Hot GirlsMahendragarh Escorts 🥰 8617370543 Call Girls Offer VIP Hot Girls
Mahendragarh Escorts 🥰 8617370543 Call Girls Offer VIP Hot Girls
 
Fixed exchange rate and flexible exchange rate.pptx
Fixed exchange rate and flexible exchange rate.pptxFixed exchange rate and flexible exchange rate.pptx
Fixed exchange rate and flexible exchange rate.pptx
 
Premium Call Girls Bangalore Call Girls Service Just Call 🍑👄6378878445 🍑👄 Top...
Premium Call Girls Bangalore Call Girls Service Just Call 🍑👄6378878445 🍑👄 Top...Premium Call Girls Bangalore Call Girls Service Just Call 🍑👄6378878445 🍑👄 Top...
Premium Call Girls Bangalore Call Girls Service Just Call 🍑👄6378878445 🍑👄 Top...
 
Virar Best Sex Call Girls Number-đź“žđź“ž9833754194-Poorbi Nalasopara Housewife Cal...
Virar Best Sex Call Girls Number-đź“žđź“ž9833754194-Poorbi Nalasopara Housewife Cal...Virar Best Sex Call Girls Number-đź“žđź“ž9833754194-Poorbi Nalasopara Housewife Cal...
Virar Best Sex Call Girls Number-đź“žđź“ž9833754194-Poorbi Nalasopara Housewife Cal...
 
W.D. Gann Theory Complete Information.pdf
W.D. Gann Theory Complete Information.pdfW.D. Gann Theory Complete Information.pdf
W.D. Gann Theory Complete Information.pdf
 
Bhubaneswar🌹Ravi Tailkes ❤CALL GIRLS 9777949614 💟 CALL GIRLS IN bhubaneswar ...
Bhubaneswar🌹Ravi Tailkes  ❤CALL GIRLS 9777949614 💟 CALL GIRLS IN bhubaneswar ...Bhubaneswar🌹Ravi Tailkes  ❤CALL GIRLS 9777949614 💟 CALL GIRLS IN bhubaneswar ...
Bhubaneswar🌹Ravi Tailkes ❤CALL GIRLS 9777949614 💟 CALL GIRLS IN bhubaneswar ...
 
logistics industry development power point ppt.pdf
logistics industry development power point ppt.pdflogistics industry development power point ppt.pdf
logistics industry development power point ppt.pdf
 
Seeman_Fiintouch_LLP_Newsletter_May-2024.pdf
Seeman_Fiintouch_LLP_Newsletter_May-2024.pdfSeeman_Fiintouch_LLP_Newsletter_May-2024.pdf
Seeman_Fiintouch_LLP_Newsletter_May-2024.pdf
 
20240419-SMC-submission-Annual-Superannuation-Performance-Test-–-design-optio...
20240419-SMC-submission-Annual-Superannuation-Performance-Test-–-design-optio...20240419-SMC-submission-Annual-Superannuation-Performance-Test-–-design-optio...
20240419-SMC-submission-Annual-Superannuation-Performance-Test-–-design-optio...
 
7 steps to achieve financial freedom.pdf
7 steps to achieve financial freedom.pdf7 steps to achieve financial freedom.pdf
7 steps to achieve financial freedom.pdf
 
Escorts Indore Call Girls-9155612368-Vijay Nagar Decent Fantastic Call Girls ...
Escorts Indore Call Girls-9155612368-Vijay Nagar Decent Fantastic Call Girls ...Escorts Indore Call Girls-9155612368-Vijay Nagar Decent Fantastic Call Girls ...
Escorts Indore Call Girls-9155612368-Vijay Nagar Decent Fantastic Call Girls ...
 
Female Russian Escorts Mumbai Call Girls-((ANdheri))9833754194-Jogeshawri Fre...
Female Russian Escorts Mumbai Call Girls-((ANdheri))9833754194-Jogeshawri Fre...Female Russian Escorts Mumbai Call Girls-((ANdheri))9833754194-Jogeshawri Fre...
Female Russian Escorts Mumbai Call Girls-((ANdheri))9833754194-Jogeshawri Fre...
 
Bhubaneswar🌹Kalpana Mesuem ❤CALL GIRLS 9777949614 💟 CALL GIRLS IN bhubaneswa...
Bhubaneswar🌹Kalpana Mesuem  ❤CALL GIRLS 9777949614 💟 CALL GIRLS IN bhubaneswa...Bhubaneswar🌹Kalpana Mesuem  ❤CALL GIRLS 9777949614 💟 CALL GIRLS IN bhubaneswa...
Bhubaneswar🌹Kalpana Mesuem ❤CALL GIRLS 9777949614 💟 CALL GIRLS IN bhubaneswa...
 
Lion One Corporate Presentation May 2024
Lion One Corporate Presentation May 2024Lion One Corporate Presentation May 2024
Lion One Corporate Presentation May 2024
 
Certified Kala Jadu, Black magic specialist in Rawalpindi and Bangali Amil ba...
Certified Kala Jadu, Black magic specialist in Rawalpindi and Bangali Amil ba...Certified Kala Jadu, Black magic specialist in Rawalpindi and Bangali Amil ba...
Certified Kala Jadu, Black magic specialist in Rawalpindi and Bangali Amil ba...
 
7 tips trading Deriv Accumulator Options
7 tips trading Deriv Accumulator Options7 tips trading Deriv Accumulator Options
7 tips trading Deriv Accumulator Options
 
MASTERING FOREX: STRATEGIES FOR SUCCESS.pdf
MASTERING FOREX: STRATEGIES FOR SUCCESS.pdfMASTERING FOREX: STRATEGIES FOR SUCCESS.pdf
MASTERING FOREX: STRATEGIES FOR SUCCESS.pdf
 
cost-volume-profit analysis.ppt(managerial accounting).pptx
cost-volume-profit analysis.ppt(managerial accounting).pptxcost-volume-profit analysis.ppt(managerial accounting).pptx
cost-volume-profit analysis.ppt(managerial accounting).pptx
 
Female Escorts Service in Hyderabad Starting with 5000/- for Savita Escorts S...
Female Escorts Service in Hyderabad Starting with 5000/- for Savita Escorts S...Female Escorts Service in Hyderabad Starting with 5000/- for Savita Escorts S...
Female Escorts Service in Hyderabad Starting with 5000/- for Savita Escorts S...
 
Test bank for advanced assessment interpreting findings and formulating diffe...
Test bank for advanced assessment interpreting findings and formulating diffe...Test bank for advanced assessment interpreting findings and formulating diffe...
Test bank for advanced assessment interpreting findings and formulating diffe...
 

PEABODY ENERGY BTUQuarterlyData-website

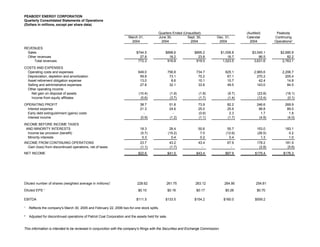
  • 1. PEABODY ENERGY CORPORATION Quarterly Consolidated Statements of Operations (Dollars in millions, except per share data) Quarters Ended (Unaudited) (Audited) Peabody March 31, June 30, Sept. 30, Dec. 31, Calendar Continuing 2004 2004 2004 2004 2004 Operations2 REVENUES Sales $744.5 $898.6 $895.2 $1,006.8 $3,545.1 $2,680.9 Other revenues 27.8 18.2 23.8 16.7 86.5 82.2 Total revenues 772.3 916.8 919.0 1,023.5 3,631.6 2,763.1 COSTS AND EXPENSES Operating costs and expenses 649.0 756.8 734.7 825.1 2,965.6 2,206.7 Depreciation, depletion and amortization 59.8 73.1 70.2 67.1 270.2 205.4 Asset retirement obligation expense 13.0 8.6 10.1 10.7 42.4 14.8 Selling and administrative expenses 27.8 32.1 33.6 49.5 143.0 84.5 Other operating income: Net gain on disposal of assets (10.4) (1.9) (1.8) (9.7) (23.8) (18.1) Income from equity affiliates (5.6) (3.7) (1.7) (1.4) (12.4) (0.1) OPERATING PROFIT 38.7 51.8 73.9 82.2 246.6 269.9 Interest expense 21.3 24.6 25.0 25.9 96.8 89.0 Early debt extinguishment (gains) costs - - (0.6) 2.3 1.7 1.8 Interest income (0.9) (1.2) (1.1) (1.7) (4.9) (4.0) INCOME BEFORE INCOME TAXES AND MINORITY INTERESTS 18.3 28.4 50.6 55.7 153.0 183.1 Income tax provision (benefit) (5.7) (15.2) 7.0 (12.6) (26.5) 0.2 Minority interests 0.3 0.4 0.2 0.4 1.3 1.0 INCOME FROM CONTINUING OPERATIONS 23.7 43.2 43.4 67.9 178.2 181.9 Gain (loss) from discontinued operations, net of taxes (1.1) (1.7) - - (2.8) (5.6) NET INCOME $22.6 $41.5 $43.4 $67.9 $175.4 $176.3 Diluted number of shares (weighted average in millions)1 228.62 261.75 263.12 264.90 254.81 Diluted EPS $0.10 $0.16 $0.17 $0.26 $0.70 1 EBITDA $111.5 $133.5 $154.2 $160.0 $559.2 Reflects the company's March 30, 2005 and February 22, 2006 two-for-one stock splits. 1 Adjusted for discontinued operations of Patriot Coal Corporation and the assets held for sale. 2 This information is intended to be reviewed in conjunction with the company's filings with the Securities and Exchange Commission.
  • 2. PEABODY ENERGY CORPORATION Quarterly Consolidated Income Statements (Dollars in millions, except per share data) Quarters Ended (Unaudited) (Audited) Peabody March 31, June 30, Sept. 30, Dec. 31, Calendar Continuing 2005 2005 2005 2005 2005 Operations2 REVENUES Sales $1,062.5 $1,089.8 $1,191.3 $1,201.7 $4,545.3 $3,516.2 Other revenues 15.0 19.0 32.2 33.0 99.2 81.7 Total revenues 1,077.5 1,108.8 1,223.5 1,234.7 4,644.5 3,597.9 COSTS AND EXPENSES Operating costs and expenses 912.9 879.0 986.2 937.7 3,715.8 2,828.4 Depreciation, depletion and amortization 76.0 79.3 77.1 83.7 316.1 244.9 Asset retirement obligation expense 9.2 7.2 7.4 12.1 35.9 19.9 Selling and administrative expenses 37.8 40.7 57.0 54.4 189.9 132.7 Other operating income: Net gain on disposal or exchange of assets (31.1) (16.5) (47.6) (6.3) (101.5) (44.4) Income from equity affiliates (8.1) (10.2) (7.5) (4.3) (30.1) (15.2) OPERATING PROFIT 80.8 129.3 150.9 157.4 518.4 431.6 Interest expense 25.6 25.2 25.3 26.8 102.9 98.0 Interest income (1.4) (1.8) (3.2) (4.2) (10.6) (9.1) INCOME BEFORE INCOME TAXES AND MINORITY INTERESTS 56.6 105.9 128.8 134.8 426.1 342.7 Income tax provision (benefit) 4.4 10.1 14.8 (28.4) 0.9 63.8 Minority interests 0.3 0.5 0.7 1.0 2.5 2.3 INCOME FROM CONTINUING OPERATIONS 51.9 95.3 113.3 162.2 422.7 276.6 Gain (loss) from discontinued operations, net of taxes - - - - - 142.4 NET INCOME $51.9 $95.3 $113.3 $162.2 $422.7 $419.0 266.80 267.62 268.52 268.98 268.01 Diluted number of shares (weighted average in millions)1 $0.19 $0.36 $0.42 $0.60 $1.58 Diluted EPS 1 EBITDA $166.0 $215.8 $235.4 $253.2 $870.4 Reflects the company's March 30, 2005 and February 22, 2006 two-for-one stock splits. 1 Adjusted for discontinued operations of Patriot Coal Corporation and the assets held for sale. 2 This information is intended to be reviewed in conjunction with the company's filings with the Securities and Exchange Commission.
  • 3. PEABODY ENERGY CORPORATION Quarterly Consolidated Income Statements (Dollars in millions, except per share data) Quarters Ended (Unaudited) (Audited) Peabody March 31, June 30, Sept. 30, Dec. 31, Calendar Continuing 2006 2006 2006 2006 2006 Operations2 REVENUES Sales $1,288.9 $1,293.7 $1,223.3 $1,339.1 $5,145.0 $3,944.8 Other revenues 22.9 22.7 41.7 24.0 111.3 106.0 Total revenues 1,311.8 1,316.4 1,265.0 1,363.1 5,256.3 4,050.8 COSTS AND EXPENSES Operating costs and expenses 1,022.4 1,053.5 1,003.0 1,077.1 4,156.0 3,088.3 Depreciation, depletion and amortization 81.0 91.5 90.6 114.1 377.2 284.1 Asset retirement obligation expense 7.2 11.6 7.1 14.2 40.1 14.3 Selling and administrative expenses 46.5 40.8 31.5 57.1 175.9 127.9 Other operating income: Net gain on disposal or exchange of assets (9.2) (50.0) (35.0) (37.9) (132.1) (53.5) Income from equity affiliates (7.3) (6.7) (5.2) (4.7) (23.9) (22.8) OPERATING PROFIT 171.2 175.7 173.0 143.2 663.1 612.5 Interest expense 27.4 25.7 26.4 63.9 143.4 137.7 Early debt extinguishment costs (gains) - (0.4) - 1.8 1.4 1.4 Interest income (2.6) (1.5) (1.9) (6.7) (12.7) (11.3) INCOME BEFORE INCOME TAXES AND MINORITY INTERESTS 146.4 151.9 148.5 84.2 531.0 484.7 Income tax provision (benefit) 11.5 (3.3) 2.7 (92.4) (81.5) (90.1) Minority interests 4.7 1.8 3.8 1.5 11.8 0.6 INCOME FROM CONTINUING OPERATIONS 130.2 153.4 142.0 175.1 600.7 574.2 Gain (loss) from discontinued operations, net of taxes - - - - - 37.6 NET INCOME $130.2 $153.4 $142.0 $175.1 $600.7 $611.8 Diluted number of shares (weighted average in millions) 1 269.36 269.76 268.82 268.14 269.19 Diluted EPS $0.48 $0.57 $0.53 $0.65 $2.23 1 EBITDA $259.4 $278.8 $270.7 $271.5 $1,080.4 Reflects the company's February 22, 2006 two-for-one stock split. 1 Adjusted for discontinued operations of Patriot Coal Corporation and the assets held for sale. 2 This information is intended to be reviewed in conjunction with the company's filings with the Securities and Exchange Commission.
  • 4. PEABODY ENERGY CORPORATION Quarterly Consolidated Income Statements (Dollars in millions, except per share data) Quarters Ended (Unaudited) (Audited) March 31, June 30, Sept. 30, Dec. 31, Year Ended 2007 2007 2007 2007 Dec. 31, 2007 REVENUES Sales $1,059.5 $1,023.6 $1,138.0 $1,114.1 $4,335.1 Other revenues 50.3 45.2 60.5 54.0 210.0 Total revenues 1,109.8 1,068.8 1,198.5 1,168.1 4,545.1 COSTS AND EXPENSES Operating costs and expenses 846.7 823.1 980.1 882.6 3,532.5 Depreciation, depletion and amortization 81.9 88.5 89.3 92.5 352.2 Asset retirement obligation expense 5.7 3.8 5.0 9.1 23.7 Selling and administrative expenses 31.7 32.1 33.2 50.1 147.1 Other operating income: Net gain on disposal or exchange of assets (1.4) (53.0) (21.9) (12.3) (88.6) Income from equity affiliates (2.2) (4.3) (2.9) (5.0) (14.5) OPERATING PROFIT 147.4 178.6 115.7 151.1 592.7 Interest expense 57.5 58.6 58.7 60.2 235.0 Interest income (2.8) (1.5) (1.5) (1.3) (7.1) INCOME BEFORE INCOME TAXES AND MINORITY INTERESTS 92.7 121.5 58.5 92.2 364.8 Income tax provision (benefit) 11.1 17.0 6.7 (107.6) (72.9) Minority interests (0.3) 4.8 (3.2) (3.6) (2.3) INCOME FROM CONTINUING OPERATIONS 81.9 99.7 55.0 203.4 440.0 Income (loss) from discontinued operations, net of taxes 6.6 8.0 (22.7) (167.6) (175.7) NET INCOME $88.5 $107.7 $32.3 $35.8 $264.3 Diluted number of shares (weighted average in millions) 268.12 268.71 268.94 270.54 269.17 Diluted EPS $0.30 $0.37 $0.20 $0.13 $0.98 EBITDA $235.0 $270.9 $210.0 $252.7 $968.6 This information is intended to be reviewed in conjunction with the company's filings with the Securities and Exchange Commission.
  • 5. PEABODY ENERGY CORPORATION Quarterly Consolidated Income Statements (Dollars in millions, except per share data) (Unaudited) Quarter Ended March 31, June 30, Sept. 30, Dec. 31, Year Ended 2008 2008 2008 2008 Dec. 31, 2008 REVENUES Sales $1,189.7 $1,422.1 $1,761.8 $1,662.7 $6,036.3 Other revenues 86.3 108.8 143.9 218.1 557.1 Total revenues 1,276.0 1,530.9 1,905.7 1,880.8 6,593.4 COSTS AND EXPENSES Operating costs and expenses 1,013.7 1,048.5 1,253.0 1,301.8 4,617.2 Depreciation, depletion and amortization 94.0 93.6 103.8 114.9 406.2 Asset retirement obligation expense 6.8 9.2 15.8 16.4 48.2 Selling and administrative expenses 50.9 43.1 44.2 63.6 201.8 Other operating income: Net gain on disposal or exchange of assets (59.4) (3.6) (4.8) (5.1) (72.9) (Income) loss from equity affiliates (2.7) (3.7) 3.5 3.0 - OPERATING PROFIT 172.7 343.8 490.2 386.2 1,392.9 Interest expense 59.3 57.6 54.1 55.2 226.2 Interest income (1.1) (2.5) (3.5) (3.0) (10.1) INCOME BEFORE INCOME TAXES AND MINORITY INTERESTS 114.5 288.7 439.6 334.0 1,176.8 Income tax provision 44.1 43.6 60.2 37.9 185.8 Minority interests 0.9 2.5 2.3 0.5 6.2 INCOME FROM CONTINUING OPERATIONS 69.5 242.6 377.1 295.6 984.8 Loss from discontinued operations, net of taxes (12.3) (9.2) (7.5) (2.3) (31.3) NET INCOME $57.2 $233.4 $369.6 $293.3 $953.5 Diluted number of shares (weighted average in millions) 272.14 272.66 272.62 267.39 271.28 Diluted EPS $0.26 $0.89 $1.38 $1.10 $3.51 EBITDA $273.5 $446.6 $609.8 $517.5 $1,847.3 This information is intended to be reviewed in conjunction with the company's filings with the Securities and Exchange Commission.