1. RYDER SYSTEM, INC. AND SUBSIDIARIES
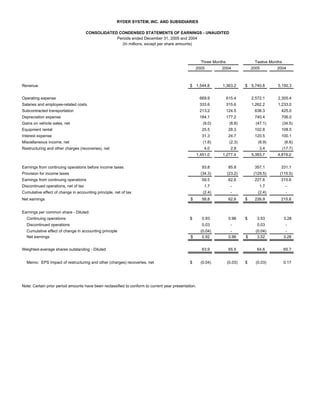
CONSOLIDATED CONDENSED STATEMENTS OF EARNINGS - UNAUDITED
Periods ended December 31, 2005 and 2004
(In millions, except per share amounts)
Three Months Twelve Months
2005 2004 2005 2004
Revenue $ 1,544.8 1,363.2 $ 5,740.8 5,150.3
Operating expense 669.9 615.4 2,572.1 2,305.4
Salaries and employee-related costs 333.6 315.6 1,262.2 1,233.0
Subcontracted transportation 213.2 124.5 638.3 425.0
Depreciation expense 184.1 177.2 740.4 706.0
Gains on vehicle sales, net (9.0) (8.8) (47.1) (34.5)
Equipment rental 25.5 28.3 102.8 108.5
Interest expense 31.3 24.7 120.5 100.1
Miscellaneous income, net (1.6) (2.3) (8.9) (6.6)
Restructuring and other charges (recoveries), net 4.0 2.8 3.4 (17.7)
1,451.0 1,277.4 5,383.7 4,819.2
Earnings from continuing operations before income taxes 93.8 85.8 357.1 331.1
Provision for income taxes (34.3) (23.2) (129.5) (115.5)
Earnings from continuing operations 59.5 62.6 227.6 215.6
Discontinued operations, net of tax 1.7 - 1.7 -
Cumulative effect of change in accounting principle, net of tax (2.4) - (2.4) -
Net earnings $ 58.8 62.6 $ 226.9 215.6
Earnings per common share - Diluted:
Continuing operations $ 0.93 0.96 $ 3.53 3.28
Discontinued operations 0.03 - 0.03 -
Cumulative effect of change in accounting principle (0.04) - (0.04) -
Net earnings $ 0.92 0.96 $ 3.52 3.28
Weighted-average shares outstanding - Diluted 63.9 65.5 64.6 65.7
Memo: EPS Impact of restructuring and other (charges) recoveries, net $ (0.04) (0.03) $ (0.03) 0.17
Note: Certain prior period amounts have been reclassified to conform to current year presentation.
2. RYDER SYSTEM, INC. AND SUBSIDIARIES
CONSOLIDATED CONDENSED BALANCE SHEETS - UNAUDITED
PRELIMINARY AND SUBJECT TO RECLASSIFICATION
(Dollars in millions)
December 31, December 31,
2005 2004
Assets:
Cash and cash equivalents $ 128.7 101.0
Other current assets 1,035.1 951.0
Revenue earning equipment, net 3,794.4 3,506.6
Operating property and equipment, net 486.8 480.4
Other assets 588.3 598.9
$ 6,033.3 5,637.9
Liabilities and shareholders' equity:
Short-term debt / Current portion of long-term debt $ 269.4 389.5
Other current liabilities 984.0 1,065.3
Long-term debt 1,916.0 1,393.7
Other non-current liabilities (including deferred income taxes) 1,336.4 1,279.2
Shareholders' equity 1,527.5 1,510.2
$ 6,033.3 5,637.9
SELECTED KEY RATIOS
December 31, December 31,
2005 2004
Debt to equity 143% 118%
Total obligations to equity (a) * 151% 129%
Twelve months ended December 31,
2005 2004
Return on average shareholders' equity (b) 14.6% 15.3%
Return on average assets (b) 3.9% 3.9%
Average asset turnover 97.6% 94.3%
Return on capital* 7.8% 7.7%
(a) Total obligations represent debt plus off-balance sheet equipment obligations.
(b) Includes discontinued operations and the effect of accounting changes.
* Non-GAAP financial measure; see reconciliation to closest GAAP financial measure included within this
release.
Note: Certain prior period amounts have been reclassified to conform to current year presentation.
3. RYDER SYSTEM, INC. AND SUBSIDIARIES
BUSINESS SEGMENT REVENUE AND EARNINGS - UNAUDITED
Periods ended December 31, 2005 and 2004
(Dollars in millions)
Three Months Twelve Months
2005 2004 B(W) 2005 2004 B(W)
Revenue:
Fleet Management Solutions:
Full service lease $ 451.1 $ 447.6 0.8% $ 1,785.6 $ 1,766.7 1.1%
Contract maintenance 32.6 33.7 (3.3%) 134.5 136.3 (1.3%)
Contract-related maintenance 48.4 46.5 4.0% 194.7 178.1 9.3%
Commercial rental 175.3 174.8 0.3% 686.3 649.8 5.6%
Other 16.2 16.7 (2.5%) 63.8 69.7 (8.5%)
Fuel 292.5 231.2 26.5% 1,056.3 802.2 31.7%
Total Fleet Management Solutions 1,016.1 950.5 6.9% 3,921.2 3,602.8 8.8%
Supply Chain Solutions 482.7 367.4 31.4% 1,637.8 1,354.0 21.0%
Dedicated Contract Carriage 142.5 128.5 10.9% 543.3 506.2 7.3%
Eliminations (96.5) (83.2) (16.0%) (361.5) (312.7) (15.6%)
Total revenue $ 1,544.8 1,363.2 13.3% $ 5,740.8 5,150.3 11.5%
Business segment earnings:
Earnings before income taxes:
Fleet Management Solutions $ 92.0 89.5 2.8% $ 354.4 312.7 13.3%
Supply Chain Solutions 14.0 11.4 22.3% 39.4 37.1 6.2%
Dedicated Contract Carriage 10.4 6.8 51.6% 35.1 29.5 19.3%
Eliminations (9.5) (9.3) (0.6%) (32.7) (32.8) 0.2%
106.9 98.4 8.6% 396.2 346.5 14.3%
Unallocated Central Support Services (9.1) (9.8) 7.4% (35.7) (33.1) (8.1%)
Earnings from continuing operations before restructuring and
other (charges) recoveries, net and income taxes 97.8 88.6 10.4% 360.5 313.4 15.0%
Restructuring and other (charges) recoveries, net (4.0) (2.8) (42.5%) (3.4) 17.7 NM
Earnings from continuing operations before income taxes 93.8 85.8 9.3% 357.1 331.1 7.8%
Provision for income taxes (34.3) (23.2) (48.1%) (129.5) (115.5) (12.1%)
Earnings from continuing operations 59.5 62.6 (5.0%) 227.6 215.6 5.6%
Discontinued operations, net of tax 1.7 - NM 1.7 - NM
Cumulative effect of change in accounting principle, net of tax (2.4) - NM (2.4) - NM
Net earnings $ 58.8 62.6 (6.1%) $ 226.9 215.6 5.3%
Note: Certain prior period amounts have been reclassified to conform to current year presentation.
Amounts may not recalculate due to rounding.
4. RYDER SYSTEM, INC. AND SUBSIDIARIES
BUSINESS SEGMENT INFORMATION - UNAUDITED
Periods ended December 31, 2005 and 2004
(Dollars in millions)
Three Months Twelve Months
2005 2004 B(W) 2005 2004 B(W)
Fleet Management Solutions
Total revenue $ 1,016.1 950.5 6.9% $ 3,921.2 3,602.8 8.8%
Fuel revenue (292.5) (231.2) 26.5% (1,056.3) (802.2) 31.7%
Operating revenue * $ 723.6 719.3 0.6% $ 2,864.9 2,800.6 2.3%
Segment earnings before income taxes $ 92.0 89.5 2.8% $ 354.4 312.7 13.3%
Earnings before income taxes as % of total revenue 9.1% 9.4% 9.0% 8.7%
Earnings before income taxes as % of operating revenue * 12.7% 12.4% 12.4% 11.2%
Supply Chain Solutions
Total revenue $ 482.7 367.4 31.4% $ 1,637.8 1,354.0 21.0%
Subcontracted transportation (208.5) (121.5) 71.6% (622.0) (415.3) 49.8%
Operating revenue * $ 274.2 245.9 11.5% $ 1,015.8 938.7 8.2%
Segment earnings before income taxes $ 14.0 11.4 22.3% $ 39.4 37.1 6.2%
Earnings before income taxes as % of total revenue 2.9% 3.1% 2.4% 2.7%
Earnings before income taxes as % of operating revenue * 5.1% 4.6% 3.9% 4.0%
Memo: Fuel costs $ 25.5 19.2 (32.6%) $ 92.0 65.7 (40.0%)
Dedicated Contract Carriage
Total revenue $ 142.5 128.5 10.9% $ 543.3 506.2 7.3%
Subcontracted transportation (4.7) (3.0) 56.7% (16.3) (9.7) 68.7%
Operating revenue * $ 137.8 125.5 9.8% $ 527.0 496.5 6.1%
Segment earnings before income taxes $ 10.4 6.8 51.6% $ 35.1 29.5 19.3%
Earnings before income taxes as % of total revenue 7.3% 5.3% 6.5% 5.8%
Earnings before income taxes as % of operating revenue * 7.5% 5.5% 6.7% 5.9%
Memo: Fuel costs $ 26.4 20.2 (30.4%) $ 94.1 72.5 (29.7%)
* Non-GAAP financial measure
Note: Certain prior period amounts have been reclassified to conform to current year presentation.
Amounts may not recalculate due to rounding.
5. RYDER SYSTEM, INC. AND SUBSIDIARIES
NON-GAAP FINANCIAL MEASURE RECONCILIATIONS - PRELIMINARY AND UNAUDITED
Periods ended December 31, 2005 and 2004
(In millions, except per share amounts)
FREE CASH FLOW RECONCILIATION Twelve Months
2005 2004
Net cash provided by operating activities $ 779.1 866.8
Net cash used in investing activities (988.9) (720.1)
Free cash flow * $ (209.8) 146.7
DEBT TO EQUITY RECONCILIATION December 31, December 31,
2005 % to Equity % to Equity
2004
On-balance sheet debt $ 2,185.4 143% $ 1,783.2 118%
Off-balance sheet debt - PV of minimum lease payments and guaranteed
residual values under operating leases for vehicles (a) 117.0 161.1
Total obligations * $ 2,302.4 151% $ 1,944.3 129%
NET EARNINGS Three Months Twelve Months
2005 2004 2005 2004
Earnings from continuing operations $ 59.5 $ 62.6 $ 227.6 $ 215.6
Less: Net tax benefits - 9.2 7.6 9.2
Gain on sale of headquarters complex, net of tax - - - 15.4
Earnings from continuing operations excluding net tax benefits and
gain on sale of headquarters complex* $ 59.5 $ 53.4 $ 220.0 $ 191.0
EPS RECONCILIATION Three Months Twelve Months
2005 2004 2005 2004
Earnings from continuing operations $ 0.93 0.96 $ 3.53 3.28
Less: Net tax benefits - 0.14 0.12 0.14
Gain on sale of headquarters complex, net of tax - - - 0.23
Earnings from continuing operations excluding net tax benefits and
gain on sale of headquarters complex* $ 0.93 $ 0.82 $ 3.41 $ 2.91
RETURN ON CAPITAL RECONCILIATION
Twelve months ended December 31,
2005 2004
Net earnings [1] $ 226.9 $ 215.6
Discontinued operations, net of tax (1.7) -
Cumulative effect of change in accounting principle, net of tax 2.4 -
Earnings from continuing operations 227.6 215.6
Restructuring - Gain on sale of headquarters complex - (24.3)
Provision for income taxes 129.5 115.5
Earnings before net restructuring and income taxes 357.1 306.8
Interest expense 120.5 100.1
Implied interest expense from off-balance sheet debt 6.6 6.0
Adjusted earnings before income taxes 484.2 412.9
Adjusted income taxes (185.9) (155.5)
Adjusted earnings from continuing operations (Non-GAAP) [2] $ 298.3 $ 257.4
Average total debt $ 2,147.8 $ 1,811.5
Average shareholders' equity 1,554.7 1,412.0
Total capital (GAAP) [3] 3,702.6 3,223.5
Adjustments to capital (b) (4.7) (16.4)
Average off-balance sheet debt 147.9 151.8
Adjusted total capital (Non-GAAP) [4] $ 3,845.7 $ 3,358.9
Return on capital (GAAP) [1] / [3] 6.13% 6.69%
Return on capital (Non-GAAP) [2] / [4] 7.76% 7.66%
(a) Discounted at the incremental borrowing rate at lease inception.
(b) Amounts represent adjustments made to equity to conform to the adjustments to the earnings calculation.
* Non-GAAP financial measure
Note: Earnings per share amounts are calculated independently for each component and may not be additive due to rounding.
Certain prior period amounts have been reclassified to conform to current year presentation.